A note on lower timeframe confirming price action…
Waiting for lower timeframe confirmation is our main tool to confirm strength within higher timeframe zones, and has really been the key to our trading success. It takes a little time to understand the subtle nuances, however, as each trade is never the same, but once you master the rhythm so to speak, you will be saved from countless unnecessary losing trades. The following is a list of what we look for:
- A break/retest of supply or demand dependent on which way you’re trading.
- A trendline break/retest.
- Buying/selling tails/wicks – essentially we look for a cluster of very obvious spikes off of lower timeframe support and resistance levels within the higher timeframe zone.
- Candlestick patterns. We tend to stick with pin bars and engulfing bars as these have proven to be the most effective.
We search for lower timeframe confirmation between the M15 and H1 timeframes, since most of our higher-timeframe areas begin with the H4. Stops are usually placed 3-5 pips beyond confirming structures.
EUR/USD:
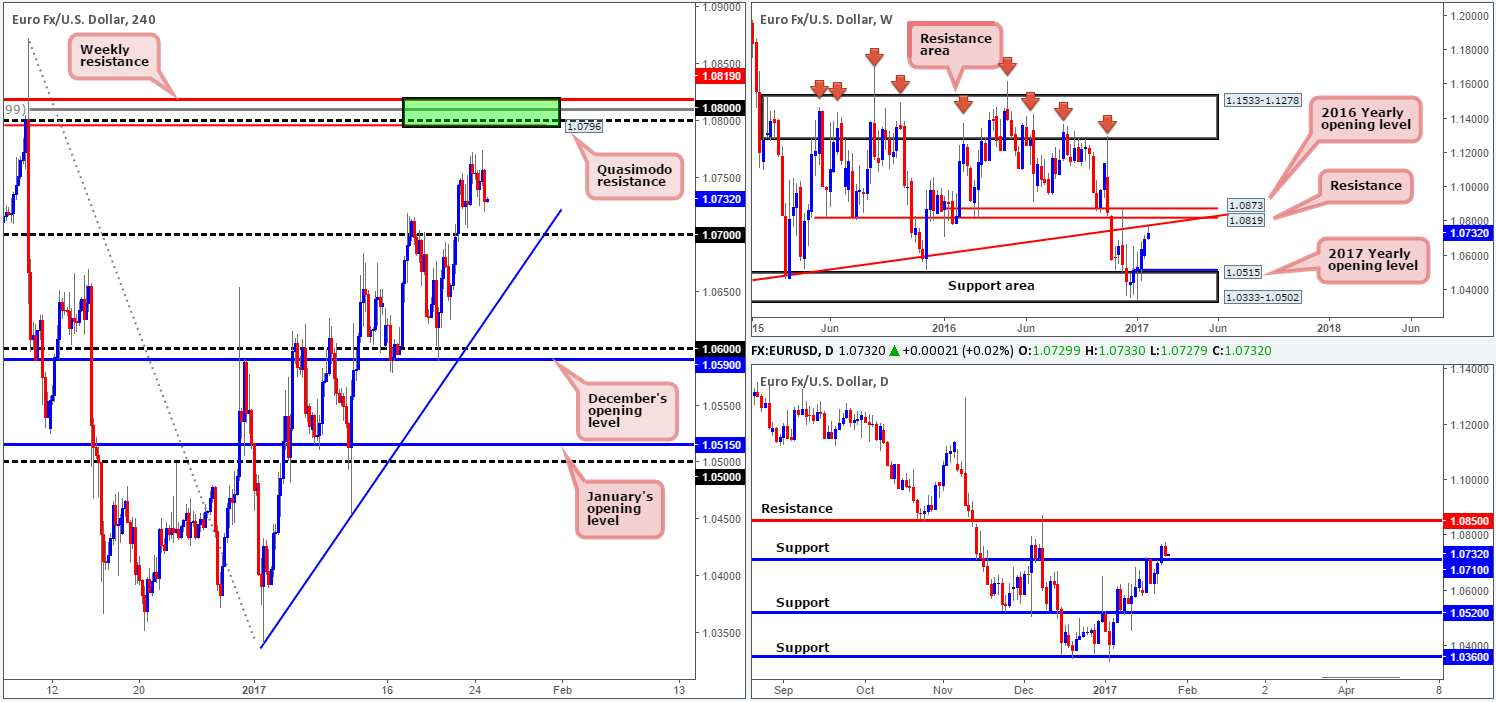
Having failed to sustain gains beyond Monday’s high point at 1.0773 amid yesterday’s US open, we witnessed a modest selloff to lows of 1.0720. Despite lower-than-expected US existing home sales data, the single currency ended the session breaking a three-day bullish phase, claiming around 60% of Monday’s gains.
Looking over to the weekly candles, we can see that price recently struck a long-term weekly trendline resistance stretched from the low 0.8231. From this angle, price could very well continue to descend lower today, as the next support target on this scale does not come into view until 1.0333-1.0502: a weekly support area. Be that as it may, before weekly sellers can achieve this, it may be worth noting that a daily support hurdle is waiting at 1.0710!
Our suggestions: We see two possible scenarios playing out:
- Weekly sellers overwhelm the daily buyers and force H4 action to close below the 1.07 handle. Should this be the case, one could look to trade any retest of this hurdle thereafter (preferably alongside a lower-timeframe confirming sell signal – see the top of this report), targeting the H4 trendline support extended from the low 1.0340.
- The bulls march higher and break yesterday’s high 1.0774, leaving price free to challenge the H4 Quasimodo resistance level at 1.0796. Not only does this level sit nearby the 1.08 handle, it also boasts a deep 88.6% Fib resistance at 1.0809 and is planted nearby a weekly resistance at 1.0819 and the aforementioned long-term weekly trendline resistance (green rectangle – H4 chart). We would, dependent on the time of day, look to enter short at market from here, targeting the nearest H4 demand formed on approach.
Data points to consider: German IFO business survey at 9am GMT.
Levels to watch/live orders:
- Buys: Flat (stop loss: N/A).
- Sells: 1.08 region ([dependent on the time of day, this is an area we would consider trading without confirmation] stop loss: 1.0825 [aggressive stop] 1.0875 [conservative stop]). Watch for a H4 close to be seen below 1.07 and then look to trade any retest seen thereafter ([waiting for a lower-timeframe confirming setup to form following the retest is advised prior to pulling the trigger] stop loss: dependent on where one confirms this area).
GBP/USD:
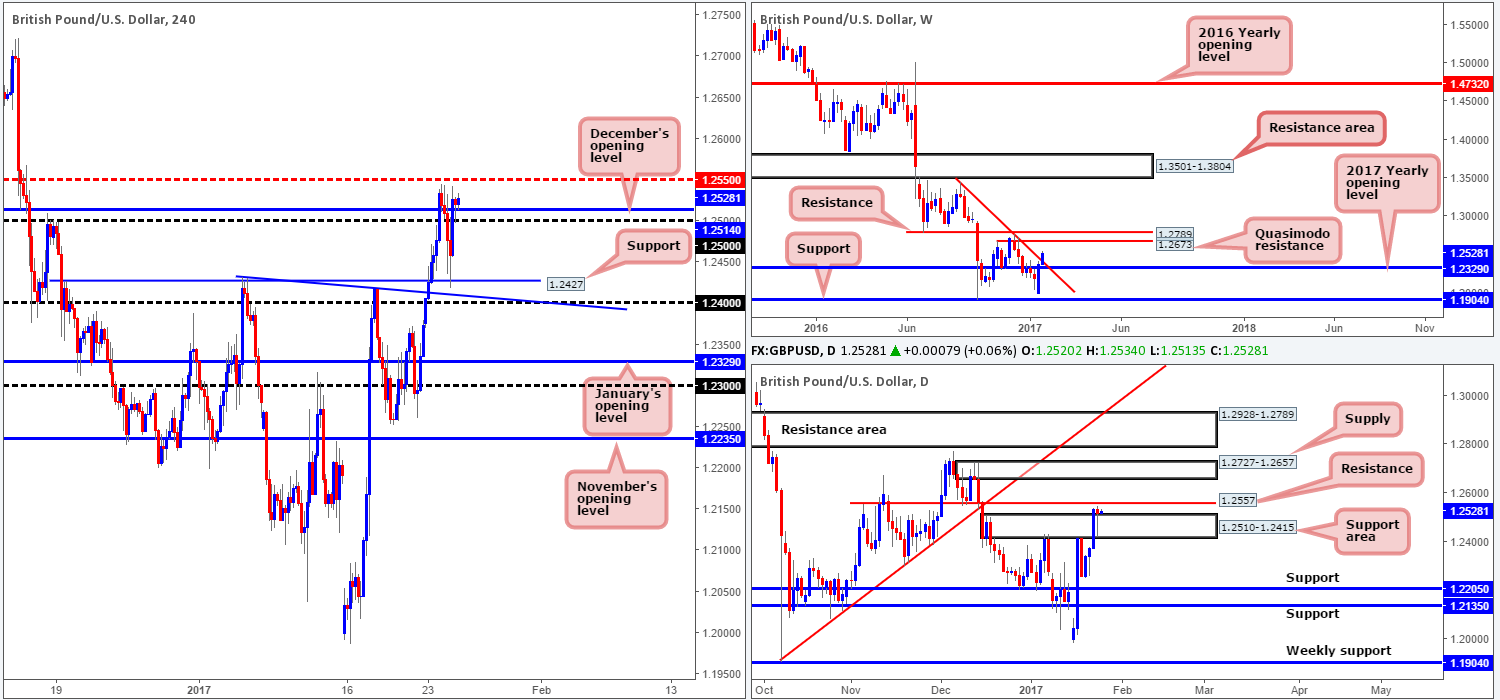
The GBP slipped below the 1.25 figure during the early hours of Europe yesterday and extended losses to a low of 1.2418 during the London morning segment. In latest news, the UK’s highest court ruled against the government, essentially saying that the Prime Minister will need to seek parliamentary approval to trigger Brexit. This, as you can see, exacerbated the London morning selloff. The move south, nevertheless, was a short-lived one. H4 support at 1.2427 held firm and provided a base for a bullish recovery, which pushed price action back above 1.25 and also December’s opening level at 1.2514.
Looking over to the weekly candles, we can see that price has recently peeked above the weekly trendline resistance taken from the high 1.3445. Should the bulls maintain this position, the next upside objective falls in at 1.2673: a weekly Quasimodo resistance level. Alongside this, we can see that yesterday’s price movement formed a nice-looking daily bullish buying tail from within a daily support area at 1.2510-1.2415, and now looks set to cross swords with daily resistance pegged just ahead at 1.2557.
Our suggestions: Based on the latest action, our team has come to a general consensus that entering long right now is just that bit too risky, given the nearby H4 mid-way resistance at 1.2550 and neighboring daily resistance at 1.2557. Ultimately, before we look to become buyers in this market, a daily close above the aforementioned daily resistance would need to be seen. Therefore, opting to stand on the sidelines today may very well be the better, and more importantly the safer, road to take.
Data points to consider: There are no scheduled high-impacting news events on the docket today relating to these two markets.
Levels to watch/live orders:
- Buys: Flat (stop loss: N/A).
- Sells: Flat (stop loss: N/A).
AUD/USD:
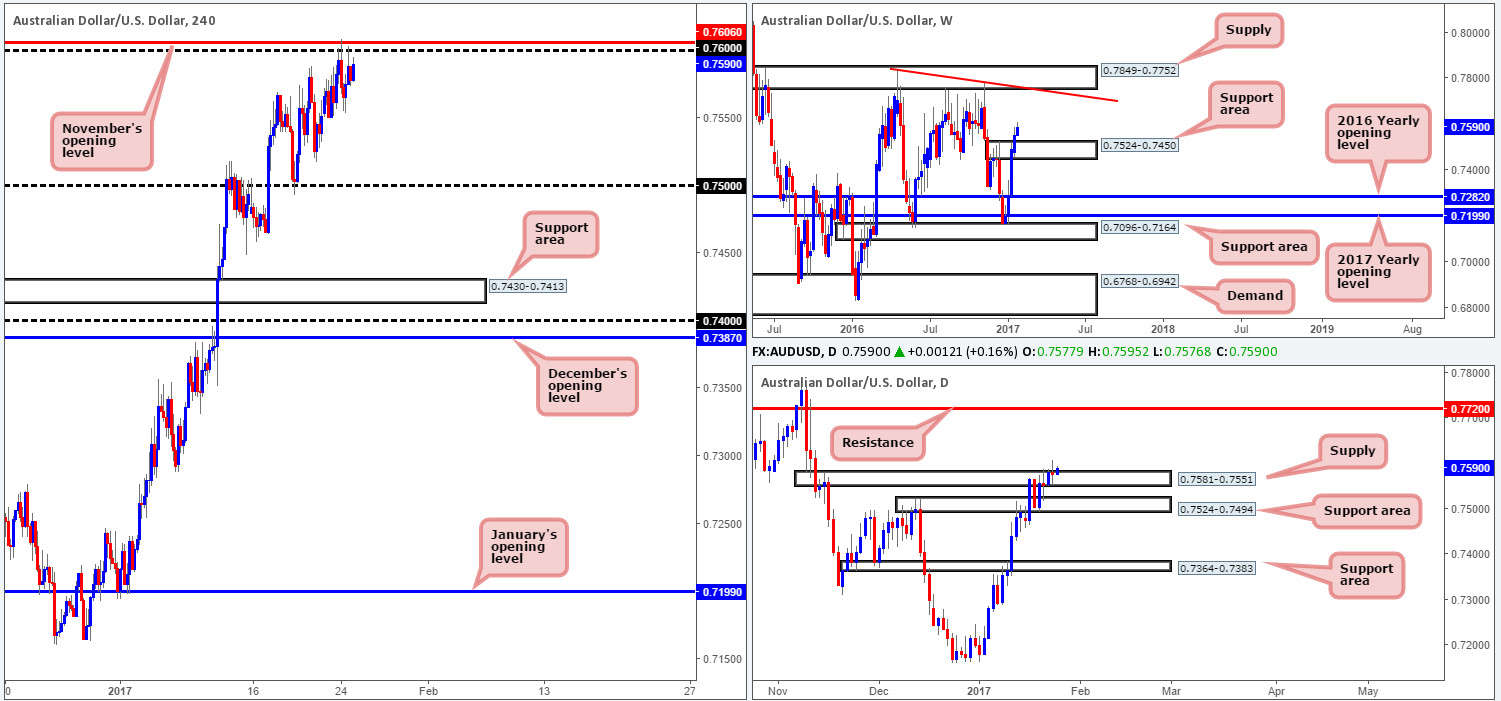
According to weekly structure, Aussie bulls seem to have a slight edge this week. Weekly price recently conquered the weekly supply zone sitting at 0.7524-0.7450 (now acting support area), opening up the possibility for another wave of buying up to weekly supply drawn in at 0.7849-0.7752 (fused with a weekly trendline resistance taken from the high 0.7835). Looking down to the daily chart, we can see that price action formed a daily indecision candle during yesterday’s session around the upper edge of a daily supply area at 0.7581-0.7551. A close above this daily zone could set the stage for further buying up to the daily resistance penciled in at 0.7720 (positioned just below the aforementioned weekly supply area). However, before our team can become buyers, we’d need to see a decisive H4 close above both the round number 0.76 and November’s opening level at 0.7606. The trail beyond here appears reasonably resistance-free up until the 0.77 barrier.
Our suggestions: Unfortunately, neither a long nor short seems attractive at this time. As mentioned above, no longs are permitted until a H4 close is seen above 0.7606. Regarding shorts, we would strongly advise against selling for the time being. The recent weekly close above weekly supply, as well as the daily buyers claiming the top edge of the current daily supply yesterday is enough evidence, in our opinion, to suggest that the bears are weakening.
Data points to consider: Australian inflation data scheduled for release at 12.30am GMT.
Levels to watch/live orders:
- Buys: Watch for a H4 close to be seen above 0.7606 and then look to trade any retest seen thereafter ([waiting for a lower-timeframe confirming setup [see the top of this report] to form following the retest is advised prior to pulling the trigger] stop loss: dependent on where one confirms this area).
- Sells: Flat (stop loss: N/A).
USD/JPY:
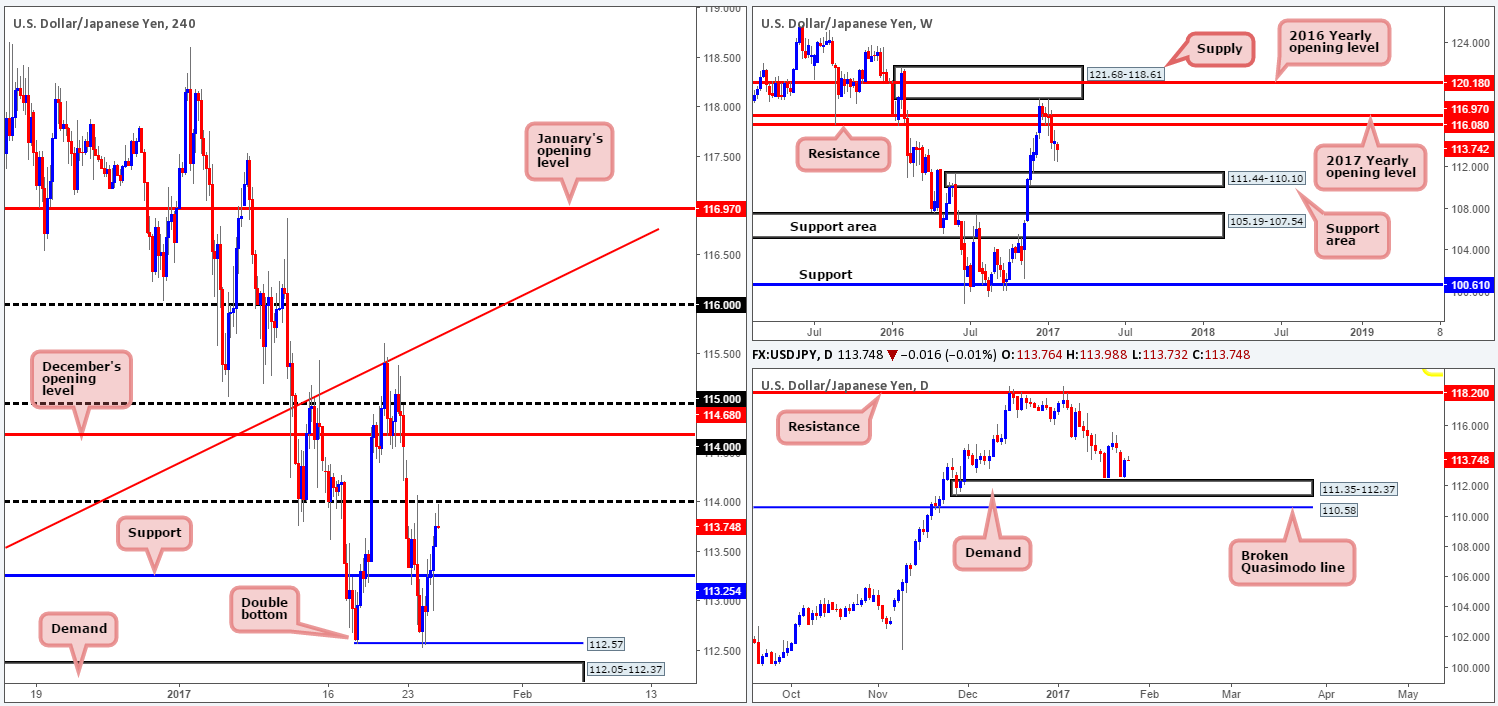
In recent sessions, we can see that the USD/JPY extended Monday’s bounce from 112.57, resulting in price action forming a nice-looking double-bottom formation. H4 resistance at 113.25 (now acting support) was taken out during yesterday’s advance with price tapping a high of 113.89 into the closing bell.
As we write, the current H4 candle is seen selling off just ahead of the psychological handle 114. Assuming that the bears maintain this momentum, the unit could potentially retest H4 support at 113.25. Meanwhile, should this bulls extend yesterday’s rally and munch through offers at 114, December’s opening level at 114.68 would likely be the next barrier on the hit list.
Our suggestions: In view of daily action coming within touching distance of daily demand at 111.35-112.37, further buying may be on the cards today. A H4 close above 114, followed by a retest and a reasonably sized H4 bull candle would, at least in our book, provide one with a high-probability long opportunity, targeting December’s opening level at 114.68, followed closely by the 115 handle.
Apart from this, the only other area of interest is H4 demand coming in at 112.05-112.37, which happens to be located around the top edge of the daily demand zone mentioned above. With the understanding that this H4 demand base has the backing of not only the current daily demand, but also the weekly support area as well, there’s a fair chance that price will respond from here. While this may be true, traders still need to be prepared for the possibility of a fakeout through this zone, as price may want to drive deeper into the above noted higher-timeframe areas before rallying higher. With that being the case, waiting for at least a H4 bull candle to form may be the better path to take.
Data points to consider: There are no scheduled high-impacting news events on the docket today relating to these two markets.
Levels to watch/live orders:
- Buys: Watch for a H4 close to be seen above 114 and then look to trade any retest seen thereafter ([waiting for a reasonably sized H4 bull candle to form following the retest is advised prior to pulling the trigger] stop loss: dependent on where one confirms this area).112.05-112.37 ([a reasonably sized H4 bull candle will need to be seen from here before a trade can be executed] stop loss: ideally beyond the trigger candle).
- Sells: Flat (stop loss: N/A).
USD/CAD:
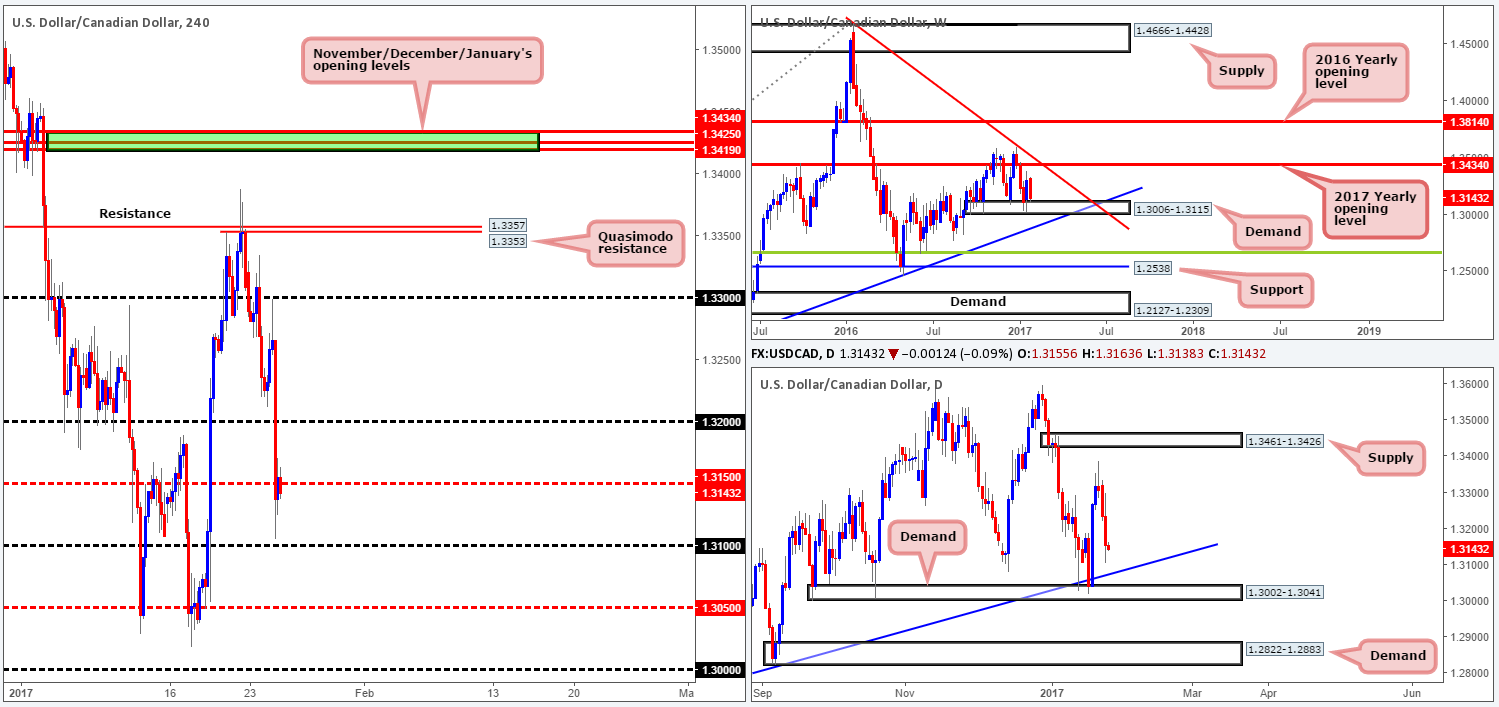
Going into the early hours of yesterday’s US segment, the USD/CAD aggressively plummeted lower from just ahead of the psychological handle 1.33. The pair smashed through the 1.32 level and ended the day whipsawing through H4 mid-way support at 1.3150, leaving the 1.31 handle unchallenged. The move not only saw weekly action reconnect with the weekly demand zone at 1.3006-1.3115, it also placed the daily candles within reaching distance of a daily trendline support extended from the low 1.2654.
While there is a possibility of a rotation to the upside today from 1.3150, given the position of the weekly candles, let’s not forget that daily price may want to tag the above noted daily trendline support level. Therefore, keep an eye on the 1.3050/1.31 area today, as this is where the daily trendline intersects with the H4 chart!
Our suggestions: Keep a tab on 1.3150 for signs of bullish intent. This could be either in the form of a H4 bull candle or a lower-timeframe confirming buy setup (see the top of this report). If 1.3150 fails to hold, we’re confident that a bullish reaction will be seen from within the 1.3050/1.31 zone. As already mentioned, this base is supported by a daily trendline support, as well as also being bolstered by the above noted weekly demand area!
Data points to consider: There are no scheduled high-impacting news events on the docket today relating to these two markets.
Levels to watch/live orders:
- Buys: 1.3150 region ([a reasonably sized H4 bull candle will need to be seen from here before a trade can be executed] stop loss: ideally beyond the trigger candle). 1.3050/1.31 ([while this zone does boast higher-timeframe confluence, we would still advise waiting for at least a H4 bull candle to form within before pressing the buy button] stop loss: ideally beyond the trigger candle).
- Sells: Flat (stop loss: N/A).
USD/CHF:
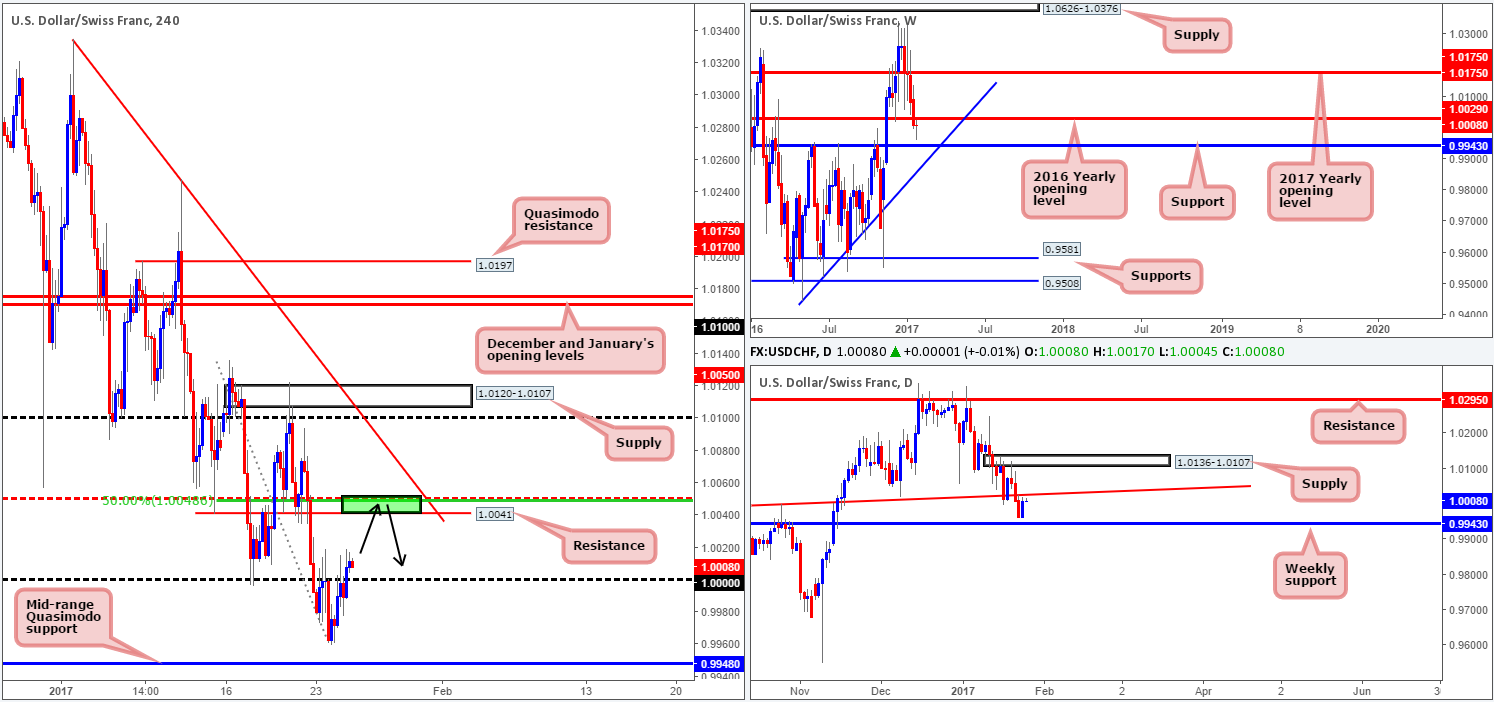
As can be seen from the H4 chart this morning, the Swissy failed to test the H4 mid-range Quasimodo level at 0.9948 yesterday. Instead, the pair corrected itself and reclaimed parity (1.0000), closing the day in positive territory. According to the H4 candles, there is room to extend further north today at least until we reach the H4 resistance at 1.0041, which happens to be positioned nearby a H4 50% Fib resistance at 1.0048 and the H4 mid-way resistance level at 1.0050.
Despite this, we’re going to side step any long setups that may form and focus on shorting from the above noted H4 resistance. Our reasoning lies within the higher-timeframe structure. Over on the weekly chart, price recently clipped the underside of the 2016 yearly opening level at 1.0029. Alongside this, we can see that daily action is trading just ahead of a daily trendline resistance taken from the high 0.9956.
Our suggestions: Keep an eye on the 1.0050/1.0041 green area for selling opportunities. Because the zone is relatively small, one may want to consider waiting for a lower-timeframe sell signal to form here (see the top of this report), before pulling the trigger. Although this will not guarantee a winning trade, it will likely help avoid any unnecessary fakeouts.
Data points to consider: There are no scheduled high-impacting news events on the docket today relating to these two markets.
Levels to watch/live orders:
- Buys: Flat (stop loss: N/A).
- Sells: 1.0050/1.0041 ([wait for a lower-timeframe confirming setup to form before looking to execute a trade] stop loss: dependent on where one confirms this area).
DOW 30:
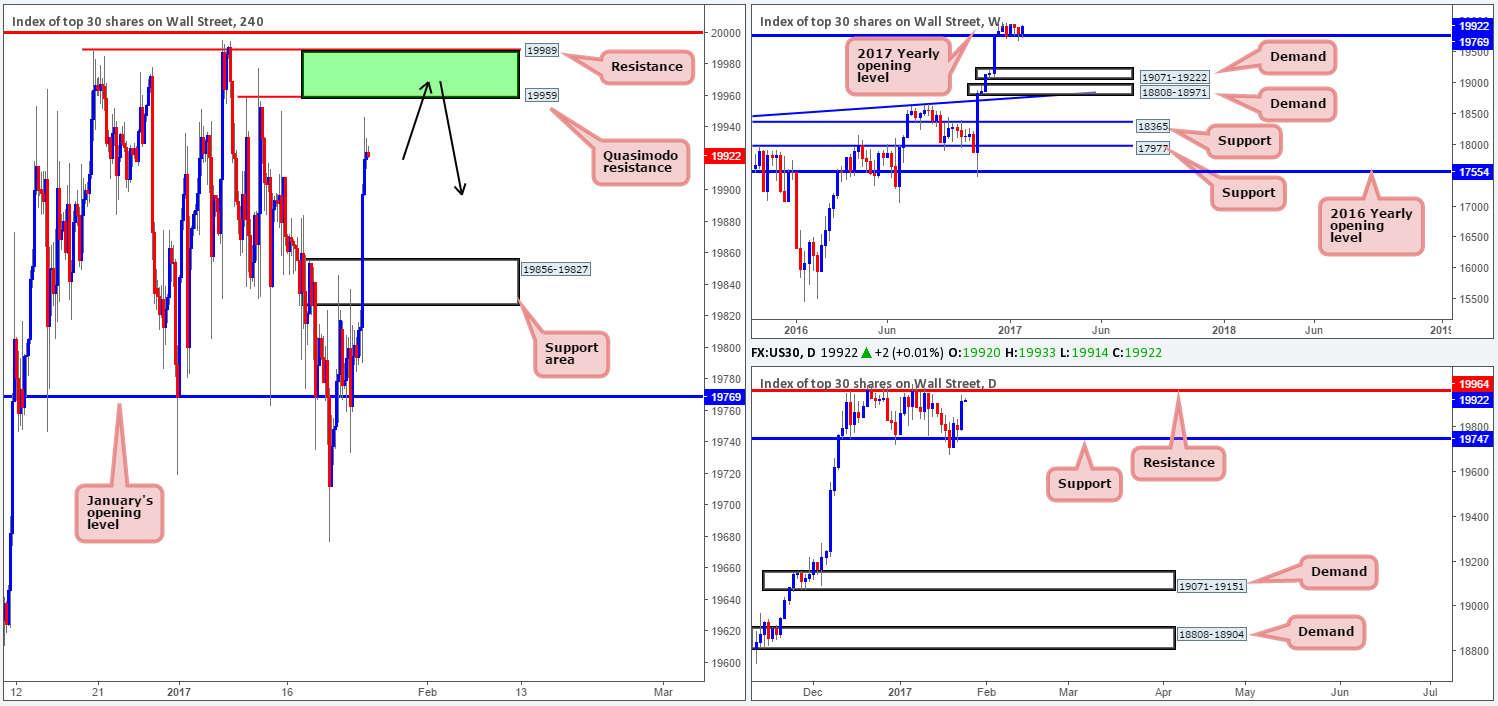
US Equities advanced heavily going into yesterday’s US session, consequently pushing through H4 supply at 19856-19827 (now a support area) and clocking a high of 19946. Just ahead of the H4 candles, a H4 Quasimodo resistance level is seen at 19959, shadowed closely by a H4 resistance level at 19989. The other key thing to note here is the daily resistance level carved from 19964, as this barrier is situated just above the aforementioned H4 Quasimodo resistance line. Until the 19989/19959 neighborhood is consumed, our team is reluctant to enter into any buy trades at current prices, despite the weekly chart showing bullish intentions from the 2017 yearly opening level at 19769.
Our suggestions: In light of the above analysis, our prime focus today will be on shorting from the 19989/19959 H4 zone highlighted in green. To avoid the possibility of a fakeout to the 20000 mark, you may want to consider waiting for a reasonably sized H4 bear candle to form around this area before selling.
Data points to consider: There are no scheduled high-impacting news events on the docket today that will likely affect the US equity market.
Levels to watch/live orders:
- Buys: Flat (stop loss: N/A).
- Sells: 19989/19959 ([a reasonably sized H4 bear candle will need to be seen before a trade can be executed] stop loss: ideally beyond the trigger candle).
GOLD:
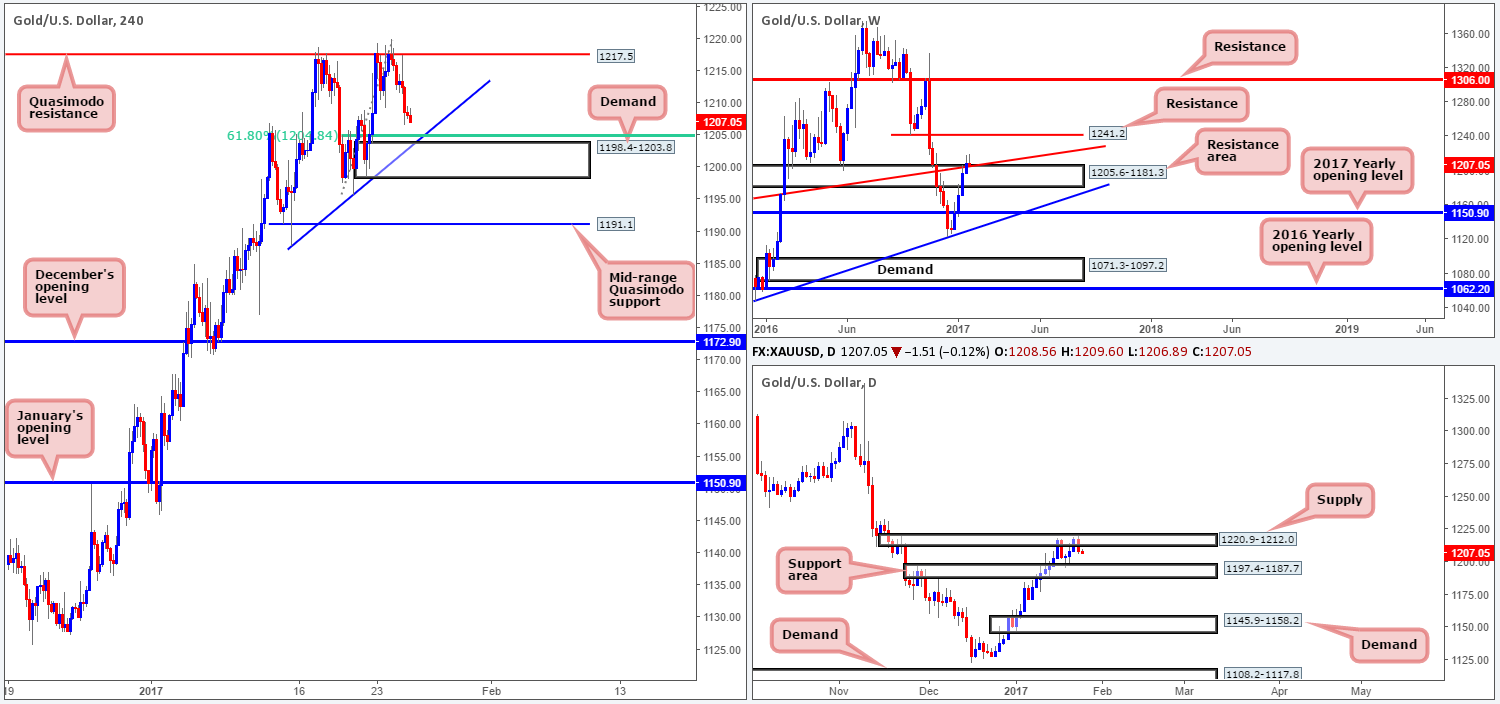
Beginning with the weekly timeframe this morning, price is seen toying with the top edge of a weekly resistance area drawn from 1205.6-1181.3, and its converging weekly trendline resistance extended from the low 1130.1. Since this weekly area boasts historical significance, it may be worth waiting for the weekly candle to close before presuming that this weekly zone is consumed. Moving down to the daily charts, yesterday’s session printed a relatively strong-looking bearish engulfing candle within the walls of a daily supply area at 1220.9-1212.0. On the condition that follow-through selling is seen from here, the next downside target in range is the daily support area logged in at 1197.4-1187.7.
Stepping across to the H4 chart, the H4 Quasimodo resistance level at 1217.5 continued to hold firm yesterday, forcing bullion down to lows of 1206.5. The next area of interest on this scale falls in at 1198.4-1203.8: a H4 demand zone, boasting confluence from a H4 trendline support drawn from the low 1187.7 and a H4 Fib 61.8% support at 1204.8.
Our suggestions: While the current H4 demand base will likely produce a bounce today, it may not be anything to get excited about. Let’s not forget where price is coming from on the bigger picture! The daily bearish engulfing candle that formed within daily supply could, in our opinion, be enough to wipe out this area and push price lower to the aforementioned daily support area. If one still considers the H4 demand base to be valid, we would strongly recommend waiting for a reasonably sized H4 bull candle to form, before pressing the buy button!
Levels to watch/live orders:
- Buys: 1198.4-1203.8 ([a reasonably sized H4 bull candle will need to be seen before a trade can be executed] stop loss: ideally beyond the trigger candle).
- Sells: Flat (stop loss: N/A).


