EUR/USD:
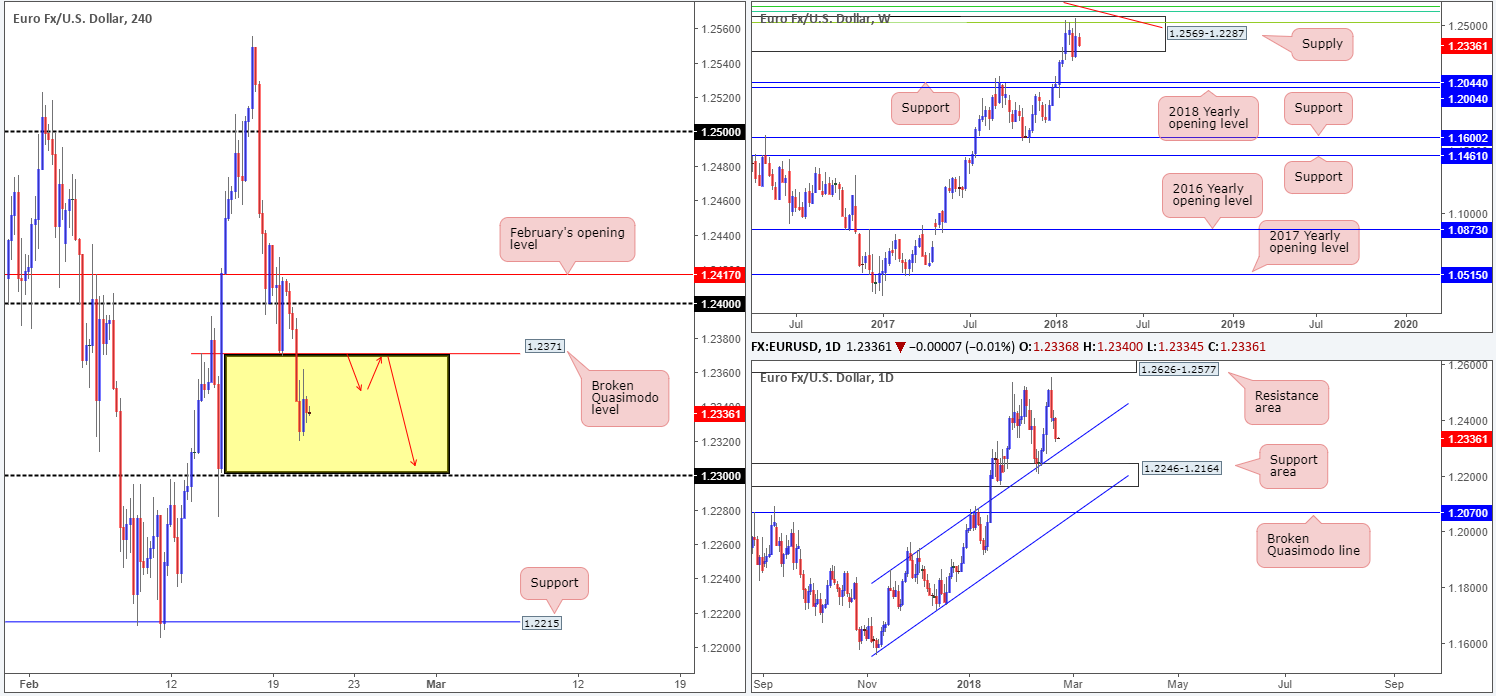
Following a brief spell above the 1.24 handle, EUR/USD sellers took the helm on Tuesday and drove price action to session lows of 1.2320. As we hope is demonstrated on the H4 chart, this has positioned the H4 candles below a H4 broken Quasimodo line at 1.2371 and within what we like to call a ‘price void’, i.e. an area with space to move.
Longer term, however, weekly price remains capped within a weekly supply base coming in at 1.2569-1.2287. Circling around the top edge of this zone, traders may have also noticed a nice-looking Fibonacci resistance cluster (1.2519/1.2604/1.2644), and a long-term weekly trendline resistance taken from the high 1.6038. A little lower on the curve, we can see that daily action shows room to the downside at least until we reach the daily channel resistance-turned support extended from the high 1.1861, followed closely by a daily support area seen at 1.2246-1.2164.
Potential trading zones:
Overall, the team still believes lower prices could be in store.
In view of the recent H4 close beyond 1.2371 into an area of space on the H4 scale, a short at the underside of 1.2371 (targeting the 1.23 handle) is of interest this morning. However, waiting for additional candle confirmation is recommended here (full or near-full-bodied H4 bear candle) in order to avoid a potential fakeout up to the nearby 1.24 handle.
Data points to consider: A slew of European manufacturing between 8/9am; US existing home sales at 3pm; FOMC meeting minutes at 7pm GMT.
Areas worthy of attention:
Supports: 1.23 handle; daily channel support; 1.2246-1.2164.
Resistances: 1.2569-1.2287; weekly Fib resistance cluster; weekly trendline resistance; 1.2371.
GBP/USD:
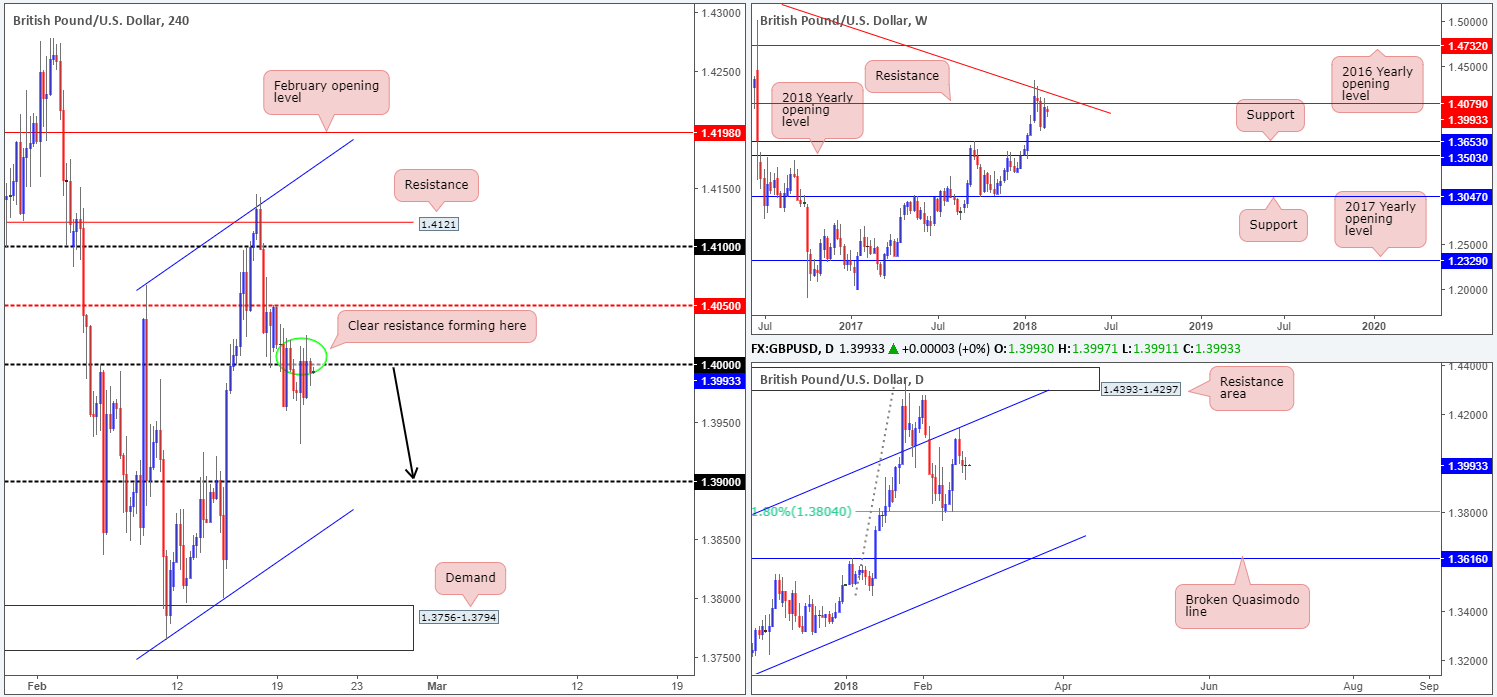
Although there was plenty of ’Brexit’ chatter across the wires on Tuesday, the GBP/USD concluded the day relatively unchanged at the underside of the large psychological barrier 1.40. Below current price, our technicals show a reasonably free run from here down to the 1.23 handle.
A look over at price action on the daily timeframe also highlights that there’s space for the market to push lower – only on this scale we see room to stretch as far south as the 61.8% daily Fib support at 1.3804 – a 100-pip difference to that of the H4 timeframe. Across on the bigger picture, weekly movement remains capped by a weekly resistance plotted at 1.4079, which, as you can see, is closely situated near a weekly trendline resistance etched from the high 1.5930.
Potential trading zones:
With 1.40 clearly attempting to establish itself as resistance at the moment, this could present a selling opportunity with an initial target objective set at the 1.23 number. Due to psychological numbers being prone to fakeouts, nevertheless, waiting for additional candle confirmation in the form of a full or near-full-bodied candle is certainly something to consider before pulling the trigger here!
Data points to consider: UK job’s data at 9.30am; UK inflation report hearings at 2.15pm; US existing home sales at 3pm; FOMC meeting minutes at 7pm GMT.
Areas worthy of attention:
Supports: 1.39 handle; 1.3804.
Resistances: 1.4079; daily channel resistance 1.40 handle.
AUD/USD:
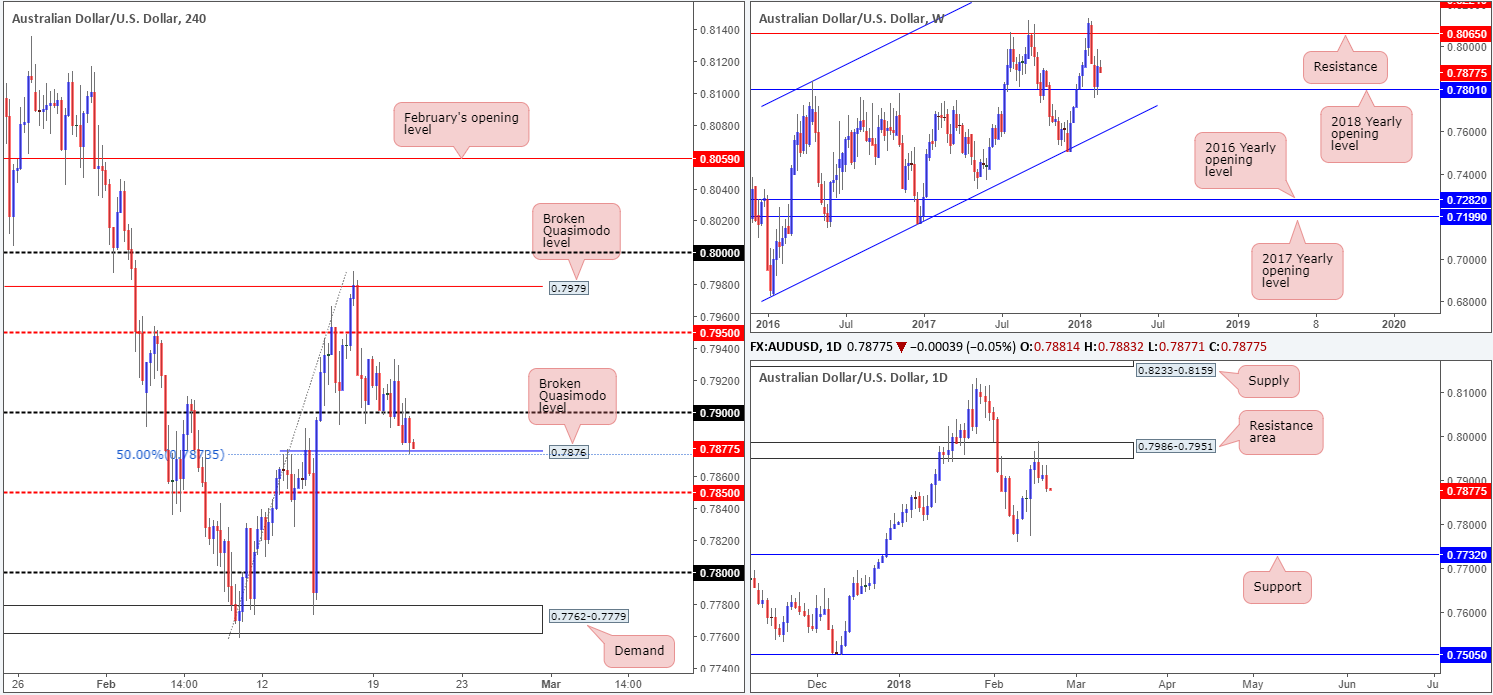
The latest round of RBA minutes saw little impact to market structure, with the unit spending the majority of the Asian session trading around the 0.79 handle. It wasn’t until London’s open did we see this number give way and open up the path south down to a H4 broken Quasimodo line at 0.7876, which happens to align with a 50.0% support value at 0.7873.
Despite broken Quasimodo lines being a favorite of ours, 0.7876 does not air much promise from a technical standpoint. Directly above, we have the 0.79 handle as a potential resistance. Not only that, there’s also the fact that daily price recently traded from a daily resistance area at 0.7986-0.7951and shows little support on the horizon until we reach the 0.7732 range.
What about the 2018 yearly opening level seen on the weekly timeframe at 0.7801? Even though this is credible support, trading long from 0.7876 is still considered a low-probability move given the aforementioned resistances in play right now.
Potential trading zones:
We would also highlight that shorts beyond 0.7876 is likely to be a challenge due to how close the H4 mid-level support at 0.7850 is located (and also considering it has history of holding price).
As far as we can see technical elements are just too mixed at this time, leaving technical traders with little choice but to hold fire until more movement is seen.
Data points to consider: US existing home sales at 3pm; FOMC meeting minutes at 7pm GMT.
Areas worthy of attention:
Supports: 0.7876/0.7873; 0.7801; 0.7732.
Resistances: 0.79 handle; 0.7986-0.7951.
USD/JPY:
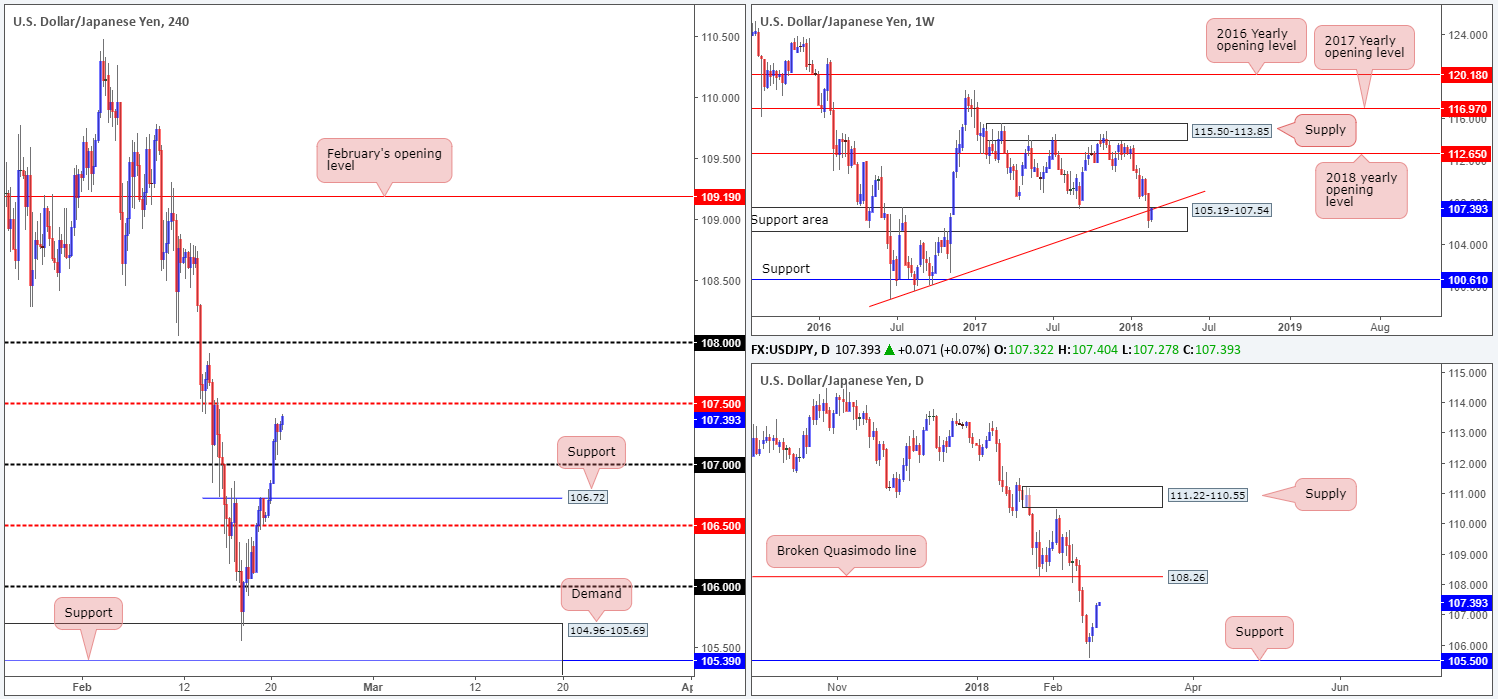
Spurred on by a continued advance in US treasury yields, the USD/JPY market increased its stock for a third consecutive day on Tuesday. This pulled H4 price through the 107 handle and positioned the market within striking distance of the H4 mid-level resistance plotted at 107.50 going into the close. Active sellers likely reside here due to it having been a reasonable support/resistance a few weeks back.
In view of the latest bout of buying activity, weekly price is showing signs of recovery from within the limits of a weekly support area at 105.19-107.54. However, as mentioned in Tuesday’s report, before any meaningful progress can be made, traders will have to contend with the recently broken weekly trendline support-turned resistance extended from the low 98.78. Looking down on the daily candles, nevertheless, the pair shows little resistance on the horizon until we reach the broken Quasimodo line at 108.26.
Potential trading zones:
Despite the recent advance, trading long remains a risky affair, in our opinion. Besides the H4 mid-level resistance at 107.50, one also has to take into account the possibility of active sellers residing around the underside of the recently broken weekly trendline support mentioned above.
If we happen to print a H4 close above 107.50, then we feel longs could be an option on the retest of this number, targeting the 108 handle, followed closely by the daily broken Quasimodo line mentioned above at 108.26.
Data points to consider: US existing home sales at 3pm; FOMC meeting minutes at 7pm GMT.
Areas worthy of attention:
Supports: 105.19-107.54; 105.50; 106.50; 106.72; 107 handle.
Resistances: 108.26; 107.50; 108 handle; weekly trendline resistance.
USD/CAD:
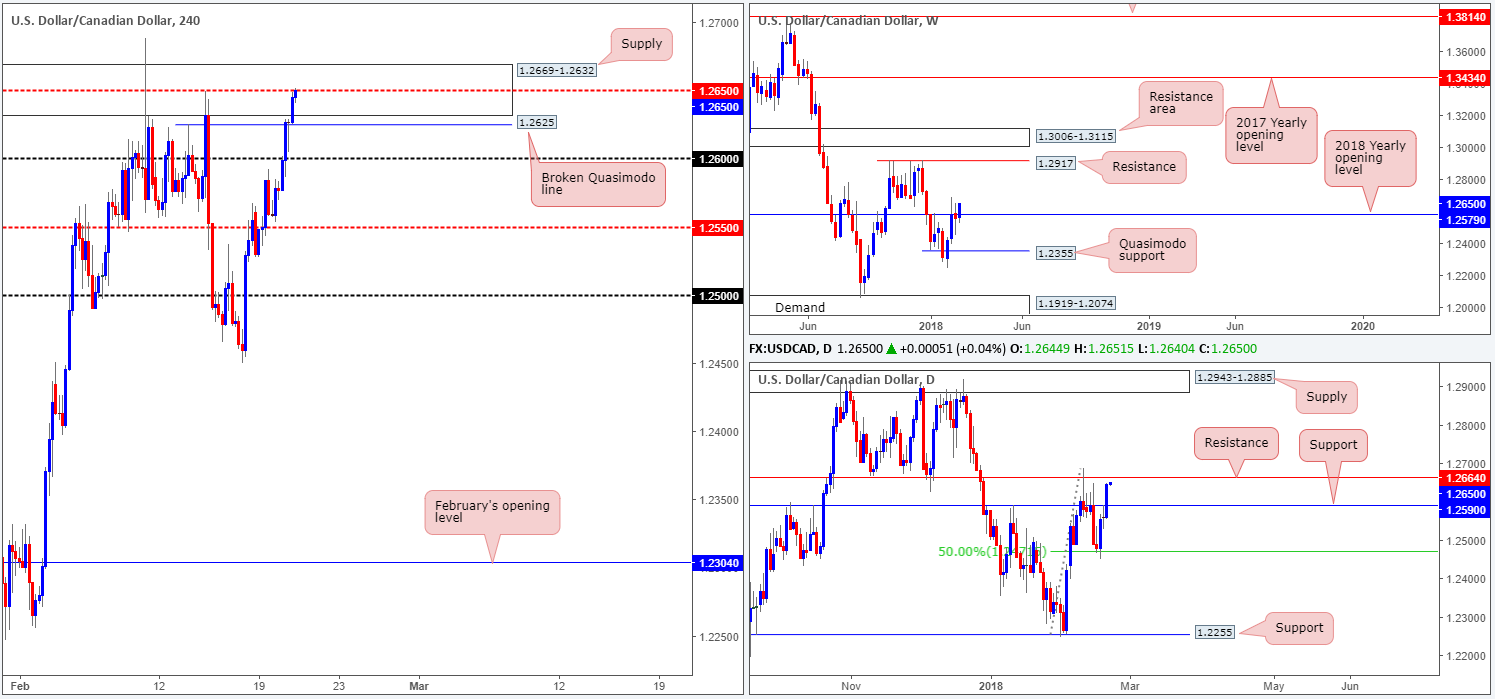
In recent trading, we have seen the USD/CAD climb back above the 2018 yearly opening level at 1.2579. This could, assuming that the bulls remain in the driving seat, eventually set the stage for a continuation move north up to weekly resistance plotted at 1.2917. Before we all reach for our bullish caps, however, it might be worth noting that a few pips ahead of current price is a daily resistance level seen at 1.2664. The pair is likely to find some resistance around this line with it having been a strong barrier of support in the past.
Across on the H4 timeframe, the recent advance has seen the piece drive into a H4 supply area coming in at 1.2669-1.2632 and shake hands with the 1.2650 mid-point level. A rejection off 1.2650 will likely lead to a test of 1.2625: a nearby H4 broken Quasimodo line (not too far beyond this line we also have the 1.26 handle eyed).
Potential trading zones:
According to our technical drawings, the USD/CAD is somewhat snookered at the moment!
- Upside is capped by the H4 mid-level resistance, H4 supply and daily resistance.
- Downside now has the 2018 yearly opening level as support, a H4 broken Quasimodo line and the 1.26 handle.
When price action indicates a restricted view, remaining on the sidelines is likely the best position to take.
Data points to consider: US existing home sales at 3pm; FOMC meeting minutes at 7pm GMT.
Areas worthy of attention:
Supports: 1.26 handle; 1.2625; 1.2590; 1.2579.
Resistances: 1.2650; 1.2664; 1.2917; 1.2669-1.2632.
USD/CHF:
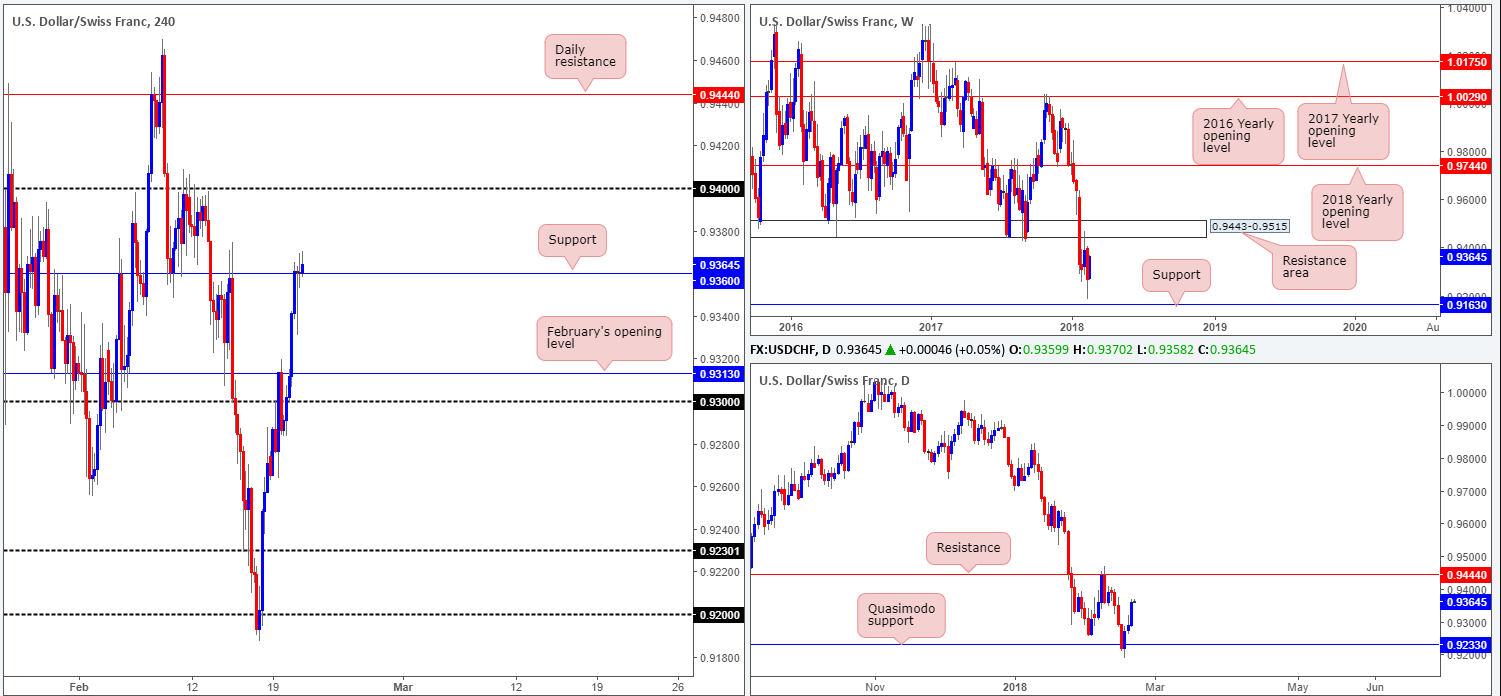
On The back of higher US treasury yields and a more robust US dollar, the USD/CHF chalked up its third consecutive daily gain on Tuesday, reaching highs of 0.9369. February’s opening band at 0.9313 and eventually the H4 resistance level at 0.9360 (now acting support) were both taken out amid yesterday’s advance, potentially opening up the possibility for further upside to the 0.94 handle.
Weekly flow, according to our structure, shows that the unit is trading within striking distance of a major weekly resistance area coming in at 0.9443-0.9515. This is also emphasized on the daily chart in the form of a daily resistance level plotted at 0.9444 (which essentially represents the underside of the noted weekly zone).
Potential trading zones:
Intraday longs above the current H4 support could be something to consider today, targeting 0.94, possibly followed by a final target of 0.9444 (daily resistance). However, to be on the safe side, we would advise waiting for the bulls to make a stand, before pulling the trigger. What we mean by this is we would like to see some form of buyer intent i.e. a reasonably sized full or near-full-bodied H4 bull candle. Yes, this will lower the potential reward, but it will simultaneously help curb an unnecessary loss.
Data points to consider: US existing home sales at 3pm; FOMC meeting minutes at 7pm GMT.
Areas worthy of attention:
Supports: 0.9360; 0.9163.
Resistances: 0.94 handle; 0.9444; 0.9443-0.9515.
DOW 30:
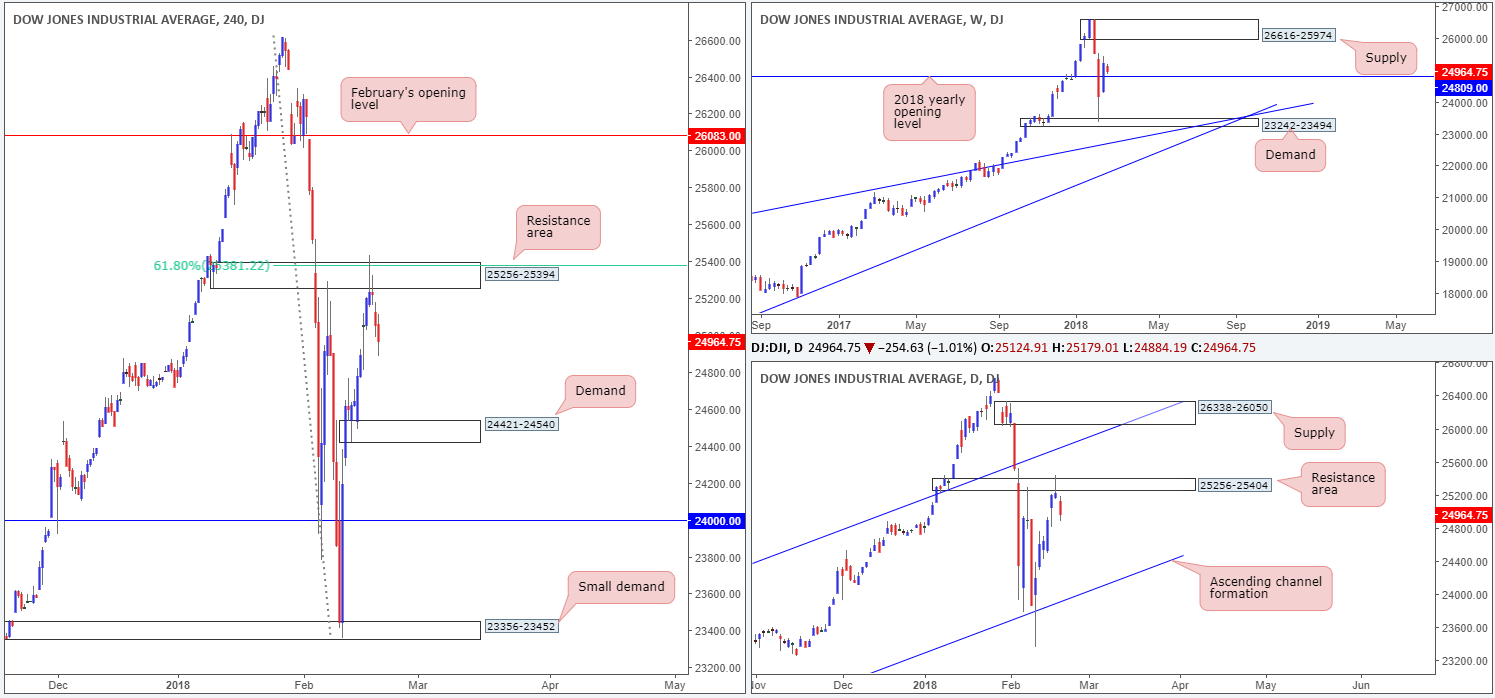
Following six days of consecutive gains, the Dow Jones Industrial Average took a step back on Tuesday, despite an advance in the technology sector.
Technically speaking, however, US equities remain on a firm footing as weekly price continues to hover above the 2018 yearly opening level positioned at 24809. Nevertheless, lower on the curve, we can see that daily price pushed lower after forming a strong-looking bearish selling wick at a daily resistance area plotted at 25256-25404 on Friday. Assuming the bears sustain this momentum, the next port of call will likely be the daily channel support extended from the low 17883. Price action could, however, be stopped in its tracks a little earlier than this, though, since the area next in line on the H4 chart stands in the form of a H4 demand base located at 24421-24540.
Potential trading zones:
It seems we have missed the boat for a short off of the H4 resistance area at 25256-25394, and taking a short based at current price would be a very risky trade given how close we are trading to the noted 2018 yearly opening level!
Therefore, for now at least, remaining on the bench until more movement is seen is likely the better path.
Data points to consider: US existing home sales at 3pm; FOMC meeting minutes at 7pm GMT.
Areas worthy of attention:
Supports: 24421-24540; 23242-23494; 24809.
Resistances: 25256-25394; 25381; 26616-25974; 25256-25404.
GOLD:
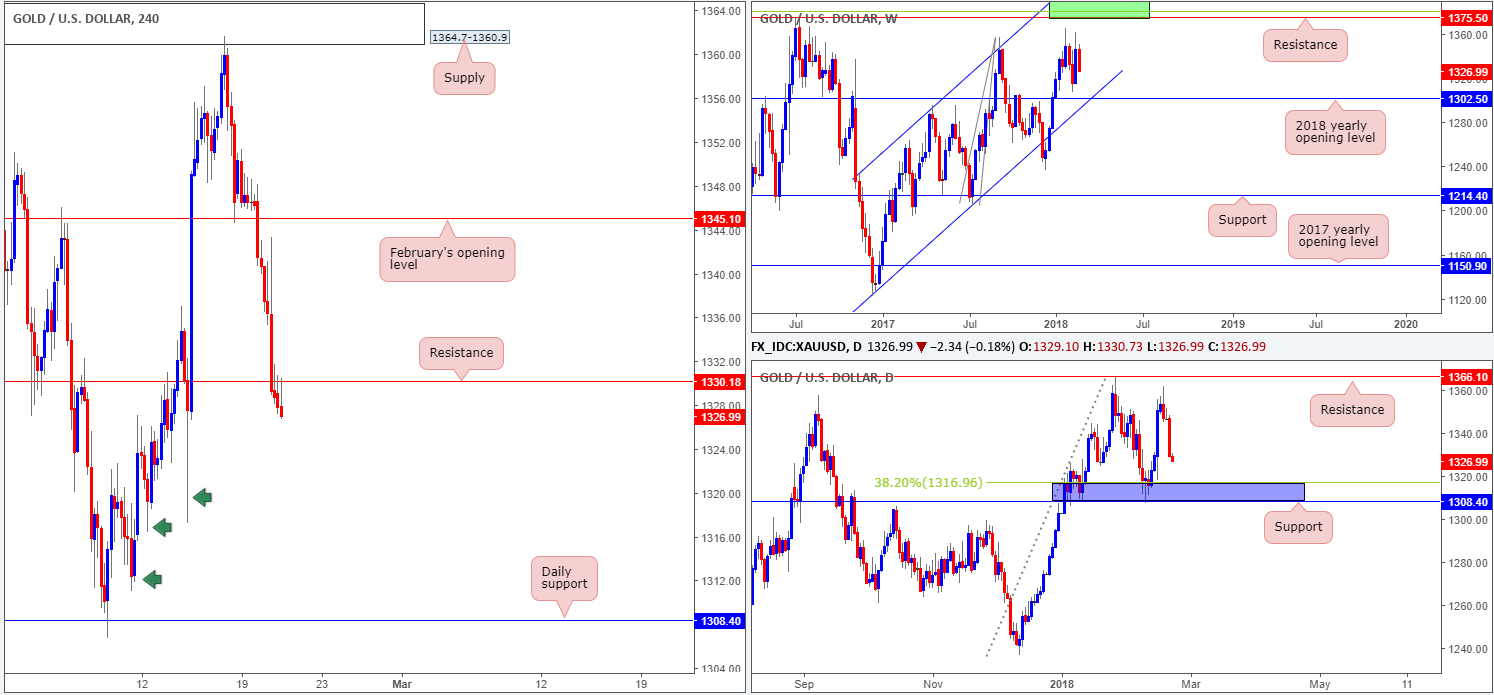
With the US dollar seen looking rather upbeat at the moment, it should, for most traders, not be a surprise to see that the yellow metal has taken a turn lower. After aggressively breaking through February’s opening band at 1345.1, the unit eventually visited the H4 support level at 1330.1 and broke lower.
With 1330.1 holding firm as resistance, we do not see a whole lot stopping the H4 candles from driving as far south as the daily support level coming in at 1308.4. The green arrows marked on the H4 chart resemble consumption tails. Our rationale behind this is simply that unfilled buy orders were triggered prior to price lifting higher; therefore when price returns to this location, downside should theoretically be reasonably free.
However, the other key thing to note here is that although H4 action shows free downside to the noted daily support, daily movement also has a 38.2% daily Fib support painted at 1316.9 (along with the daily support, forms a blue support zone), so one should expect some buying pressure to be seen around this point.
Potential trading zones:
Should the current H4 candle close on, or very near, its lows, then a short could potentially be taken on the back of this, in light of where we currently stand on the bigger picture. Technically speaking, the first take-profit area should be placed between 1308.4/1316.9 (daily support zone), followed by the 2018 yearly opening level at 1302.5 seen on the weekly timeframe.
Areas worthy of attention:
Supports: 1308.4/1316.9; 1302.5; weekly channel support.
Resistances: 1330.1.
This site has been designed for informational and educational purposes only and does not constitute an offer to sell nor a solicitation of an offer to buy any products which may be referenced upon the site. The services and information provided through this site are for personal, non-commercial, educational use and display. IC Markets does not provide personal trading advice through this site and does not represent that the products or services discussed are suitable for any trader. Traders are advised not to rely on any information contained in the site in the process of making a fully informed decision.
This site may include market analysis. All ideas, opinions, and/or forecasts, expressed or implied herein, information, charts or examples contained in the lessons, are for informational and educational purposes only and should not be construed as a recommendation to invest, trade, and/or speculate in the markets. Any trades, and/or speculations made in light of the ideas, opinions, and/or forecasts, expressed or implied herein, are committed at your own risk, financial or otherwise.
The use of the site is agreement that the site is for informational and educational purposes only and does not constitute advice in any form in the furtherance of any trade or trading decisions.
The accuracy, completeness and timeliness of the information contained on this site cannot be guaranteed. IC Markets does not warranty, guarantee or make any representations, or assume any liability with regard to financial results based on the use of the information in the site.
News, views, opinions, recommendations and other information obtained from sources outside of www.icmarkets.com.au, used in this site are believed to be reliable, but we cannot guarantee their accuracy or completeness. All such information is subject to change at any time without notice. IC Markets assumes no responsibility for the content of any linked site. The fact that such links may exist does not indicate approval or endorsement of any material contained on any linked site.
IC Markets is not liable for any harm caused by the transmission, through accessing the services or information on this site, of a computer virus, or other computer code or programming device that might be used to access, delete, damage, disable, disrupt or otherwise impede in any manner, the operation of the site or of any user’s software, hardware, data or property.


