Waiting for lower timeframe confirmation is our main tool to confirm strength within higher timeframe zones, and has really been the key to our trading success. It takes a little time to understand the subtle nuances, however, as each trade is never the same, but once you master the rhythm so to speak, you will be saved from countless unnecessary losing trades. The following is a list of what we look for:
- A break/retest of supply or demand dependent on which way you’re trading.
- A trendline break/retest.
- Buying/selling tails/wicks – essentially we look for a cluster of very obvious spikes off of lower timeframe support and resistance levels within the higher timeframe zone.
We typically search for lower-timeframe confirmation between the M15 and H1 timeframes, since most of our higher-timeframe areas begin with the H4. Stops are usually placed 1-3 pips beyond confirming structures.
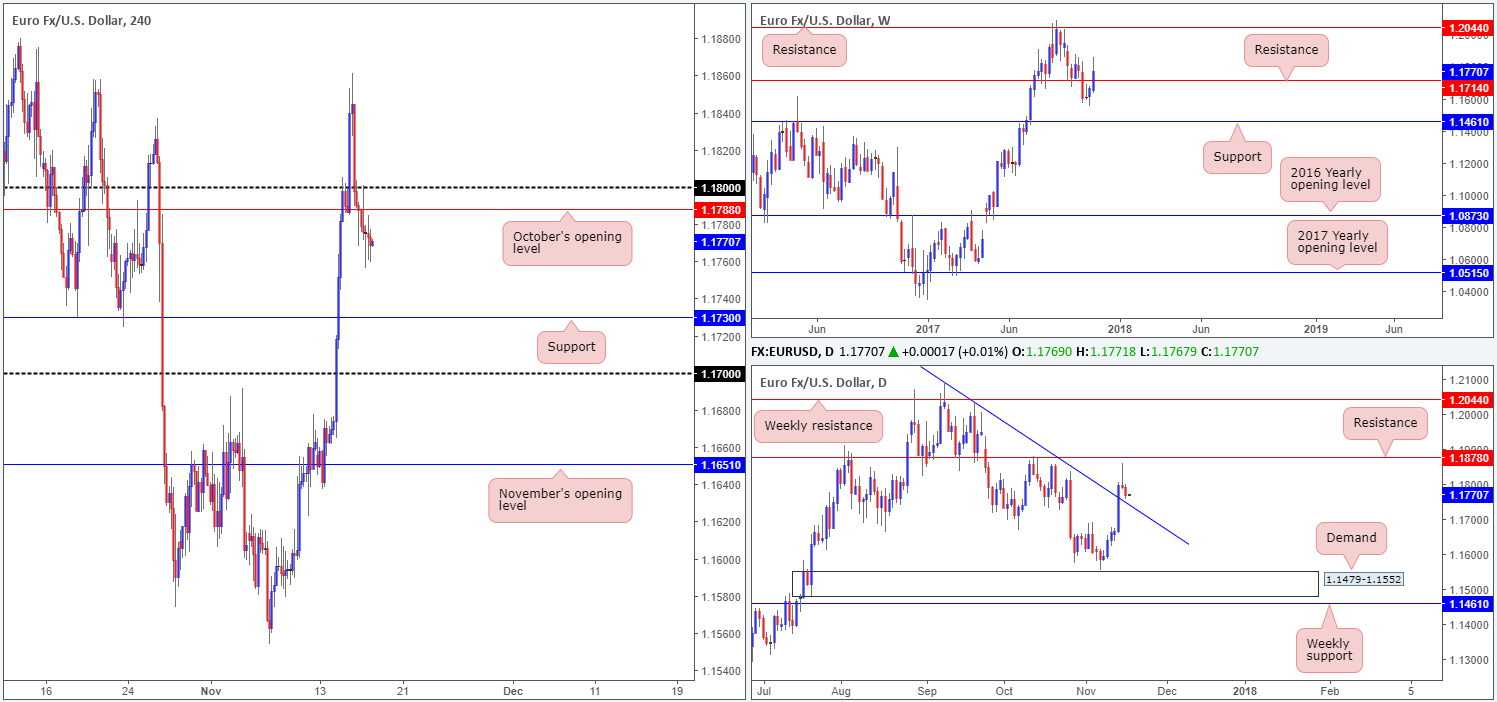
EUR/USD:
The euro is effectively unchanged this morning, consequently forcing daily price to chalk up a clear-cut indecision candle into Tuesday’s close. Given this somewhat lackluster performance, much of the following report will echo thoughts put forward during yesterday’s analysis…
As you can see on the H4 timeframe, the pair is in the process of testing the top edge of a recently broken supply at 1.1643-1.1630. This, as far as we can see, may provide a launchpad for a fresh upside assault to the 1.17 neighborhood today.
Over on the bigger picture, weekly price chewed its way through a support level at 1.1714 last week (now acting resistance), and possibly cleared the trail south for further selling down to support penciled in at 1.1461. The story on the daily timeframe, nonetheless, shows that the buyers recently made a stand ahead of a strong-looking demand area at 1.1479-1.1552, which happens to unite beautifully with a channel support etched from the low 1.1717.
Suggestions: In view of the current landscape, looking for a buy opportunity from the top edge of the recently engulfed H4 supply mentioned above at 1.1643-1.1630 is an option today.
Data points to consider: US ADP non-farm employment change at 12.15pm; US ISM manufacturing PMI at 2pm; US FOMC statement and Federal funds rate decision at 6pm GMT.
Levels to watch/live orders:
- Buys: 1.1643-1.1630 ([waiting for a reasonably sized H4 bullish candle to form – preferably a full or near-full-bodied candle – is advised] stop loss: ideally beyond the candle’s tail).
- Sells: Flat (stop loss: N/A).
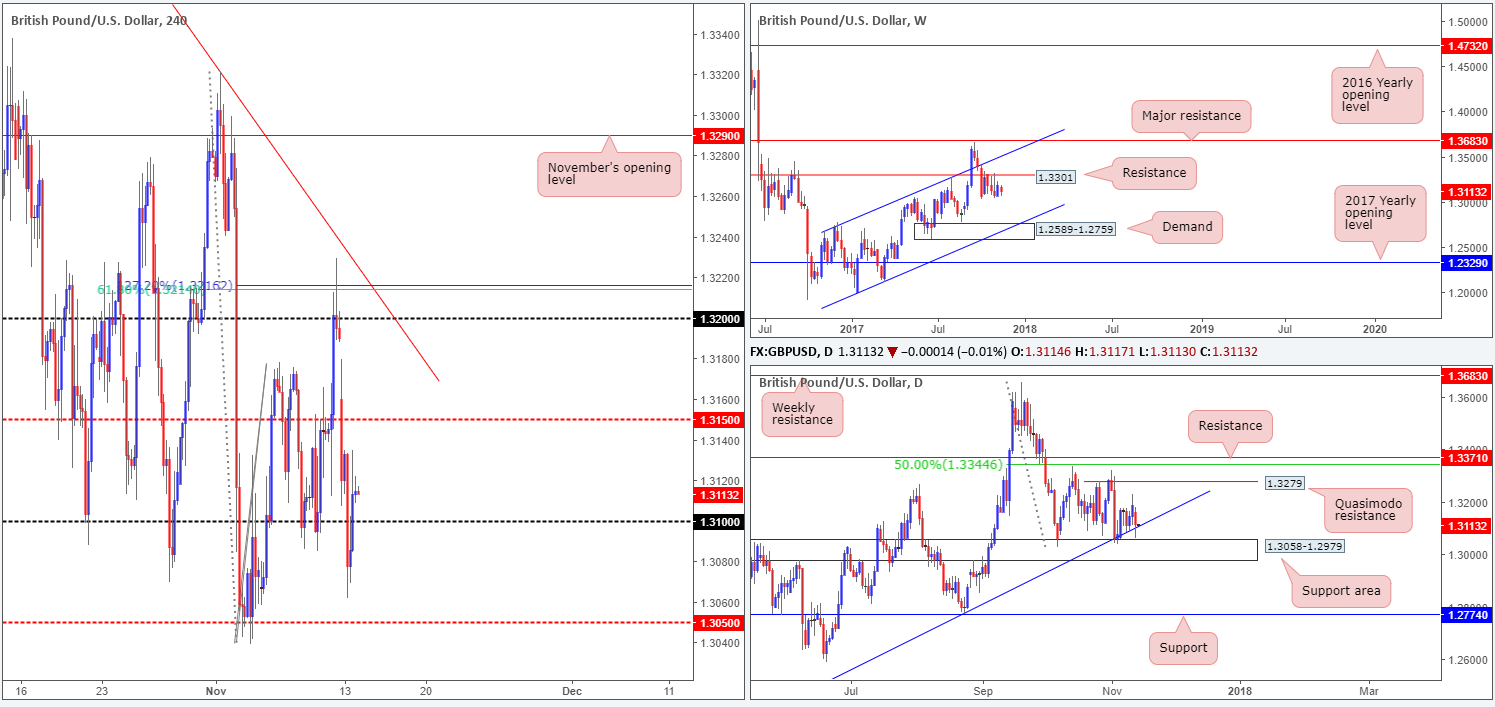
GBP/USD:
Recent action shows that the GBP/USD extended Monday’s advance from the 1.32 handle, forming an additional near-full-bodied bullish daily candle. Bolstered on the back of the BoE possibly raising interest rates this week and the dollar looking somewhat fragile around the 94.54 region, will we see the British pound continue to advance against its US counterpart?
Fundamentally, we believe the BoE will have to demonstrate a hawkish tone on Thursday to keep the pair supported. Technically, however, there may be trouble ahead. On the weekly timeframe, there’s a nearby resistance plotted at 1.3301, shadowed closely by a 50.0% daily resistance value at 1.3344 taken from the high 1.3657.
Suggestions: To confirm bullish intent we would need to see a weekly close above 1.3301. Until this day, we’ll not be looking to buy this market.
In regard to potential sells, a short from the H4 Quasimodo resistance at 1.3324 could be an option. Besides being located just above the 1.33 handle (remember psychological numbers are prone to fakeouts due to the liquidity they often carry), 1.3324 is also seen lurking between both the noted weekly and daily resistances! For that reason, a short from 1.3324 with stops tightly positioned above the apex of the H4 Quasimodo formation at 1.3340 could be something to consider today. The first area of concern, should one trade 1.3324, would likely be 1.33. We would likely look at reducing risk to breakeven here and maybe taking partial profits since the position will be trading in excess of 1R. Preferably though, a H4 close beyond 1.33 would be an ideal scenario!
Data points to consider: UK manufacturing PMI at 9.30am; US ADP non-farm employment change at 12.15pm; US ISM manufacturing PMI at 2pm; US FOMC statement and Federal funds rate decision at 6pm GMT.
Levels to watch/live orders:
- Buys: Flat (stop loss: N/A).
- Sells: 1.3324 (stop loss: 1.3340).
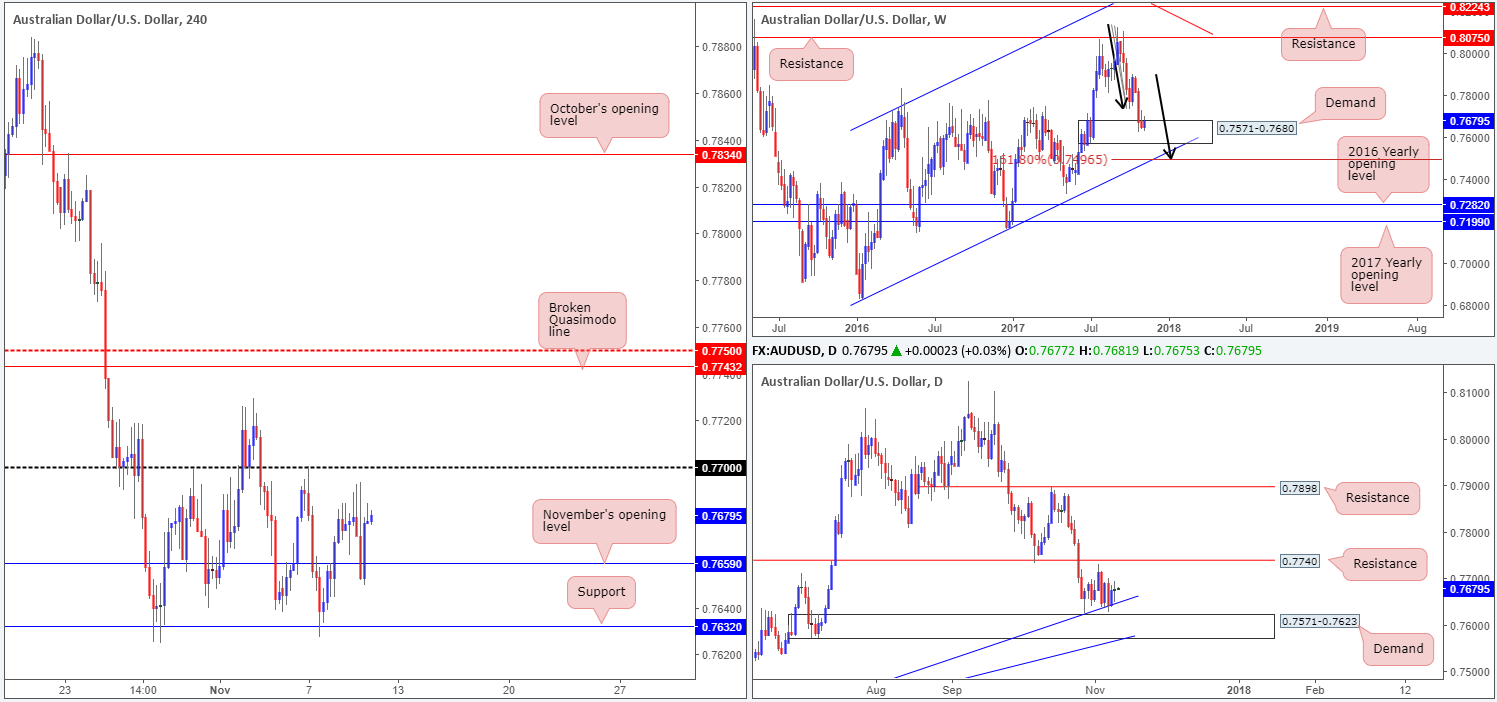
AUD/USD:
Beginning with the weekly timeframe this morning, price is seen trading beneath a trendline support taken from the high 0.7835, but remains within the walls of a demand at 0.7571-0.7680. Looking down to the daily timeframe, yesterday’s candle printed a reasonably strong-looking bearish engulfing formation just ahead of demand at 0.7571-0.7623 that merges nicely with a trendline support extended from the low 0.7328.
Across on the H4 timeframe, the 0.77 handle held firm on Tuesday and has placed the H4 sticks just ahead of support located at 0.7632. Between the 0.76 handle and this H4 support, we feel the buyers will likely look to bounce prices higher again. This is due to the noted weekly and daily demands currently in view right now.
Suggestions: As we’re currently long the DJIA taking a long on the AUD/USD is not of interest due to its correlation to the DOW. Should any of our readers be interested in a long from 0.76/0.7632, we would strongly recommend waiting for H4 buyers to prove intent before pulling the trigger. A full or near-full-bodied H4 bull candle would do nicely, and likely bring the unit back up to at least 0.77. The reason for this additional confirmation is simply because buyers may have been weakened by last Friday’s test.
Data points to consider: US ADP non-farm employment change at 12.15pm; US ISM manufacturing PMI at 2pm; US FOMC statement and Federal funds rate decision at 6pm GMT.
Levels to watch/live orders:
- Buys: 0.76/0.7632 ([waiting for a reasonably sized H4 bullish candle to form – preferably a full or near-full-bodied candle – is advised] stop loss: ideally beyond the candle’s tail).
- Sells: Flat (stop loss: N/A).
USD/JPY:
The 113 handle, as you can see, did a good job of holding back the sellers on Tuesday. Going into the early hours of yesterday’s London segment, the bulls lifted the USD/JPY higher from here. US traders followed suit which saw the unit claw back most of yesterday’s losses.
Ultimately though, we were not expecting an upside move as there is a strong-looking weekly supply currently in play at 115.50-113.85. In addition to this, the supply area has held price lower on two separate occasions so far this year. Therefore, there’s a chance that we may see history repeat itself.
Suggestions: According to the technicals, the next upside target on the H4 scale can be seen at the 114 handle, followed closely by a Quasimodo resistance at 114.24. Considering the location of price on the weekly timeframe, both levels could hold the pair lower today. With that being said, however, we would personally favor the Quasimodo for shorts, since round numbers tend to be a magnet for fakeouts.
Apart from the H4 structures, the next area of interest to the upside is seen on the daily timeframe at 114.95. This level is placed beautifully around the upper limits of the noted weekly supply, thus allowing traders to sell a daily level but use a weekly area for stop placement.
Data points to consider: US ADP non-farm employment change at 12.15pm; US ISM manufacturing PMI at 2pm; US FOMC statement and Federal funds rate decision at 6pm GMT.
Levels to watch/live orders:
- Buys: Flat (stop loss: N/A).
- Sells: 114/114.24 are levels that could halt buying today (stop loss for a short at 114.24: 114.47). 114.95 region (stop loss: above weekly supply at 115.52).
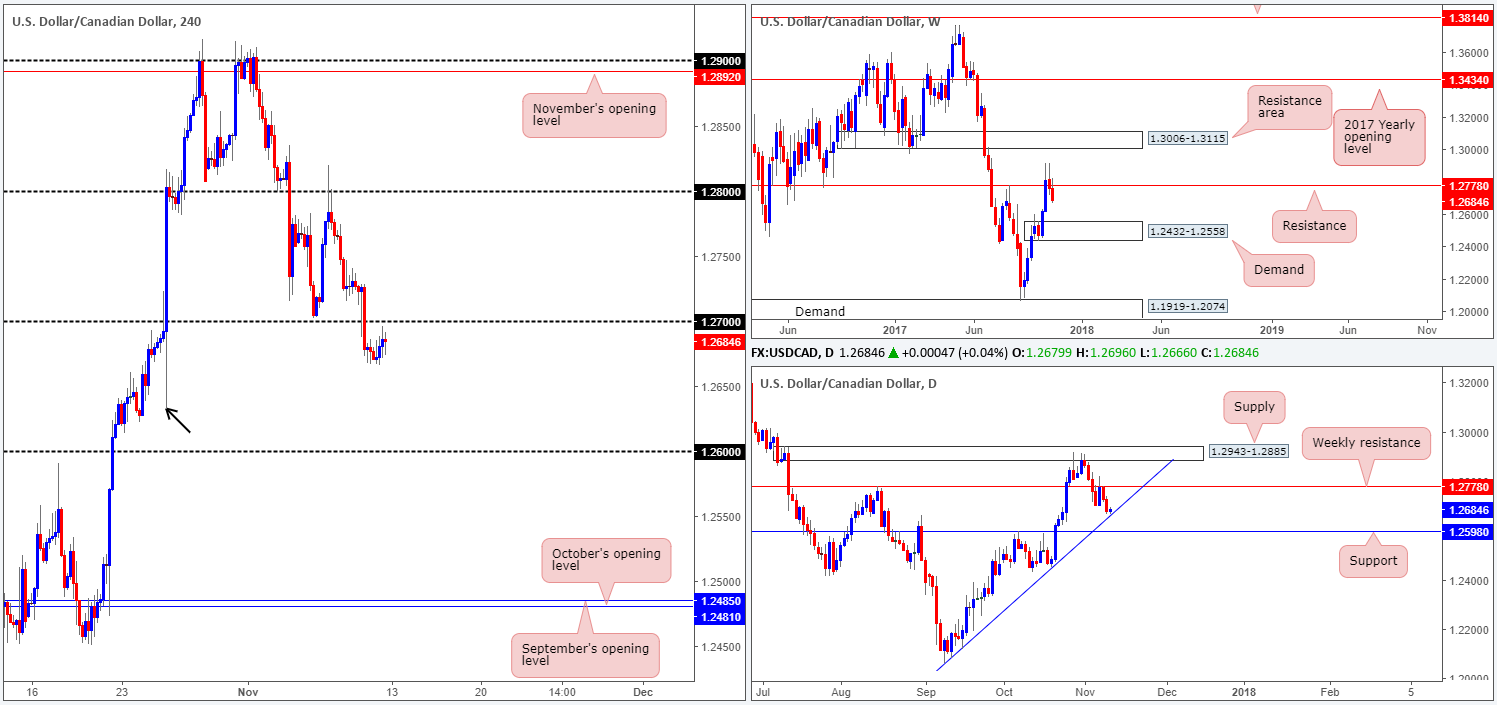
USD/CAD:
Following Tuesday’s disappointing Canadian GDP report, the USD/CAD headed northbound and pierced through the 1.29 handle. Buyers, as you can see, failed to sustain gains beyond this number and spent the remainder of the day beneath 1.29.
1.29 is likely to give way today due to what the higher-timeframe structures are showing. Over the course of last week’s trading, the USD/CAD forced itself above a weekly supply zone at 1.2778-1.2653, potentially opening up the path north to a weekly resistance area at 1.3006-1.3115. Before weekly buyers can lift price higher though, the daily supply at 1.2943-1.2885 will need to be consumed. With that being said, however, Friday’s selling wick seen printed from this zone has so far generated little follow through, indicating possible susceptibility to a break higher.
Suggestions: On account of the above notes, the team is watching for 1.29 to be engulfed. This – followed up with a retest and a H4 bullish candle (preferably a full or near-full bodied candle) would, in our view, be enough to warrant a long, targeting the large psychological hurdle 1.30 (also represents the underside of the aforementioned weekly resistance area).
Data points to consider: US ADP non-farm employment change at 12.15pm; US ISM manufacturing PMI at 2pm; US FOMC statement and Federal funds rate decision at 6pm; Crude oil inventories at 2.30pm; BoC Gov. Poloz speaks at 8.15pm GMT.
Levels to watch/live orders:
- Buys: Watch for H4 price to engulf 1.29 and then look to trade any retest seen thereafter ([waiting for a reasonably sized H4 bullish candle to form following the retest – preferably a full or near-full-bodied candle – is advised] stop loss: ideally beyond the candle’s tail).
- Sells: Flat (stop loss: N/A).
USD/CHF:
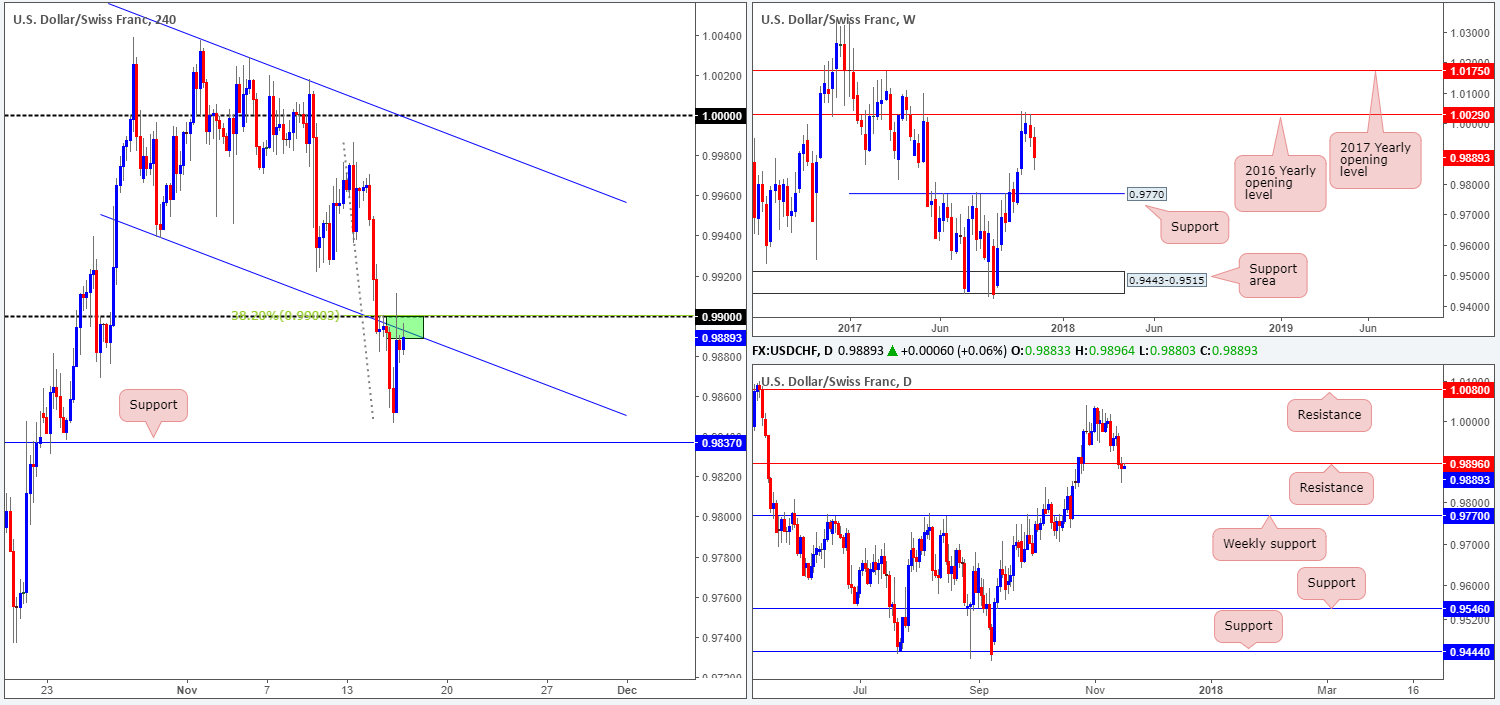
In recent sessions, the USD/CHF extended Monday’s bounce from H4 support at 0.9940. Momentum diminished, however, as price neared the critical parity level (1.0000). Despite this recent upside move, the pair is still seen firmly capped beneath the 2016 yearly opening level on the weekly timeframe at 1.0029. Similarly, sellers around parity won’t likely go down without a fight! The only chart indicating further upside could be on the cards is the daily timeframe, as the next upside target does not come into view until 1.0080.
Suggestions: With H4 price now seen within striking distance of parity and the 2016 yearly opening level, the team is looking for shorting opportunities. And yes, we know this goes against the daily timeframe’s expectations. To help avoid an unnecessary loss here, a sell order will not be initiated UNTIL we have seen H4 price chalk up a reasonably sized bearish candle from 1.0029/1.0000, preferably in the form of a full or near-full-bodied candle.
Data points to consider: US ADP non-farm employment change at 12.15pm; US ISM manufacturing PMI at 2pm; US FOMC statement and Federal funds rate decision at 6pm; CHF Gov. Board member Zurbrugg speaks at 5.15pm GMT.
Levels to watch/live orders:
- Buys: Flat (stop loss: N/A).
- Sells: 1.0029/1.0000 region ([waiting for a reasonably sized H4 bearish candle to form – preferably a full or near-full-bodied candle – is advised] stop loss: ideally beyond the candle’s wick).
DOW 30:
During the course of Tuesday’s sessions, US equities turned higher, consequently clawing back some of Monday’s losses. For those who read our previous reports you may recall that our desk recently entered long at 23356, with stops positioned below the H4 support area (23261-23297) at 23240. The long was based on price responding to the H4 support area and forming a nice-looking near-full-bodied H4 bullish candle.
Suggestions: In light of yesterday’s advance, our position is now sitting in the green. What we’re looking for from here is a push up to fresh highs, hopefully completing a potential AB=CD H4 formation seen marked with black arrows. This will be our cue to reduce risk to breakeven and begin thinking about taking some profits off the table.
Data points to consider: US ADP non-farm employment change at 12.15pm; US ISM manufacturing PMI at 2pm; US FOMC statement and Federal funds rate decision at 6pm GMT.
Levels to watch/live orders:
- Buys: 23356 ([live] stop loss: 23240).
- Sells: Flat (stop loss: N/A).
GOLD:
Breaking a two-day bullish phase, the yellow metal tumbled lower on Tuesday. Engulfing all of Monday’s gains and some of Fridays, the H4 sticks are now seen trading back around August’s opening level at 1269.3. Directly below this angle, as you can probably see, is a H4 Quasimodo support at 1265.9. What’s more, on the weekly timeframe, we can see that a demand base at 1251.7-1269.3, which happens to merge with a channel support etched from the low 1122.8, remains in play. Additionally, supporting the aforementioned weekly demand is a daily demand seen housed within the lower limits of the weekly zone at 1251.7-1265.2.
Suggestions: Although the yellow metal is seen mildly paring losses around August’s opening level mentioned above at 1269.3, H4 price is likely to drive lower to reconnect with the noted H4 Quasimodo support. The reason behind this is simply due to weak bids residing around this area given the H4 tails seen piercing through the monthly open level.
We would consider a buy from 1265.9 if H4 price closed back above 1269.3 and retested the line as support.
Levels to watch/live orders:
- Buys: Watch for H4 price to test 1265.9 and engulf 1269.3 and then look to trade any retest seen thereafter ([waiting for a reasonably sized H4 bullish candle to form following the retest – preferably a full or near-full-bodied candle – is advised] stop loss: ideally beyond the candle’s tail).
- Sells: Flat (stop loss: N/A).


