Waiting for lower timeframe confirmation is our main tool to confirm strength within higher timeframe zones, and has really been the key to our trading success. It takes a little time to understand the subtle nuances, however, as each trade is never the same, but once you master the rhythm so to speak, you will be saved from countless unnecessary losing trades. The following is a list of what we look for:
- A break/retest of supply or demand dependent on which way you’re trading.
- A trendline break/retest.
- Buying/selling tails/wicks – essentially we look for a cluster of very obvious spikes off of lower timeframe support and resistance levels within the higher timeframe zone.
We typically search for lower-timeframe confirmation between the M15 and H1 timeframes, since most of our higher-timeframe areas begin with the H4. Stops are usually placed 1-3 pips beyond confirming structures.
EUR/USD:
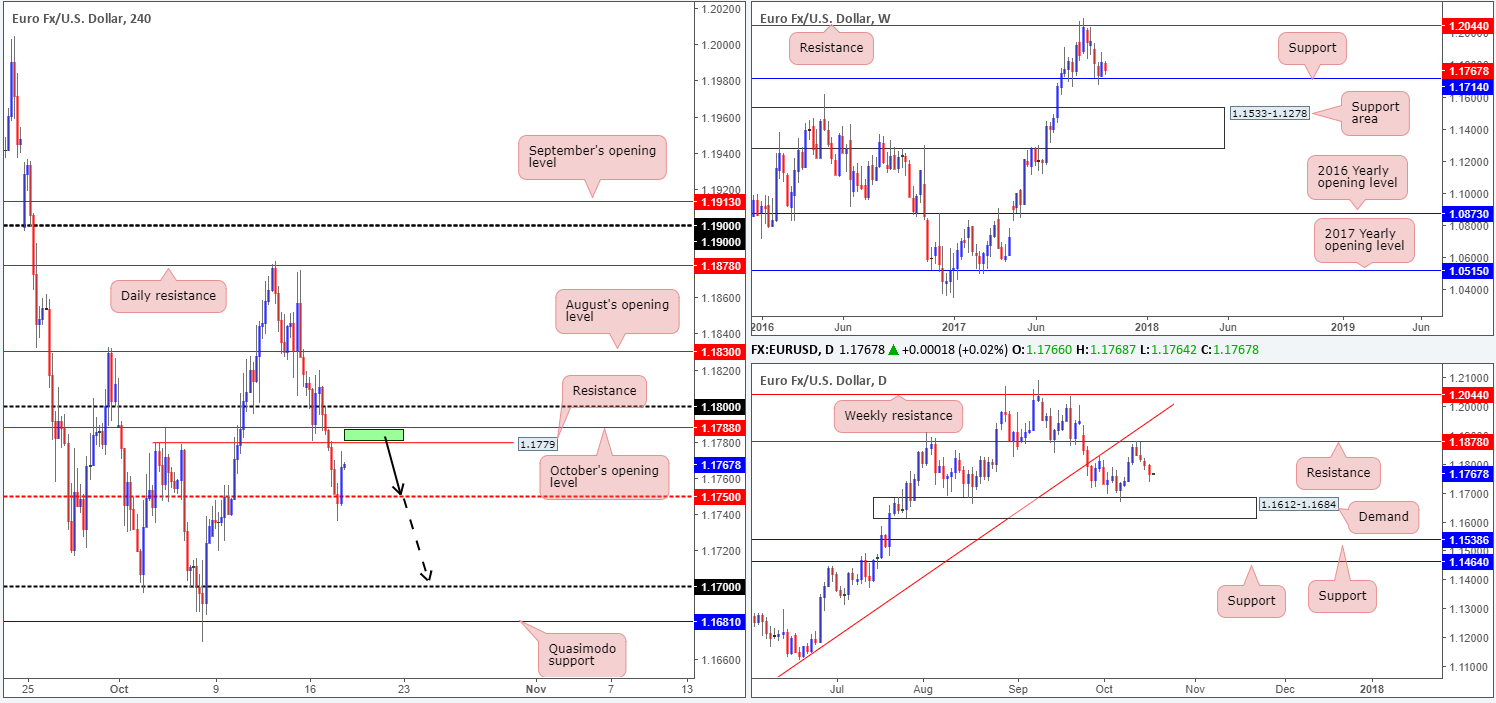
The single currency continued to deteriorate on Tuesday, marking its fourth consecutive daily loss.
Despite this, weekly price remains reinforced by support pegged at 1.1714. Daily flow on the other hand, shows room to continue pressing down to at least demand printed at 1.1612-1.1684.
Across the pond on the H4 timeframe, the mid-level support 1.1750 suffered a breach amid the early hours of US trading, but managed to recover relatively quickly. As can be seen from the chart, the unit concluded the day closing just ahead of resistance at 1.1779/October’s opening level at 1.1788 (green zone).
Suggestions: Given the room seen for daily price to probe lower, the green zone marked on the H4 timeframe is, in our view, worthy of consideration for potential shorts, targeting 1.1750/1.17. However, since the 1.18 handle is lurking directly above this zone, this will likely act as a magnet to price and cause a fakeout. For that reason, waiting for additional confirmation here is advised before pulling the trigger!
Data points to consider: ECB President Draghi speaks at 9.10am; FOMC members Dudley and Kaplan speak at 1pm; US Housing figures at 1.30pm GMT+1.
Levels to watch/live orders:
- Buys: Flat (stop loss: N/A).
- Sells: 1.1788/1.1779 ([waiting for a lower-timeframe sell signal to form [see the top of this report] is advised] stop loss: dependent on where one confirms the area).
GBP/USD:
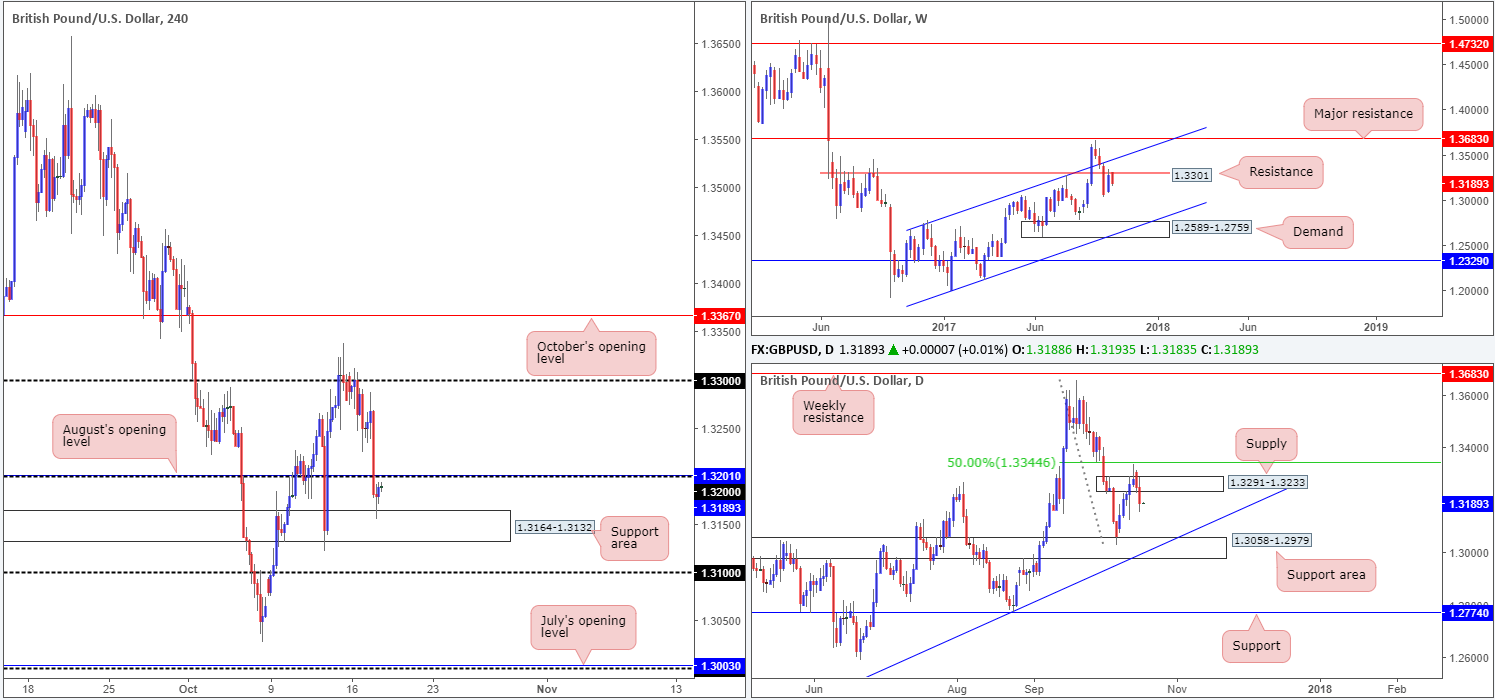
The British pound fell sharply on Tuesday, shattering the 1.32 handle and challenging a nearby H4 support area coming in at 1.3164-1.3132. Fundamentally, we believe the move was influenced by less-than-stellar UK inflation figures and comments from various MPC members, including BoE Gov. Carney, before the Treasury Select Committee.
Technically though, the move was expected. Besides weekly price kissing the underside of a resistance level at 1.3301 and daily price trading from within the boundaries of supply at 1.3291-1.3233, there was room for the H4 candles to probe lower.
Suggestions: Having seen the bullish response from the aforesaid H4 support area, price is likely to touch gloves with 1.32 in the next hour or so. With both weekly and daily charts still showing further downside could be upon us – the closest target can be seen on the daily timeframe at 1.3058-1.2979 – price is unlikely to breach 1.32. In spite of this, a sell from here is difficult due to how close the current H4 support area is located. This is only true though if you are unable to pin down a tight enough setup to accommodate reasonable risk/reward.
Data points to consider: UK inflation figures at 9.30am; FOMC members Dudley and Kaplan speak at 1pm; US Housing figures at 1.30pm GMT+1.
Levels to watch/live orders:
- Buys: Flat (stop loss: N/A).
- Sells: 1.32 region ([waiting for a lower-timeframe sell signal to form [see the top of this report] is advised] stop loss: dependent on where one confirms the area).
AUD/USD:
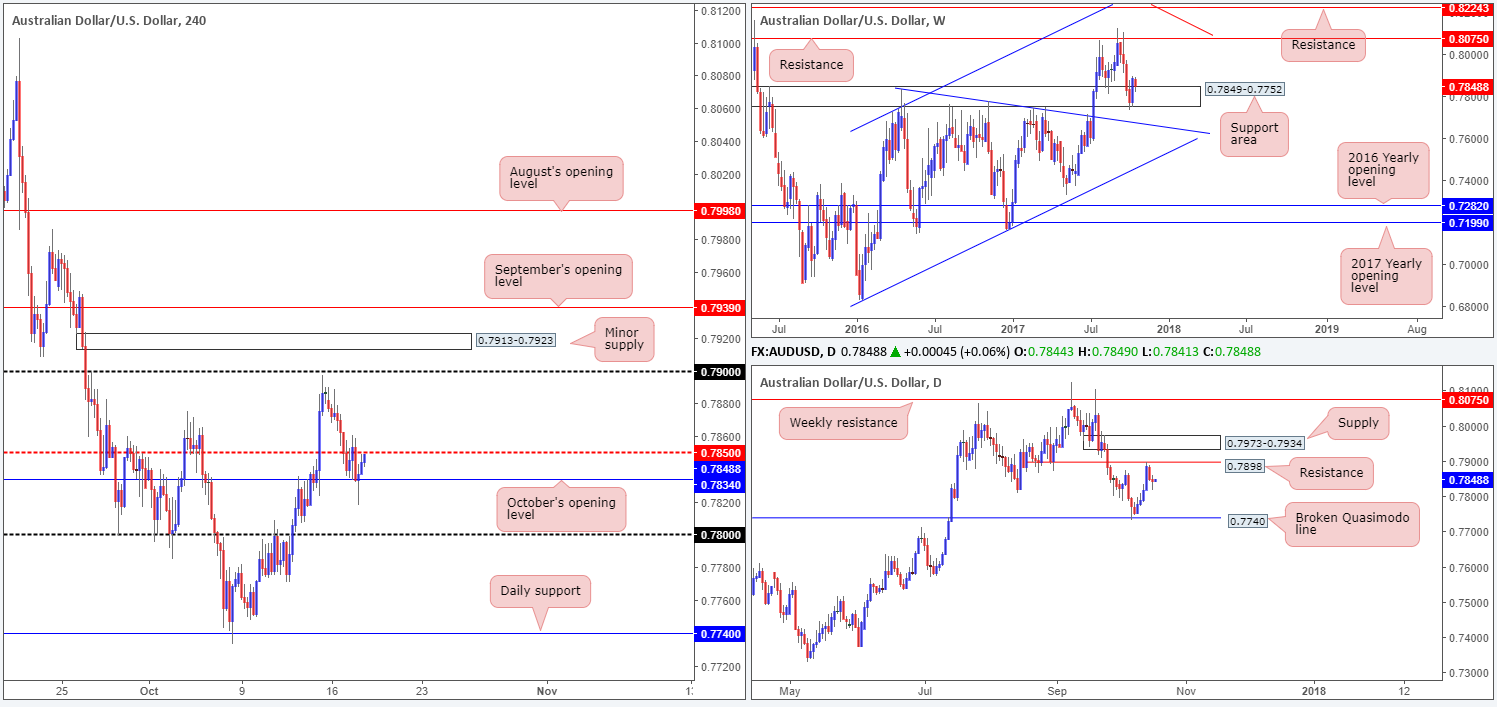
The AUD/USD is effectively unchanged this morning, with October’s opening level at 0.7834 and the H4 mid-level resistance 0.7850 currently housing H4 price. The rather large H4 tail printed during the early hours of US trade likely ripped through a truckload of stop-loss orders sub 0.7834, and therefore potentially cleared the path down to the 0.78 neighborhood. A move back above 0.7850 on the other hand, is also a possibility and could pull the commodity currency back up to the 0.79 handle.
Over on the bigger picture, the daily candles continue to reflect a bearish tone after crossing swords with resistance at 0.7898. Weekly action, however, remains trading from a support area penciled in at 0.7849-0.7752, which boasts strong historical significance.
Suggestions: Although there’s a clear conflict of opinion seen between the weekly and daily structures at the moment, this is still a tradable market, in our humble opinion.
A decisive push above 0.7850, followed up with a retest and a lower-timeframe buy signal (see the top of this report) would be enough to validate an intraday long back up to 0.79. A sell below October’s opening level, however, is a little trickier, considering how close 0.78 is positioned. Unless you’re able to pin down a setup that requires 15 pips or less, the 30-pip move may not be worth the risk.
Data points to consider: FOMC members Dudley and Kaplan speak at 1pm; US Housing figures at 1.30pm GMT+1.
Levels to watch/live orders:
- Buys: Watch for H4 price to engulf 0.7850 and then look to trade any retest seen thereafter ([waiting for a lower-timeframe buy signal to form following the retest is advised] stop loss: dependent on where one confirms the level).
- Sells: Flat (stop loss: N/A).
USD/JPY:
H4 price action, as you can see, is somewhat cramped at the moment. To the upside, we have mid-level resistance 112.50, shadowed closely by October’s opening level at 112.64. Downstairs, however, there’s July’s opening level at 112.09, followed closely by the 112 handle.
Across on the weekly timeframe, the candles are seen stalling ahead of supply coming in at 115.50-113.85. The daily timeframe, nevertheless, shows room to extend as far north as the trendline resistance extended from the high 115.50, which happens to intersect beautifully with the noted weekly supply.
Suggestions: This is not a market we feel is tradable at the moment. H4 action is just too restricted for any meaningful move to take place.
Data points to consider: FOMC members Dudley and Kaplan speak at 1pm; US Housing figures at 1.30pm GMT+1.
Levels to watch/live orders:
- Buys: Flat (stop loss: N/A).
- Sells: Flat (stop loss: N/A).
USD/CAD:
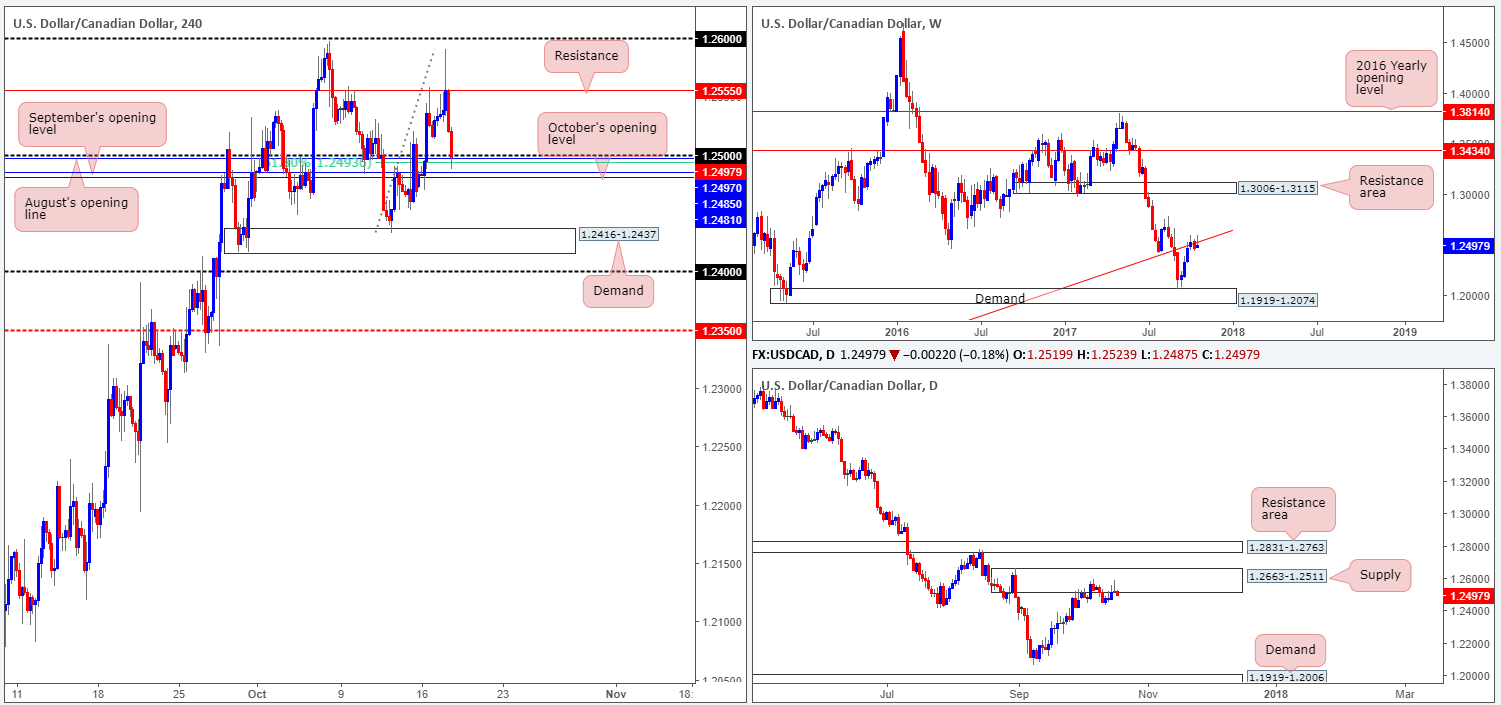
The majority of Tuesday’s US segment was controlled by selling, following an aggressive whipsaw through H4 resistance found at 1.2555. The move, as you can see, brought the unit down to the 1.25 handle and its surrounding supports (three monthly opening levels [Aug, Sept and Oct] seen between 1.2481/1.2497 and a 61.8% Fib support at 1.2493 extended from the low 1.2432). While this zone is an incredibly tempting buy, it could just as easily be wiped out. Our reasoning lies within the higher-timeframe structures along with the overall downtrend this market is currently in.
On the weekly timeframe, we can see that the buyers and sellers are currently battling for position around the underside of a trendline resistance extended from the low 0.9633. In conjunction with the weekly timeframe, the daily timeframe shows that the candles remain fixed at supply drawn from 1.2663-1.2511.
Suggestions: In view of the H4 confluence in play right now, a bounce from 1.2481/1.25 is highly likely. As we have already pointed out though, it does not come without risk. As a result, it is down to the trader to decide whether or not his/her plan agrees with the H4 supports.
Data points to consider: FOMC members Dudley and Kaplan speak at 1pm; US Housing figures at 1.30pm; CAD Manufacturing sales m/m at 1.30pm; US Crude oil inventories at 3.30pm GMT+1.
Levels to watch/live orders:
- Buys: Possible buy from the 1.25 region (stop loss: below 1.2481)
- Sells: Flat (stop loss: N/A).
USD/CHF:
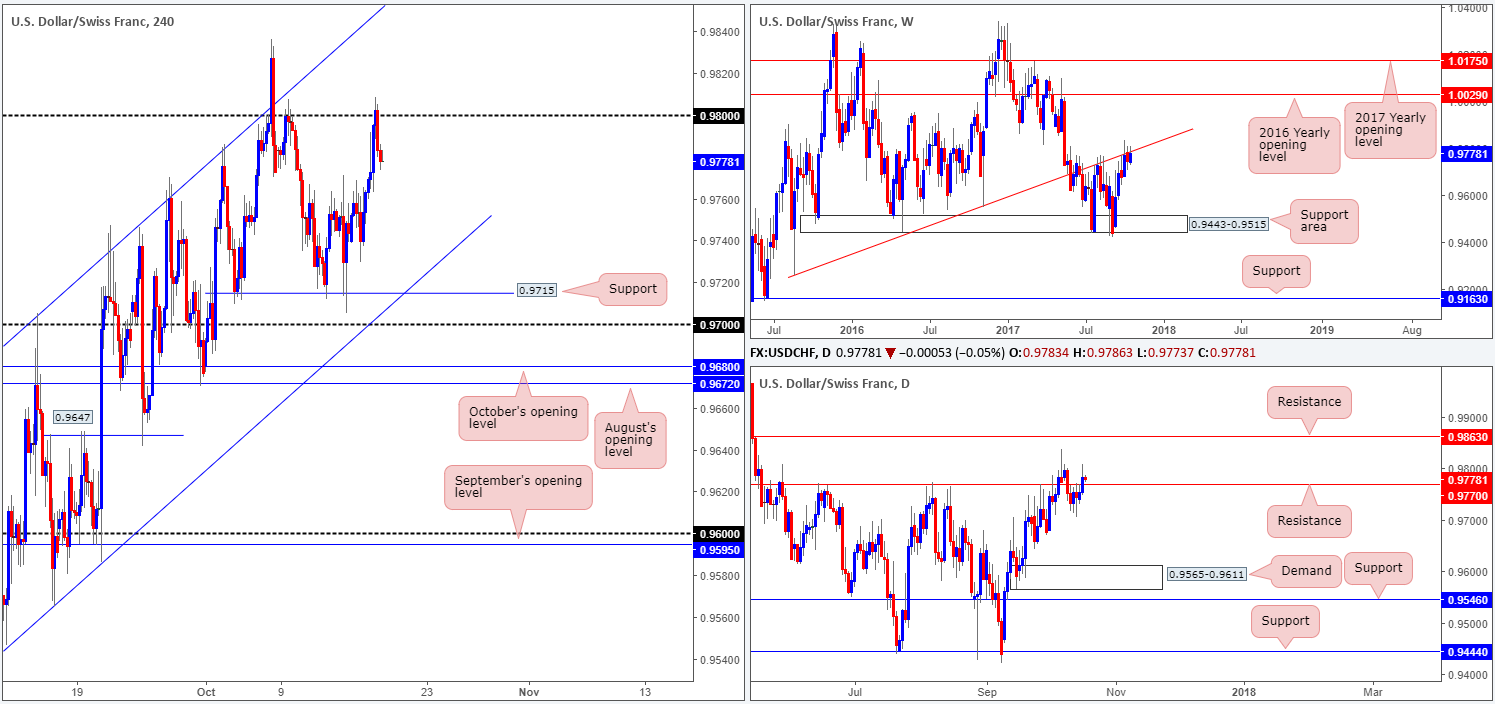
During the course of yesterday’s sessions, daily movement crossed back above resistance at 0.9770. This, to a lot of traders, will likely be considered a bullish pointer. Nevertheless, there may be trouble ahead! Looking up to the weekly timeframe, we can see that the buyers and sellers are currently fighting for position around the underside of a trendline resistance carved from the low 0.9257.
Over on the H4 timeframe, the 0.98 handle, regardless of the marginal breach amid the early hours of US trading, did a good job of holding firm into the closing bell. From this angle, we see little preventing the candles from extending lower down to support coming in at 0.9715. That is, of course, unless the recently engulfed daily resistance becomes support!
Suggestions: As of current price, there are no immediate setups to take advantage of, as far as we can see. Should price retest 0.98 for a second time today, however, we might, dependent on the time of day, consider a short from here.
Data points to consider: FOMC members Dudley and Kaplan speak at 1pm; US Housing figures at 1.30pm GMT+1.
Levels to watch/live orders:
- Buys: Flat (stop loss: N/A).
- Sells: 0.98 region ([waiting for a reasonably sized H4 bearish candle to form – preferably a full, or near-full-bodied candle – is advised] stop loss: ideally beyond the candle’s wick).
DOW 30:
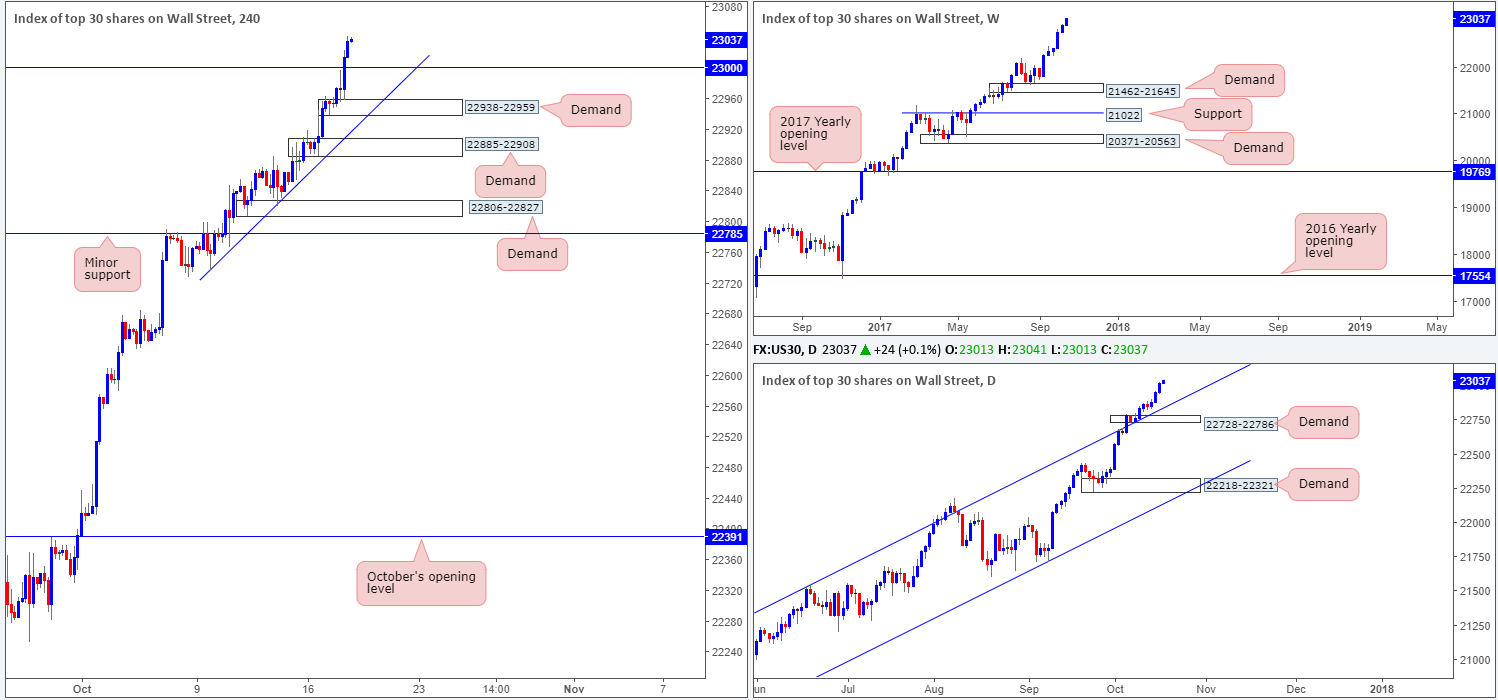
Wall Street ended Tuesday’s segment recording further gains and punching above the 23000 landmark. Registering a fresh record high of 23023, the index will likely remain buoyant above 23000 today. Be that as it may, it might be worth noting that should traders with deep pockets wish to take stops lurking beneath this line, then a fakeout down to the H4 demand area at 22938-22959 (converges with a H4 trendline support extended from the low 22736) could help facilitate this.
Suggestions: 23000 will likely hold firm today given the majority of the market is likely looking to fade a retest of this number. With that being the case, we’re going to be keeping an eye on both the 23000 mark for potential longs and also the nearby H4 demand area mentioned above at 22938-22959. Both carry equal weight, in our opinion.
Data points to consider: FOMC members Dudley and Kaplan speak at 1pm; US Housing figures at 1.30pm GMT+1.
Levels to watch/live orders:
- Buys: 22300 region ([waiting for a reasonably sized H4 bullish candle to form – preferably a full, or near-full-bodied candle – is advised] stop loss: ideally beyond the candle’s tail) 22938-22959 ([waiting for a reasonably sized H4 bullish candle to form – preferably a full, or near-full-bodied candle – is advised] stop loss: ideally beyond the candle’s tail).
- Sells: Flat (stop loss: N/A).
GOLD:
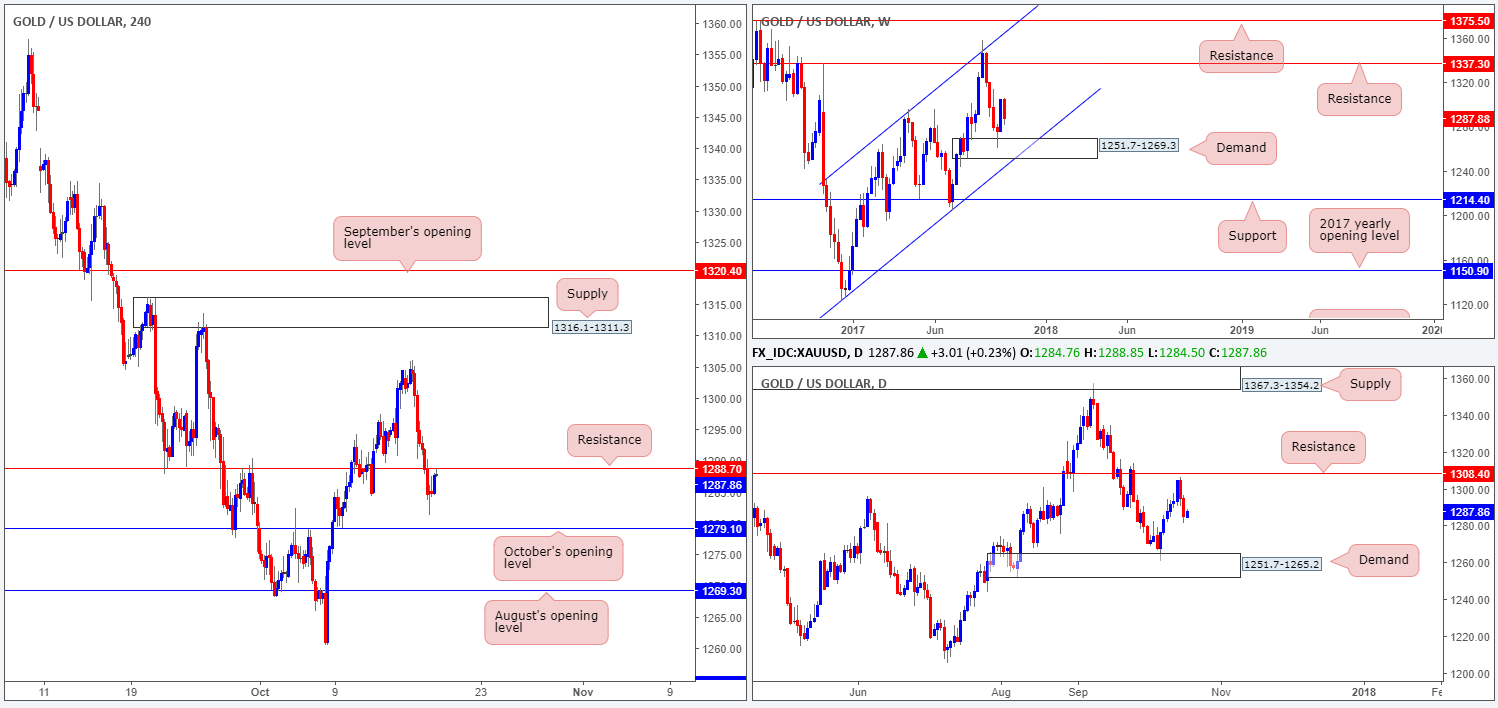
The yellow metal pressed lower for a second consecutive sitting on Tuesday, along with the dollar climbing higher. The move, as you can see on the H4 chart, forced the candles beneath support at 1288.7 to a low of 1281.2 – a few pips shy of October’s opening level at 1279.1. With the unit seen mildly paring losses into the close, gold is now flirting with the recently engulfed support-turned resistance at 1288.7. This level – coupled with daily price showing room for further downside to demand plotted at 1251.7-1265.2 – offers one a potential shorting opportunity. The only drawback is that over the past couple of weeks, gold has been strongly bid from weekly demand coming in at 1251.7-1269.3.
Suggestions: Assuming our higher timeframe analysis is accurate, selling remains the order of the day. Should the current H4 candle close bearishly from the noted resistance, a short on the close is certainly an option. As we highlighted in Tuesday’s report though, this does not leave much room for price to stretch its legs before hitting October’s opening level mentioned at 1279.1.
In the event that a trade does come to fruition, we would be looking to reduce risk to breakeven at October’s open level. Yes, this may be a little too close for comfort for some people, but the last thing we would want to do is trade short, see the market move in favor and then take a loss!
Levels to watch/live orders:
- Buys: Flat (stop loss: N/A).
- Sells: 1288.7 region ([waiting for a lower-timeframe sell signal to form [see the top of this report] is advised to secure a tight entry] stop loss: dependent on where one confirms the level).


