A note on lower timeframe confirming price action…
Waiting for lower timeframe confirmation is our main tool to confirm strength within higher timeframe zones, andhas really been the key to our trading success. It takes a little time to understand the subtle nuances, however, as each trade is never the same, but once you master the rhythm so to speak, you will be saved from countless unnecessary losing trades. The following is a list of what we look for:
- A break/retest of supply or demand dependent on which way you’re trading.
- A trendline break/retest.
- Buying/selling tails – essentially we look for a cluster of very obvious spikes off of lower timeframe support and resistance levels within the higher timeframe zone.
- Candlestick patterns. We tend to only stick with pin bars and engulfing bars as these have proven to be the most effective.
For us, lower timeframe confirmation starts on the M15 and finishes up on the H1, since most of our higher timeframe areas begin with the H4.
EUR/USD:
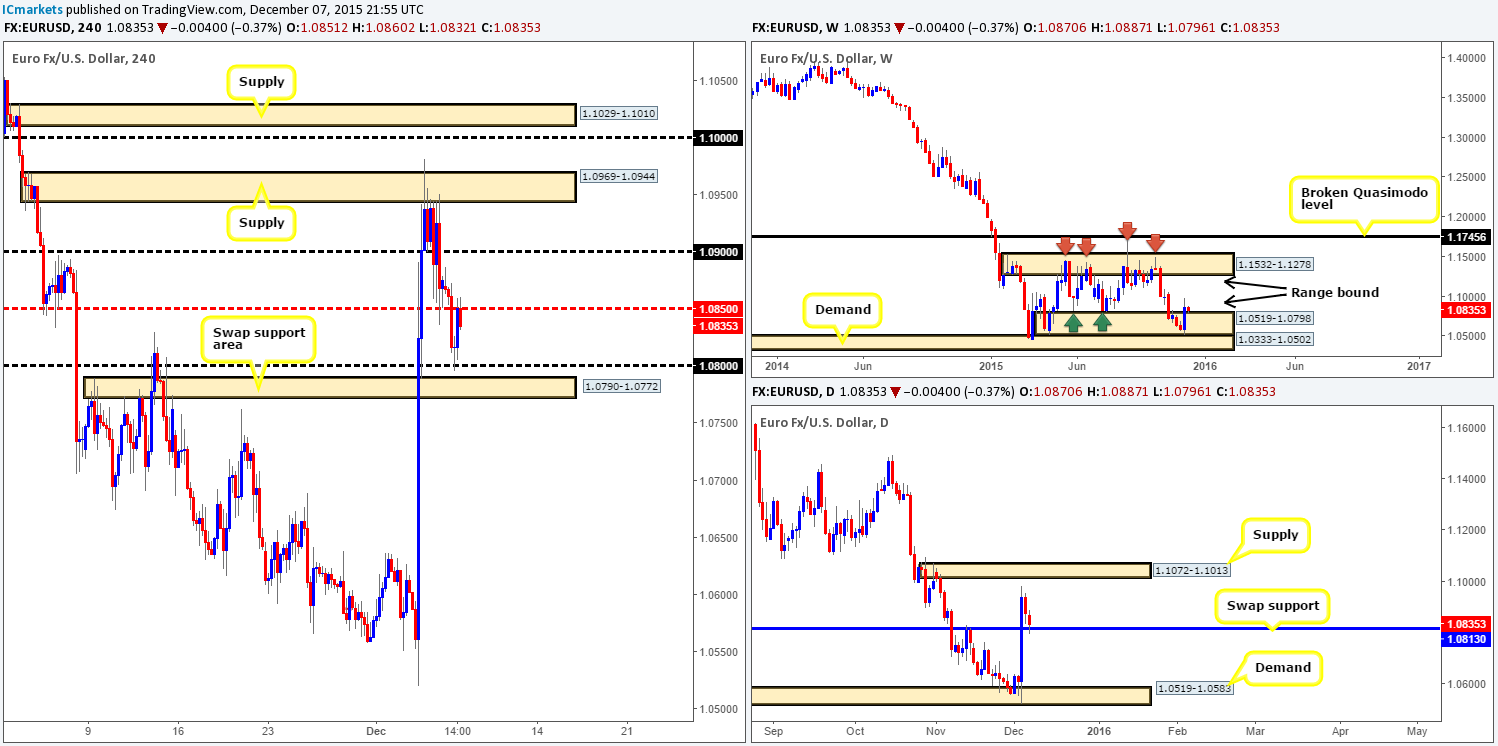
As can be seen from the H4 chart, the EUR continued to sell-off in the early hours of yesterday’s trade. This resulted in price driving into psychological support 1.0800, and rebounding to connect with offers around mid-level resistance 1.0850 by the day’s end.
In the event that 1.0850 holds firm today and the sellers continue pushing this market lower, we’ll be looking for price to fake below 1.0800 into the swap support area below it at 1.0790-1.0772, before considering a buy in this market (confirmation required). Why we need confirmation here when this region is supported by not only a weekly range demand at 1.0519-1.0798, but also a daily swap (support) level at 1.0813 simply comes from price having just come off a steep six-week move to the downside.
Should 1.0850 give way, however, we’ll then (knowing we will be trading in-line with higher timeframe structure – see above) look to trade any confirmed retest seen at this level, targeting psychological resistance 1.0900 first and foremost. Waiting for the lower timeframes to confirm the retest here helps to avoid any fakeouts that may occur.
Levels to watch/live orders:
- Buys:1.0790-1.0772 [Tentative – confirmation required] (Stop loss: dependent on where one confirms this area). Watch for offers to be consumed around 1.0850 and then look to trade any retest seen at this number (confirmation required).
- Sells: Flat (Stop loss: N/A).
GBP/USD:
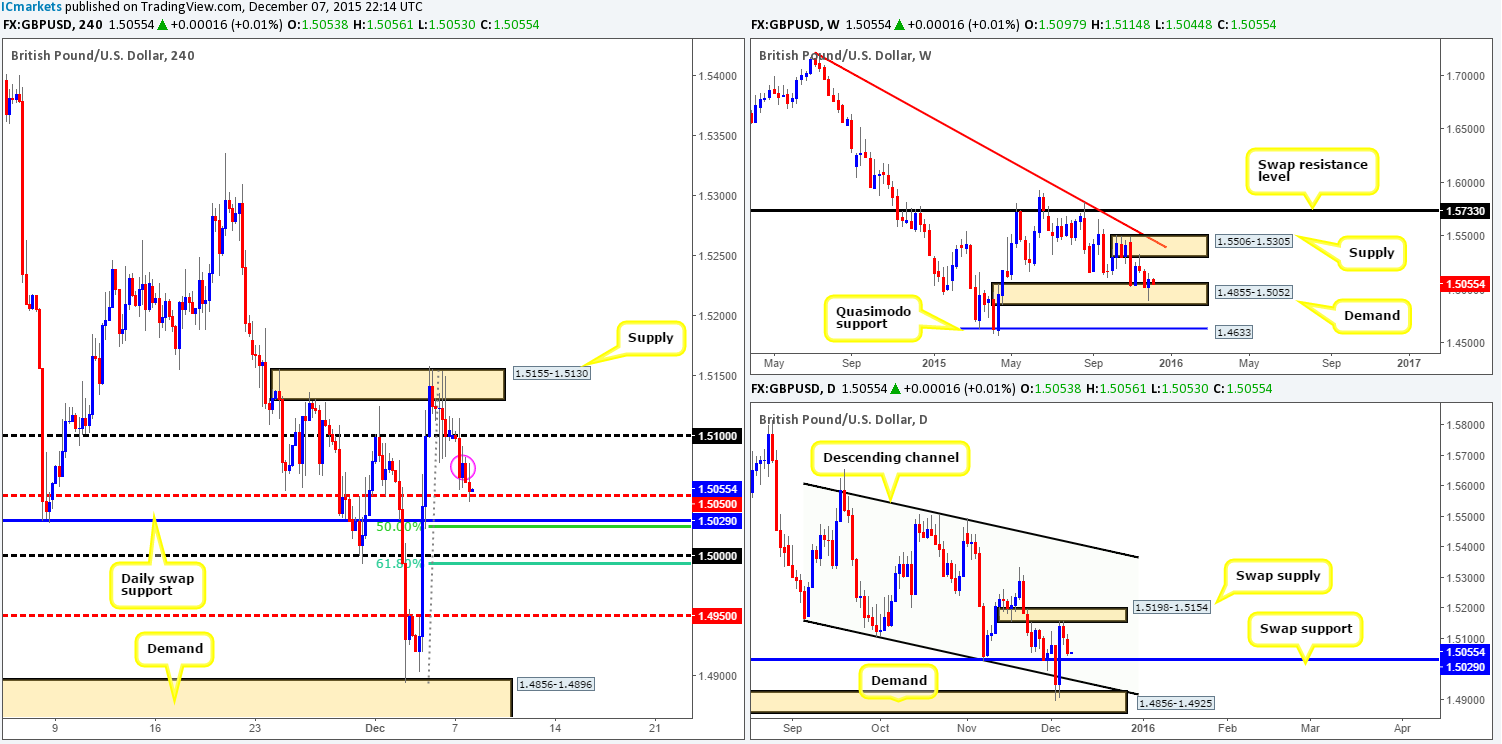
Kicking off our analysis with a look at the weekly chart this morning shows that price remains loitering within demand at 1.4855-1.5052. Meanwhile, down on the daily chart, we can see that Cable is now trading only a stone’s throw away from a swap support barrier coming in at 1.5029.
Stepping down into the pits of the H4 timeframe, however, reveals that the buyers and sellers are currently battling for position around mid-level support 1.5050. Taking into account the position of price on the daily picture (see above), and the fact there is near-term H4 supply clouding the H4 mid-level support seen at 1.5081-1.5065 (pink circle), we believe, there’s further downside to be seen before the bulls step in here.
With the above in mind, our attention will mostly be driven toward longs today from the aforementioned daily swap (support) level (converges nicely with the 50.0% Fibonacci level at 1.5023) and the large psychological support below it at 1.5000 (also converges nicely with the 61.8 % Fibonacci level at 1.4992). Since both of our buy levels are prone to being faked, we will only be trading here once/if lower timeframe confirmation is seen.
Levels to watch/ live orders:
- Buys: 1.5029 [Tentative – confirmation required] (Stop loss: dependent on where one confirms this level). 1.5000 [Tentative – confirmation required] (Stop loss: dependent on where one confirms this level).
- Sells: Flat (Stop loss: N/A).
AUD/USD:
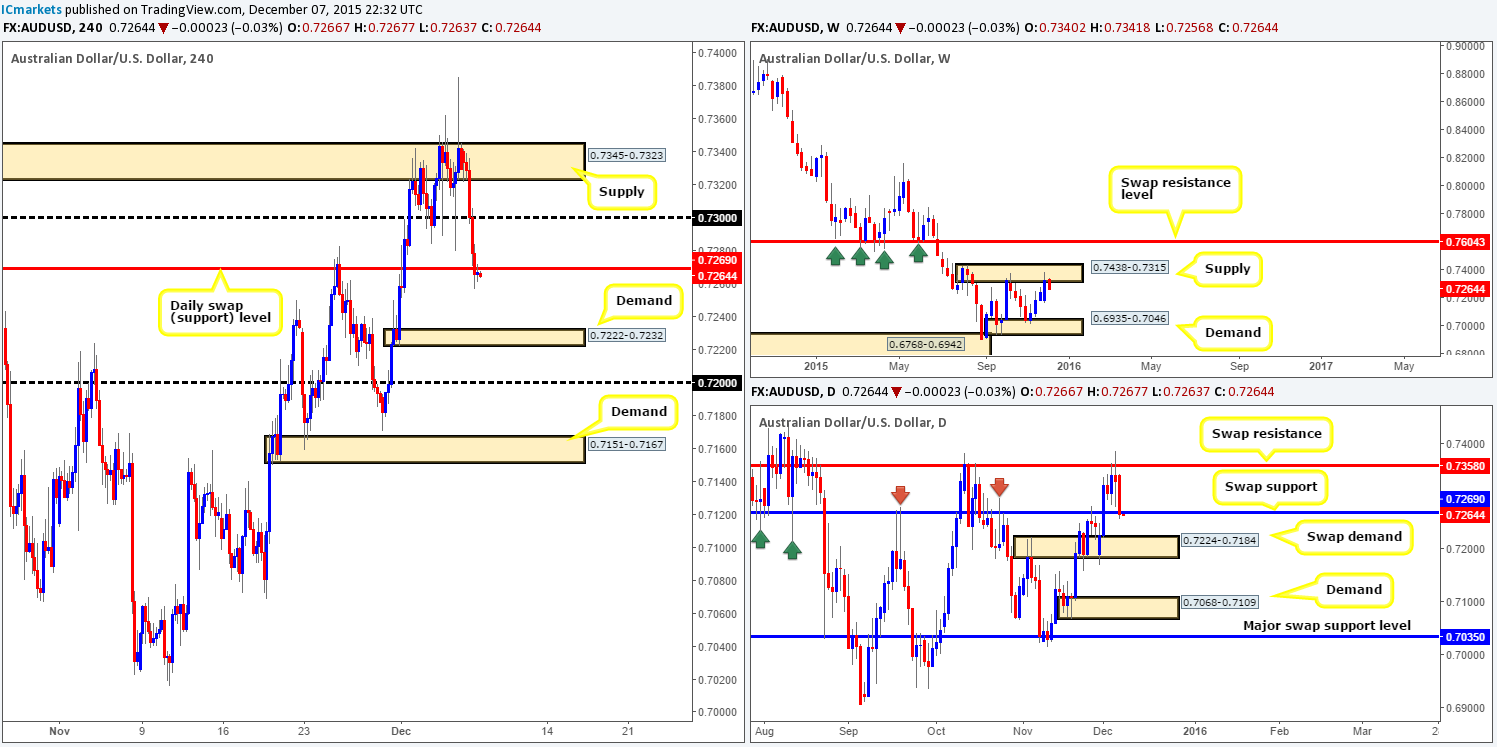
Beginning with the weekly timeframe this morning, supply at 0.7438-0.7315 appears to be holding the commodity currency lower for the time being. Despite this, looking down to the daily action, price has slightly closed below a swap support barrier at 0.7266, potentially clearing the path south towards the swap demand drawn from 0.7224-0.7184.
Turning our attention to the H4 chart, price is currently retesting the underside of the recently broken aforementioned daily swap support as resistance. If the sellers are successful at holding this level here, we see little reason why the Aussie will not continue lower today down to at least demand seen at 0.7222-0.7232.
Considering that this H4 demand sits on top of the daily swap (demand) zone mentioned above at 0.7224-0.7184, we would, dependent on how the lower timeframes respond, buy here. Furthermore, due to the psychological support below it at 0.7200 also sitting within the above said daily area, we’d also consider this a possible buy zone today too (confirmation required). Why we require confirmation when both these H4 levels have the support of the daily timeframe can be answered above in bold.
Levels to watch/ live orders:
- Buys: 0.7222-0.7232 [Tentative – confirmation required] (Stop loss: dependent on where one confirms this area). 0.7200 [Tentative – confirmation required] (Stop loss: dependent on where one confirms this level).
- Sells: Flat (Stop loss: N/A).
USD/JPY:
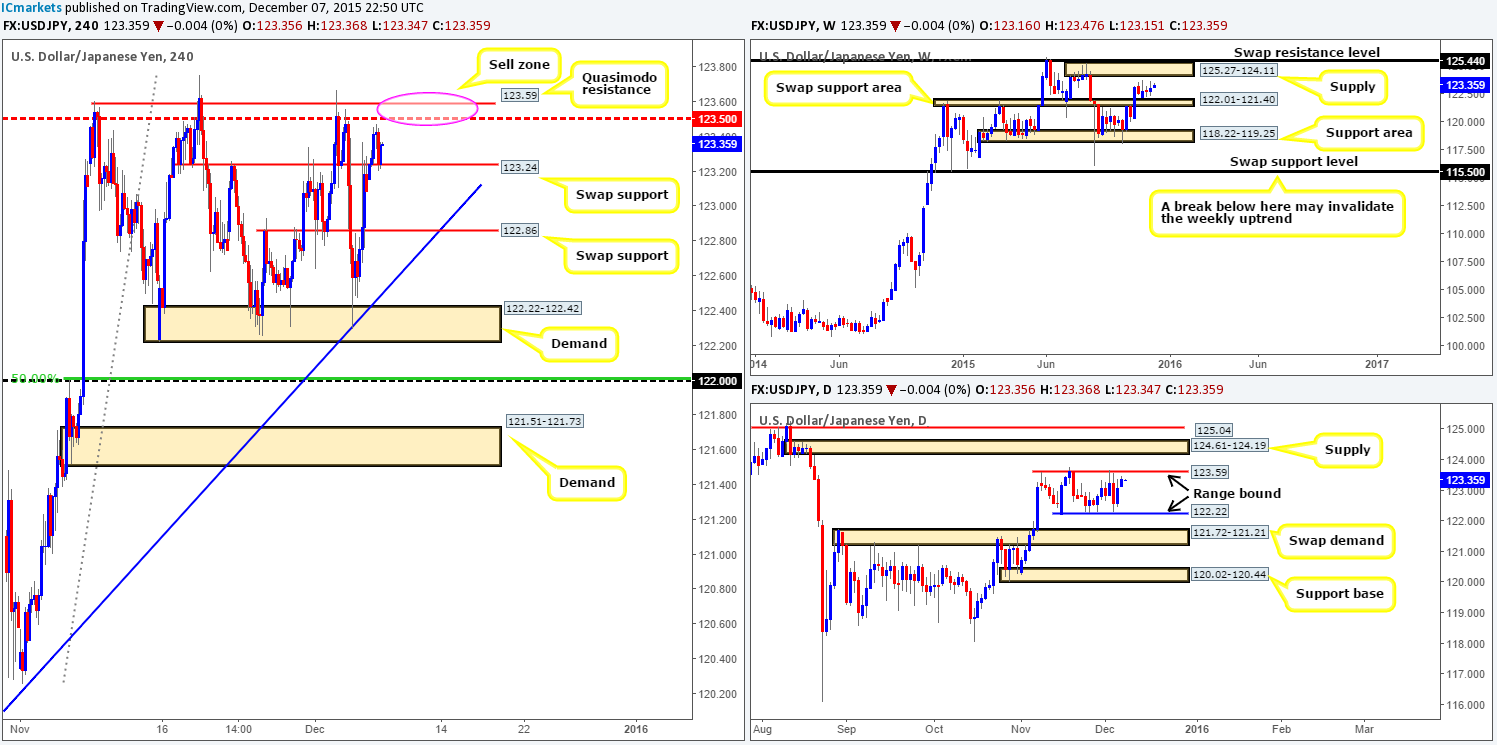
Following the open 123.16, the H4 swap resistance level at 123.24 was taken out and later on retested as support, which, as you can see, is currently holding firm. Despite this, we have absolutely no interest in looking for longs in this region today. Our reasoning lies within the current daily structure. Daily action has been trading in a phase of consolidation since around mid-November between 123.59/122.22, and is, at the time of writing, trading close to its upper boundary. Furthermore, on the H4 chart, 123.59 resembles a clear Quasimodo resistance barrier, boasting additional resistance just below it at the mid-level number 123.50.
Therefore, with the above in mind, and the fact that we’re seeing little on the weekly to tempt us otherwise (trading mid-range between supply at 125.27-124.11, and a swap support area at 122.01-121.40), today’s spotlight will firmly be focused on 123.59/123.50 for shorts today. Our team has come to a general consensus that before a trade can be executed here, lower timeframe selling action would need to be seen due to the possibility of another fakeout just like the one on the 2nd December!
Levels to watch/ live orders:
- Buys: Flat (Stop loss: N/A).
- Sells:123.59/123.50 [Tentative – confirmation required] (Stop loss: dependent on where one confirms this area).
USD/CAD:
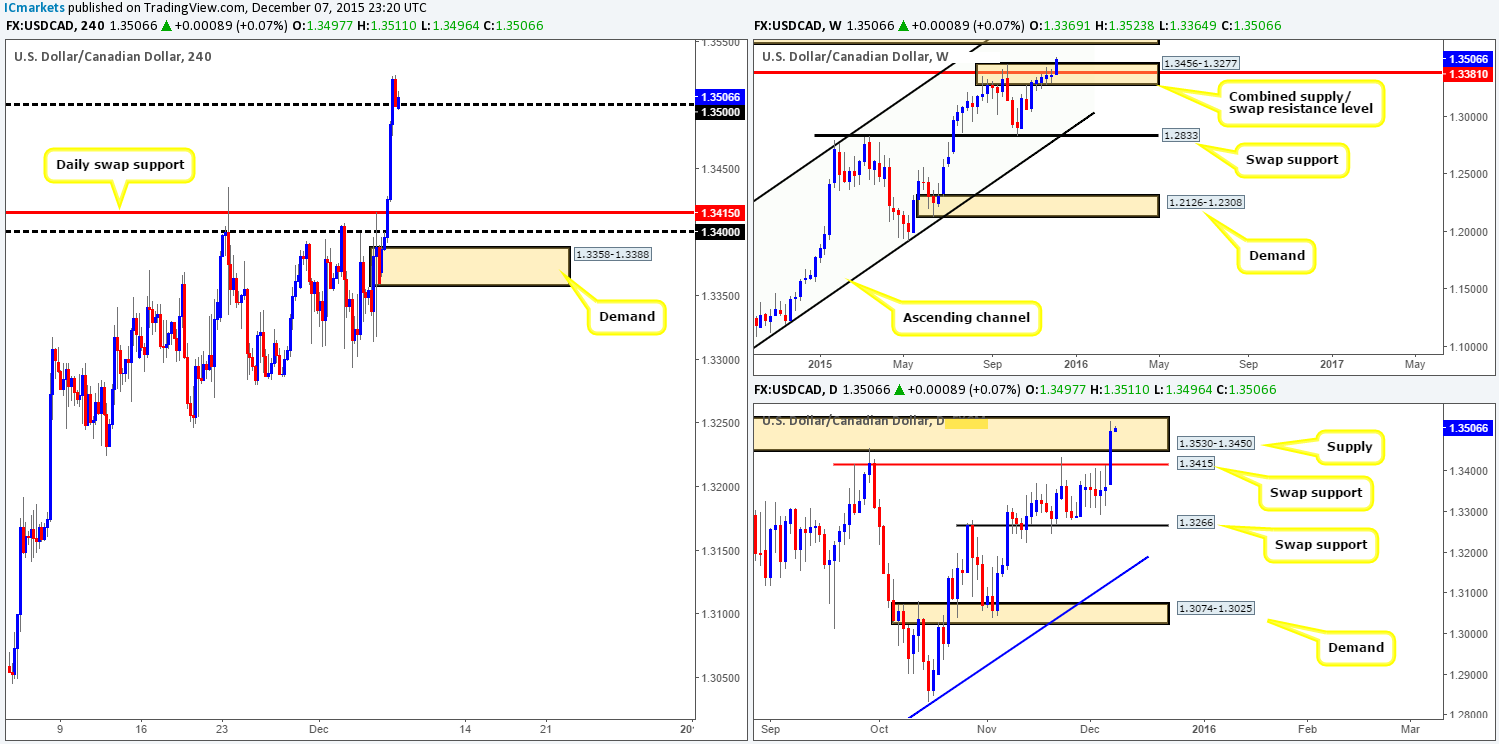
The USD/CAD pair, as you can see, rallied in aggressive fashion yesterday. This 130-pip drive north took out several technical barriers during its onslaught, ending the day retesting psychological support at 1.3500. With this taken on board, where does our team stand in the bigger picture? Well, the weekly combined supply/ swap resistance area at 1.3456-1.3277/1.3381 has been breached, and could have possibly set the stage for a continuation move up to supply coming in at 1.3818-1.3630. However, it may be worth waiting for the weekly candle to close shop before presuming that this is a continuation move. Zooming in on the daily action, nevertheless, we can see that consequent to the recent advance, price is now trading relatively deep within supply coming in at 1.3530-1.3450.
In essence, we have H4 trading from psychological support 1.3500, daily trading within supply and weekly indicating price may continue north – we emphasize the word may here guys! As a result, technical elements are just too mixed at the moment on this pair, leaving us with little choice but to remain flat for the time being.
Levels to watch/ live orders:
- Buys: Flat (Stop loss: N/A).
- Sells: Flat (Stop loss: N/A).
USD/CHF:
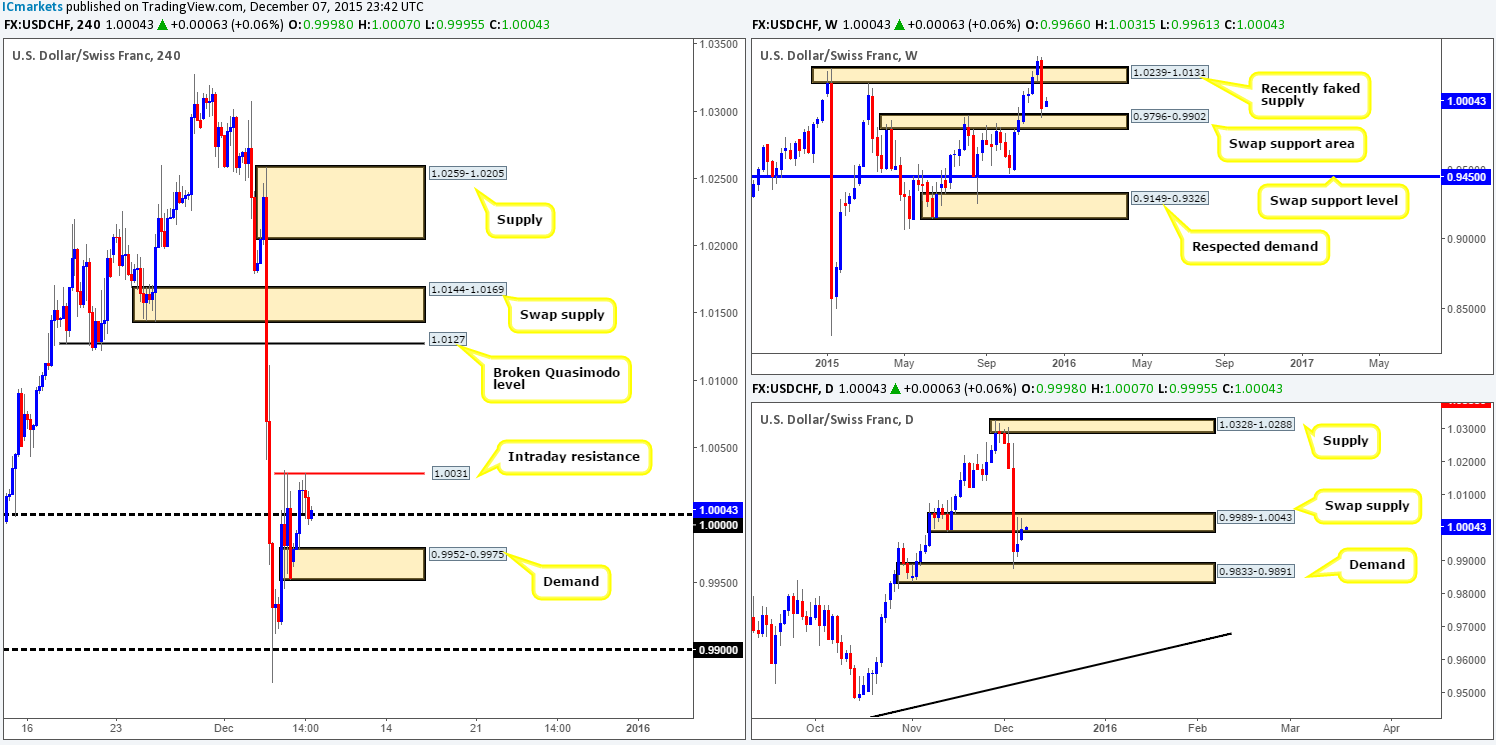
Coming at you directly from the weekly timeframe this morning, price is seen trading from the swap support zone drawn from 0.9796-0.9902. In the event that the buyers manage to hold the fort here, we may see price head back up to retest the recently faked supply at 1.0239-1.0131. On the other side of the ledger, daily action recently rebounded from demand at 0.9833-0.9891, but is now facing potential opposition from a swap supply zone seen at 0.9989-1.0043. For us to be convinced, at least medium-term, that this pair is heading higher, this swap supply area will need to be taken out.
Looking at the H4 timeframe, however, we can see that current action is trading around parity. Directly above this level there’s intraday resistance at 1.0031 to contend with, and lurking just below sits a minor demand at 0.9952-0.9975.
All things considered, our team is favoring the upside at present. In spite of this, before any longs are considered, a clean close above and (confirmed) retest of the H4 intraday resistance (mentioned above) at 1.0031 will need to be seen. This will not only push price above the aforementioned daily swap supply, but also give traders the chance to enter long targeting at least the broken Quasimodo level seen at 1.0127. The reason for requiring lower timeframe confirmation on any retest seen when the higher timeframe structures would be in agreement is simply because 1.0031 is prone to a fakeout seeing as how it’s a fixed level.
Levels to watch/ live orders:
- Buys: Watch for offers to be consumed around 1.0031 and then look to trade any retest seen at this number (confirmation required).
- Sells: Flat (Stop loss: N/A).
DOW 30
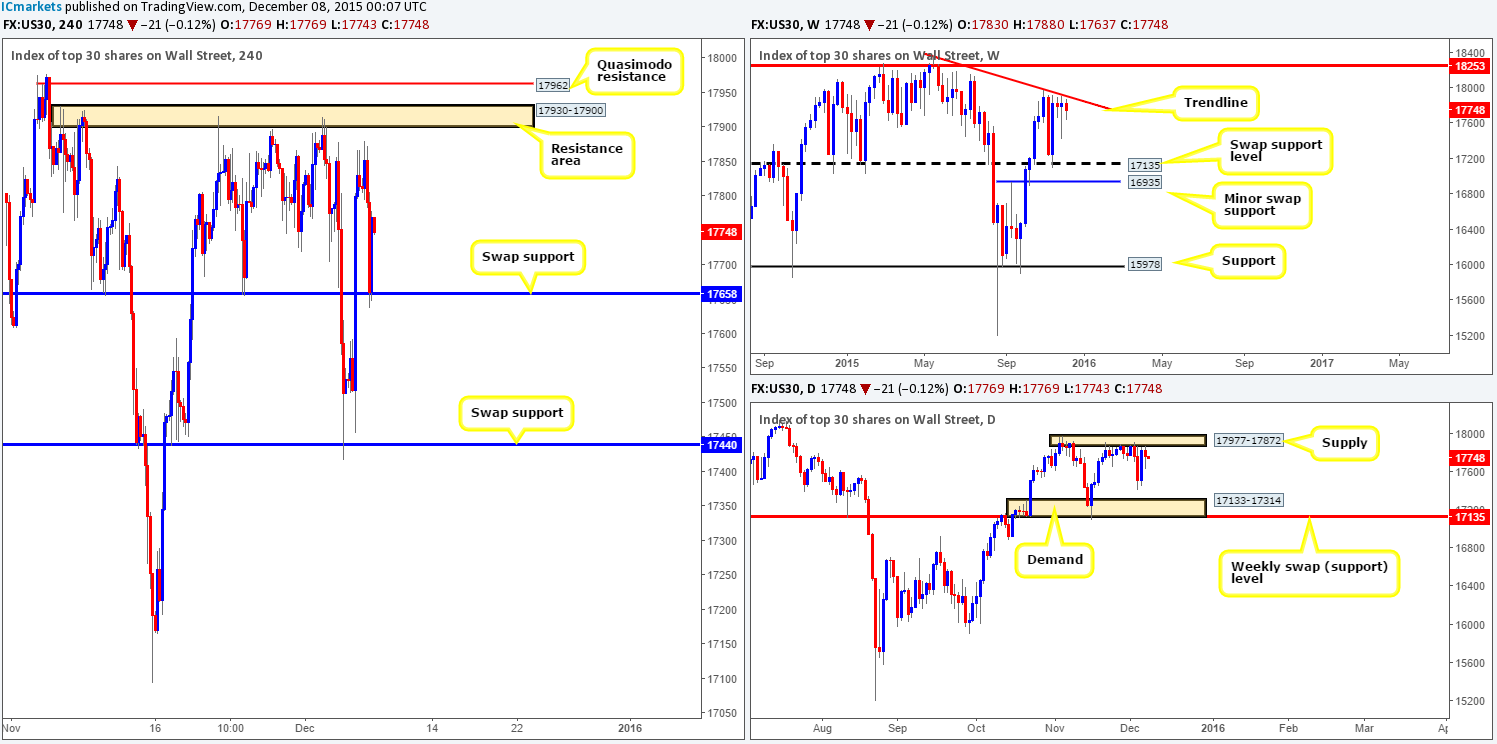
Technically, we’re not surprised by yesterday’s sell-off into the H4 swap support level 17658, since let’s not forget price is trading around both a weekly trendline taken from the high 18365, and the underside of a daily supply zone drawn from17977-17872.
Therefore, even though there is supportive pressure being seen from the above said H4 swap support level right now, we are not keen buyers in this market. On that account, here are the areas we have our eye on for shorts today/this week:
- The H4 resistance area at 17930-17900. This barrier has held price lower on a number of occasions now, and as a result may very well be weakening. However, it could still be an area where traders are looking to short. To be on the safe side traders, we would recommend only trading this barrier with lower timeframe confirmation.
- The H4 Quasimodo resistance level at 17962. This level is fresh and may provide the perfect fakeout barrier above the current H4 resistance area. We feel this level is solid enough for a market sell order, as we have the opportunity to place the stop-loss order above daily supply around the 17980 region.
Levels to watch/ live orders:
- Buys: Flat (Stop loss: N/A).
- Sells: 17930-17900 [Tentative – confirmation required] (Stop loss: dependent on where one confirms this area). 17962 [Tentative – confirmation required] (Stop loss: dependent on where one confirms this level).
XAU/USD: (Gold)
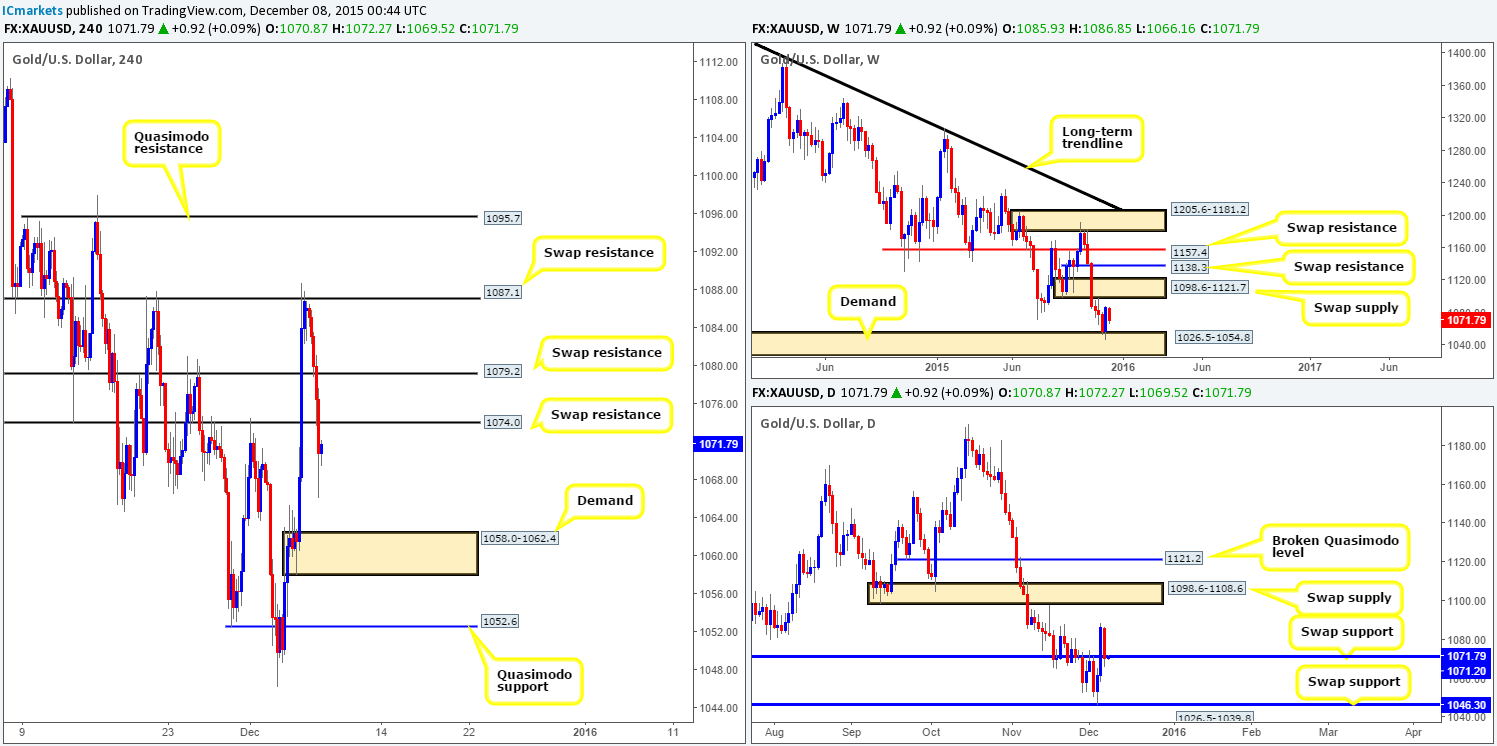
During the course of yesterday’s sessions Gold fell sharply from the H4 swap resistance barrier drawn from 1087.1. This, as you can see, took out both swap supports at 1079.2 and at 1074.0, consequently reaching lows of 1073.7 on the day. With this, upside H4 resistance is now seen at 1074.0, and directly below sits H4 demand coming in at 1058.0-1062.4.In the bigger picture, however, weekly action is presently capped between demand at 1026.5-1054.8 and a swap supply zone at 1098.6-1121.7, whilst daily movement is now trading around a swap support level at 1071.2.
With the above in mind, both the above said H4 demand and H4 resistance clearly have no connection with higher timeframe structure. What this means, at least to us anyway, is one has to be cautious trading these near-term H4 zones, and only take a trade should one manage to spot a lower timeframe setup around these areas.
Levels to watch/ live orders:
- Buys: 1058.0-1062.4 [Tentative – confirmation required] (Stop loss: dependent on where one confirms this area).
- Sells: 1074.0 [Tentative – confirmation required] (Stop loss: dependent on where one confirms this level).


