A note on lower timeframe confirming price action…
Waiting for lower timeframe confirmation is our main tool to confirm strength within higher timeframe zones, and has really been the key to our trading success. It takes a little time to understand the subtle nuances, however, as each trade is never the same, but once you master the rhythm so to speak, you will be saved from countless unnecessary losing trades. The following is a list of what we look for:
- A break/retest of supply or demand dependent on which way you’re trading.
- A trendline break/retest.
- Buying/selling tails – essentially we look for a cluster of very obvious spikes off of lower timeframe support and resistance levels within the higher timeframe zone.
- Candlestick patterns. We tend to only stick with pin bars and engulfing bars as these have proven to be the most effective.
EUR/USD:
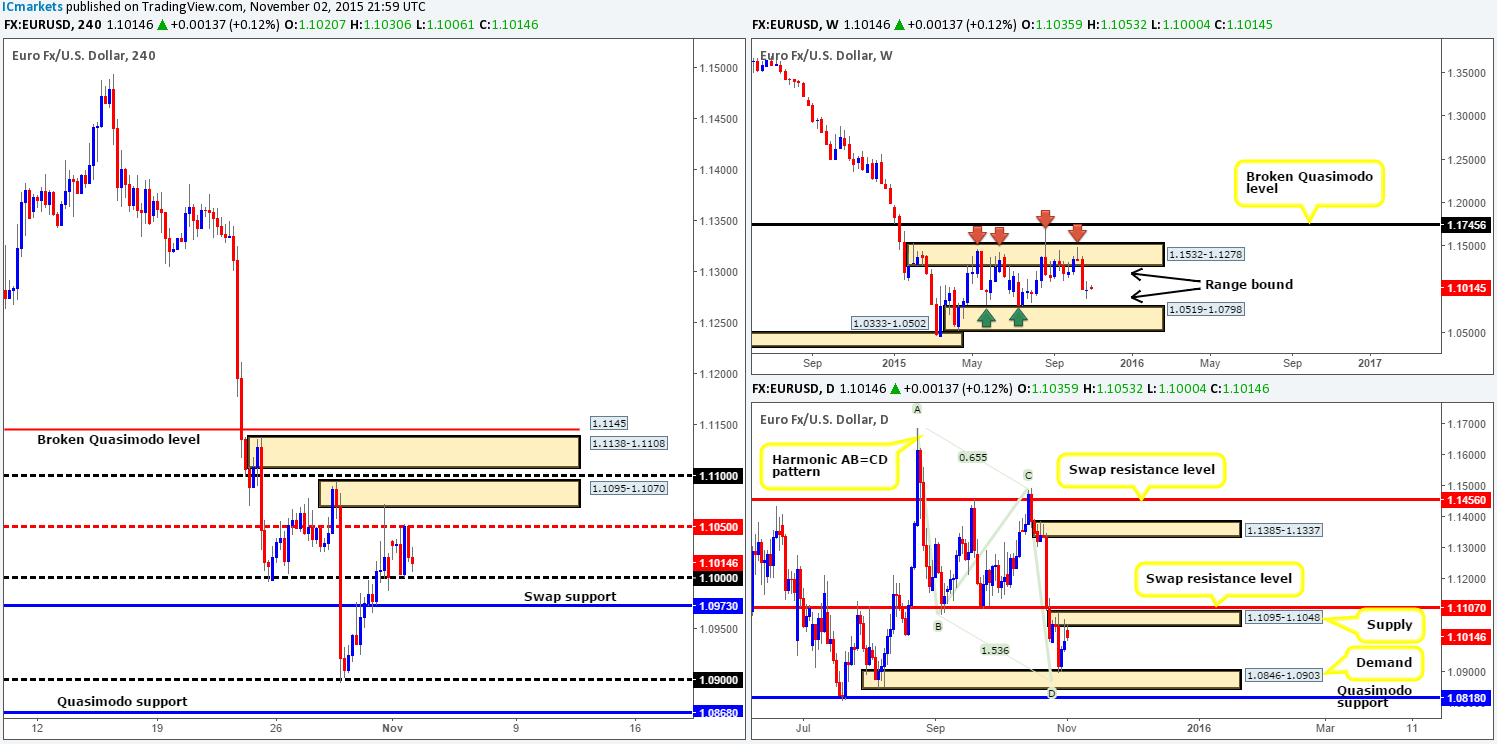
During the course of yesterday’s sessions the EUR was relatively quiet. The balance of bids against offers appears to be even as price consolidated between mid-level resistance at 1.1050 (represents the underside of daily supply at 1.1095-1.1048), and the large psychological support 1.1000. Beyond this temporary consolidation, however, there’s a nice-looking supply sitting just above at 1.1095-1.1070 (positioned deep within daily supply at 1.1095-1.1048), and below, a swap support level is seen coming in at 1.0973.
Given that the weekly timeframe is currently trading mid-range between demand at 1.0519-1.0798/supply coming in from 1.1532-1.1278, and daily action is trading from the supply mentioned above at 1.1095-1.1048, we’re ultimately favoring shorts today. That being the case. We’d consider (preferably confirmed) selling from the following areas:
- Mid-level resistance at 1.1050.
- 4hr supply just above at 1.1095-1.1070. A fakeout above 1.1050 similar to Friday would be delicious!
- Also, should the swap support barrier at 1.0979 be consumed, we’d consider a short if price retested this barrier as resistance together with a lower timeframe confirming signal.
Levels to watch/live orders:
- Buys: Flat (Stop loss: N/A).
- Sells: 1.1050 [Tentative – confirmation required] (Stop loss: dependent on where one confirms this level)
1.1095-1.1070 [Tentative – confirmation required] (Stop loss: dependent on where one confirms this area) watch for bids to be consumed around 1.0973 and then look to trade any retest seen at this level (confirmation required).
GBP/USD:
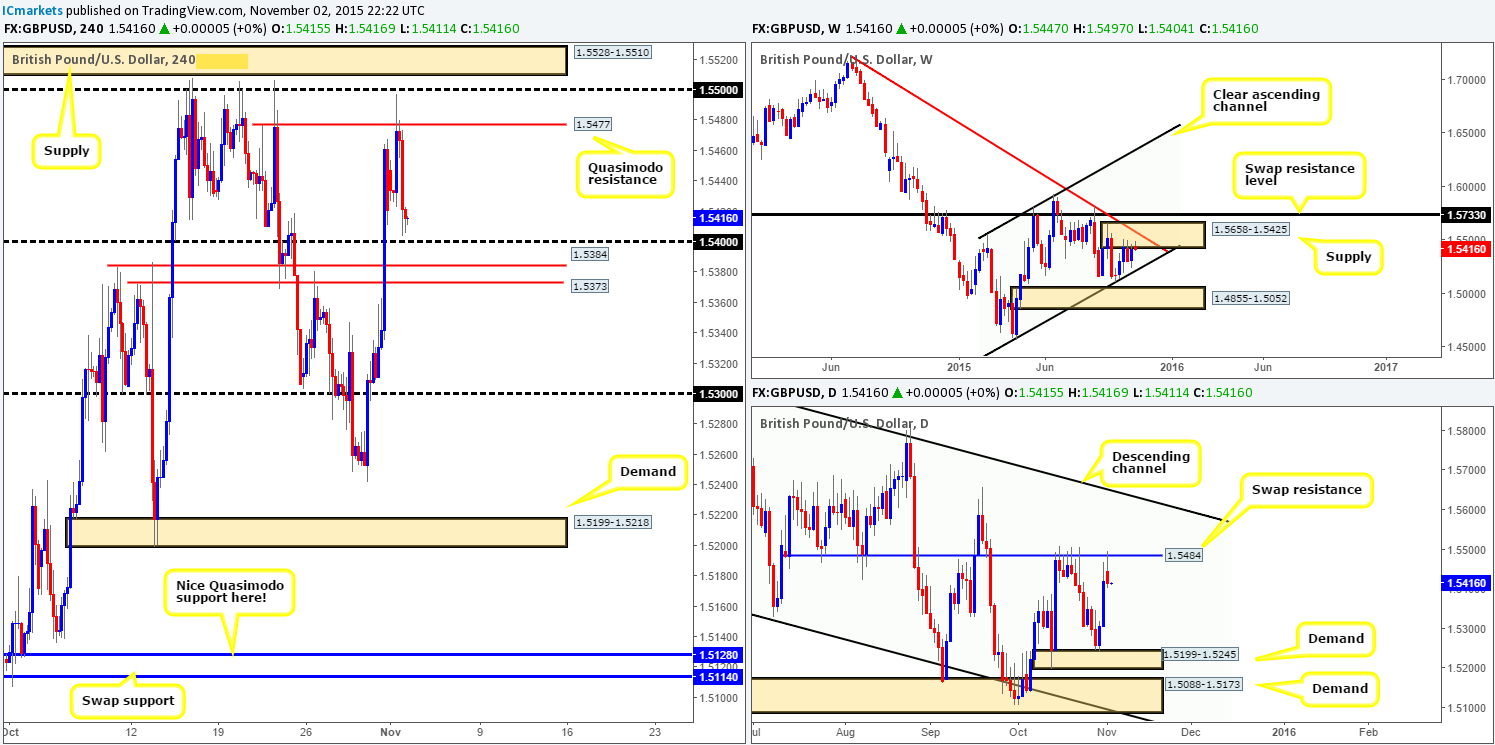
Strong buyers stepped in and drove the pound higher amid London’s opening trade yesterday. This, as you can see, momentarily surpassed the Quasimodo resistance level at 1.5477 and came within three pips of connecting with psychological resistance 1.5500, before selling off and reaching lows of 1.5404 on the day.
For those who read our previous report (http://www.icmarkets.com/blog/monday-2nd-november-weekly-technical-outlook-and-review/), you may recall us mentioning to watch for confirmed shorting opportunities at the above said Quasimodo level. Unfortunately, we did not manage to find any suitable price action to sell here, well done to any of our readers who did though!
Going forward, recent movement shows price not only trading from weekly supply at 1.5658-1.5425, but also from the underside of a daily swap (resistance) level at 1.5484 as well. Although there is clear room on both the weekly and daily charts to move lower, there is, however, multiple support structures looming below current price on the 4hr chart. Once/if psychological support 1.5400 and the closely-linked swap support levels at 1.5384/1.5373 are taken out, we’d then be confident selling this market on any retest (confirmation would still be required) that may take place.
Levels to watch/ live orders:
- Buys: Flat (Stop loss: N/A).
- Sells: Watch for bids to be consumed around 1.5384/1.5373 and then look to trade any retest seen at this area (confirmation required).
AUD/USD:
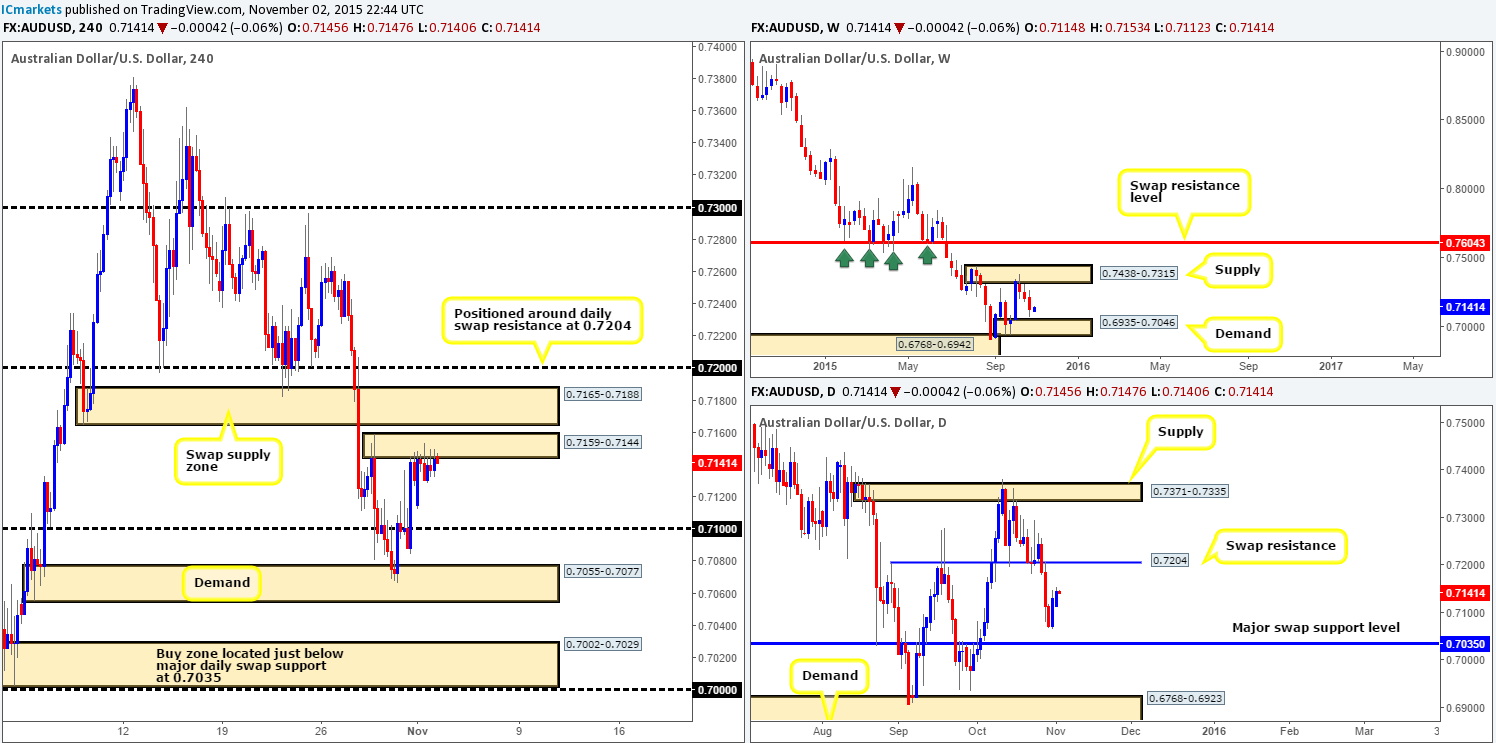
Following the open 0.7114, a strong flow of bids was seen entering into this market, consequently pulling price back up into the jaws of supply coming in at 0.7159-0.7144. This was about as exciting as this pair got yesterday as shortly after, trade entered into a phase of consolidation which will likely continue today until the RBA interest rate decision and statement goes live.
In that price is currently trading around a supply zone right now, how do things stand on the higher timeframes? Well, minor recovery is being seen on the weekly chart from just above demand at 0.6935-0.7046. Down on the daily chart, nonetheless, price is, as far as we see, roaming between two important barriers: a swap resistance level at 0.7204 and a major swap support level drawn from 0.7035.
Therefore, much the same as our previous report, we continue to watch the following levels:
On the buy side:
- Psychological support 0.7100. Although little response was seen from this number last week, we still believe it is worth keeping an eye on for a possible trade.
- Demand at 0.7055-0.7077. This barrier responded better than expected during Thursday’s trade last week and could potentially bounce price again later on today/this week.
- Demand at 0.7002-0.7029. Now, this is a beauty and could provide much more than an intraday bounce seeing as it is positioned just below the major daily swap (support) level mentioned above at 0.7035.
On the sell side:
- Supply at 0.7159-0.7144. Play carefully here guys, since a fake above to the swap supply area at 0.7165-0.7188 (also a possible sell zone to keep a tab on) could be seen.
- Psychological resistance 0.7200. This level has not only provided significant support to this market over the past month, it is also seen on the daily scale as a proven swap resistance level at 0.7204. Therefore, this barrier could be one to watch for more than an intraday move this week.
Levels to watch/ live orders:
- Buys: 0.7100 [Tentative – confirmation required] (Stop loss: dependent on where one confirms this level) 0.7055-0.7077 [Tentative – confirmation required] (Stop loss: dependent on where one confirms this area) 0.7002-0.7029 [dependent on the approach to this zone and time of day, we may consider entering at market here] (Stop loss: likely below 0.7000 by about 10 pips).
- Sells: 0.7159-0.7144 [Tentative – confirmation required] (Stop loss: dependent on where one confirms this area) 0.7165-0.7188 [Tentative – confirmation required] (Stop loss: dependent on where one confirms this area) 0.7200 [Tentative – confirmation required] (Stop loss: dependent on where one confirms this level).
USD/JPY:
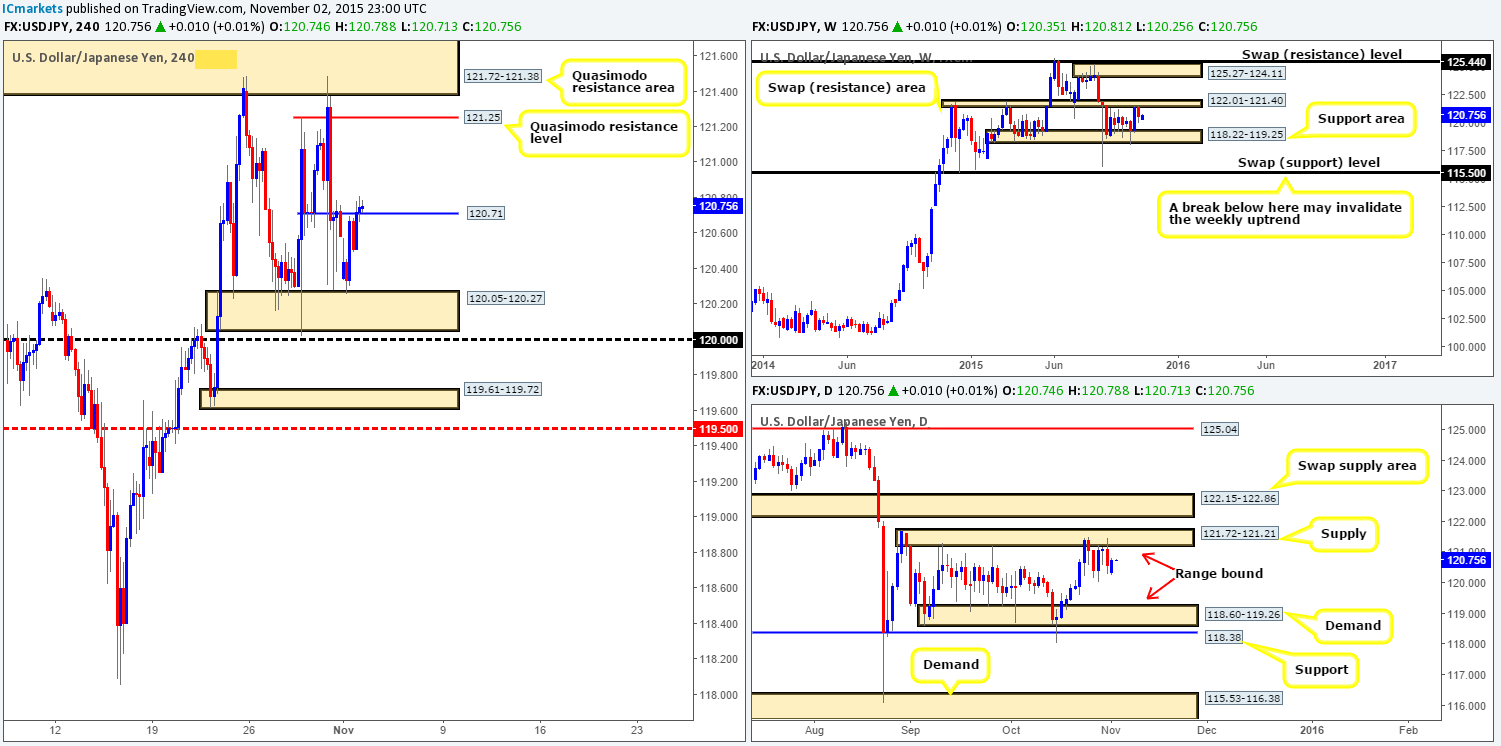
Throughout the course of yesterday’s sessions, the USD/JPY remained relatively well-bid from demand coming in at 120.05-120.27. The pair traded as high as 120.81, consequently breaking above a minor swap resistance hurdle seen at 120.71.
At the time of writing, this level is being retested as support, which if holds, could be a nice platform to look for longs today since there is ample room above for price to rally north up to at least 121.25 – a Quasimodo resistance level. Nevertheless, when we throw the higher timeframes into the mix, the directional bias changes somewhat. Weekly action recently responded to the range resistance area at 122.01-121.40, and is now considered somewhat mid-range. By the same token, the buyers and sellers on the daily timeframe have been seen battling for position around the underside of a range supply area visible at 121.72-121.21. However, both still show room for a small move higher.
To that end, should the buyers manage to defend 120.71 today as support, there is still a possible trade long to be had in our opinion. We personally would only feel comfortable trading this level, nonetheless, if it’s confirmed on the lower timeframes beforehand.
Levels to watch/ live orders:
- Buys: 120.71 [Tentative – confirmation required] (Stop loss: dependent on where confirms this level).
- Sells: Flat (Stop loss: N/A).
USD/CAD:
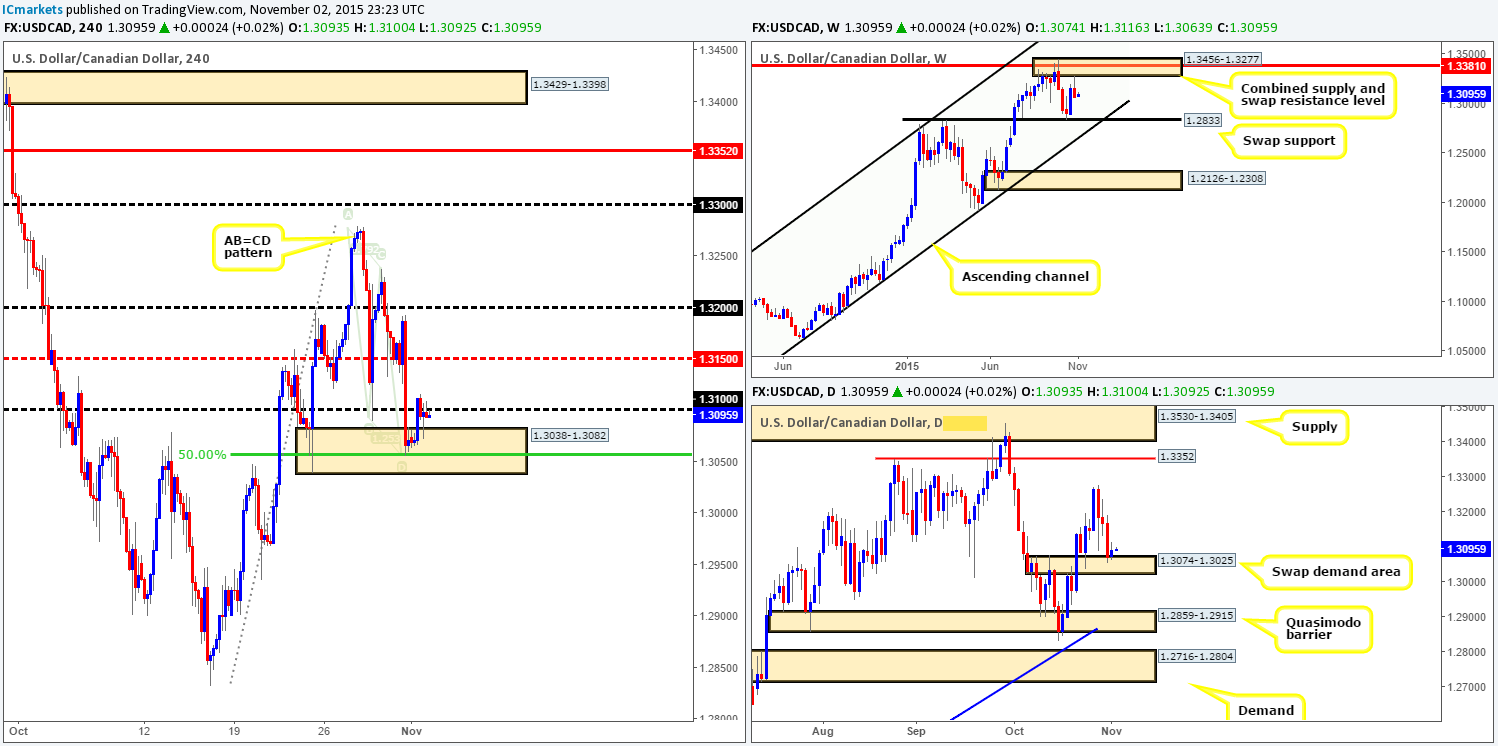
In our previous report (http://www.icmarkets.com/blog/monday-2nd-november-weekly-technical-outlook-and-review/), it was noted that we entered into a small long position at 1.3059 on Friday, targeting psychological resistance 1.3100 as our immediate take-profit level. As you can see, price hit our first take-profit level yesterday. With 50% of our position now locked in at 1.3100 and our stop-loss order set at breakeven, we’re effectively in a risk-free trade right now.
Seeing as price is currently trading from a daily swap (demand) base at 1.3074-1.3025, there is potential for a bigger move here, hence leaving some of our position open. Ultimately, we now have our eye on the mid-level resistance barrier 1.3150 where we plan to liquate a further 30% of our position. However, we are prepared to be stopped out on this trade since let’s not forget that price recently rebounded from a weekly supply area at 1.3456-1.3277, which could force prices lower. It will be interesting to see how this plays out!
Levels to watch/ live orders:
- Buys: 1.3059 [LIVE] (Stop loss: breakeven).
- Sells: Flat (stop loss: N/A).
USD/CHF:
Recent action shows that the USD/CHF finally crossed swords with demand yesterday at 0.9815-0.9843, and has so far responded relatively well. Nevertheless, we feel that this bounce from here will be short-lived. In our previous analysis (http://www.icmarkets.com/blog/monday-2nd-november-weekly-technical-outlook-and-review/), we reported that we had no interest in buying from this demand base. Instead, we really liked the look of the broken Quasimodo level below it at 0.9802.
The reasoning behind this approach stems from (as mentioned in yesterday’s report) the following:
- Firstly, there is a very high probability price will fake below this area of demand into the broken Quasimodo level (BQM) at 0.9802 due to how close it is.
- Secondly, unlike the BQM, this demand has no higher timeframe converging support. The BQM, on the other hand, sits just above a weekly swap (support) level at 0.9796. In addition to this, it is also positioned two pips above psychological support 0.9800!
Therefore, given these points and depending on how price behaves if/when the market revisits this demand, we may consider taking a long at 0.9802 at market.
Should this come to fruition, we’re not simply looking for a small intraday bounce from here; we’re actually looking for a good-sized move due to its relationship with the weekly timeframe (see below in bold)… Following last week’s close above the weekly swap (resistance) level at 0.9796, the weekly shows a clear run north up to a stacked area of supply coming in at 1.0239-1.0131/1.0126-1.0044. In addition to this formation, we also see a nice-looking AB=CD Harmonic pattern completing around 1.0046, thus forming one heck of a sell zone to keep an eye on!
Levels to watch/ live orders:
- Buys: 0.9802 [Tentative – confirmation MIGHT be required] (Stop loss: dependent on where one confirms this level).
- Sells: Flat (Stop loss: N/A).
DOW 30:
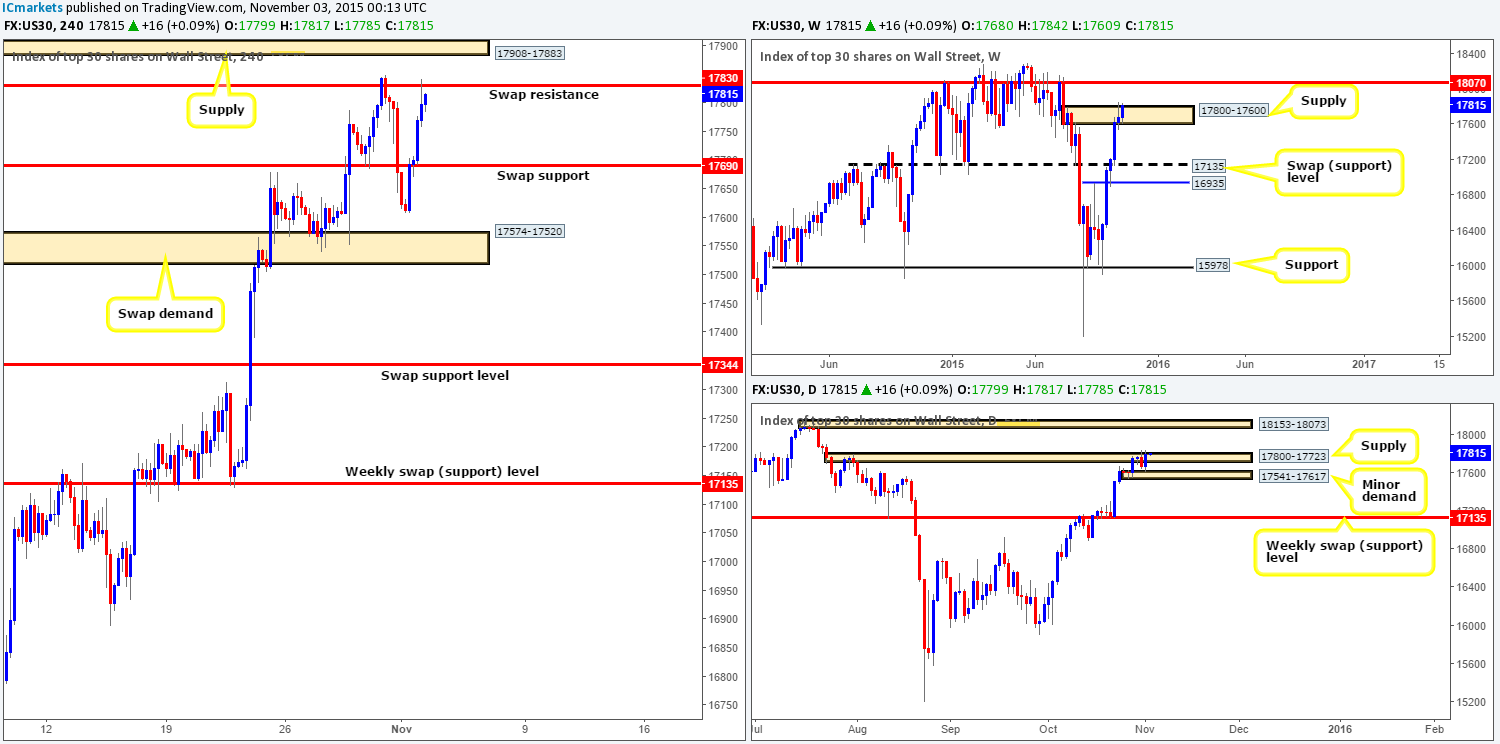
This morning’s analysis will kick off with a look at the weekly timeframe, which shows price kissing the extreme upper limit of supply drawn from 17800-17600. At this point in time, it appears as though offers are weak in this region, thus we may see a push higher up to 18070 sometime soon. Down on the daily timeframe, however, price jabbed into minor demand at 17541-17617, causing the market to engulf Friday’s bear candle and once again stab above the weekly’s partner supply on the daily timeframe at 17800-17723. Should the path north be free here, price could potentially rally all the way up to supply sitting at 18153-18073 (sits just above the 18070 weekly level).
Turning our attention to the 4hr timeframe, we can see that bids begun rippling into the market going into London trade from around the 17609 mark yesterday. Swap resistance (now support) at 17690 was taken out, with price ending the day advancing higher into the hands of another swap resistance barrier seen at 17830.
Based on the response seen from both the aforementioned weekly and daily supplies (see above), we’re no longer confident shorting this market. Therefore, at least for us, selling from 17830 today is out of the question. Instead, a close above 17830 is what we’re currently looking for. Now, should this come to fruition and price retests this barrier as support (with lower timeframe confirmation), we would jump in long even with near-term supply looming just above at 17908-17883. The reason for why is a sustained move above this 4hr level will likely force a daily close to print above daily supply at 17800-17723, thus opening the path to a bigger move (see above in bold). Once the 4hr supply is consumed, we’d then be confident enough to move our stop to breakeven and begin looking for a suitable target.
Levels to watch/ live orders:
- Buys: Watch for offers to be consumed around 17830 and then look to trade any retest seen at this level (confirmation required).
- Sells: Flat (Stop loss: N/A).
XAU/USD: (Gold)
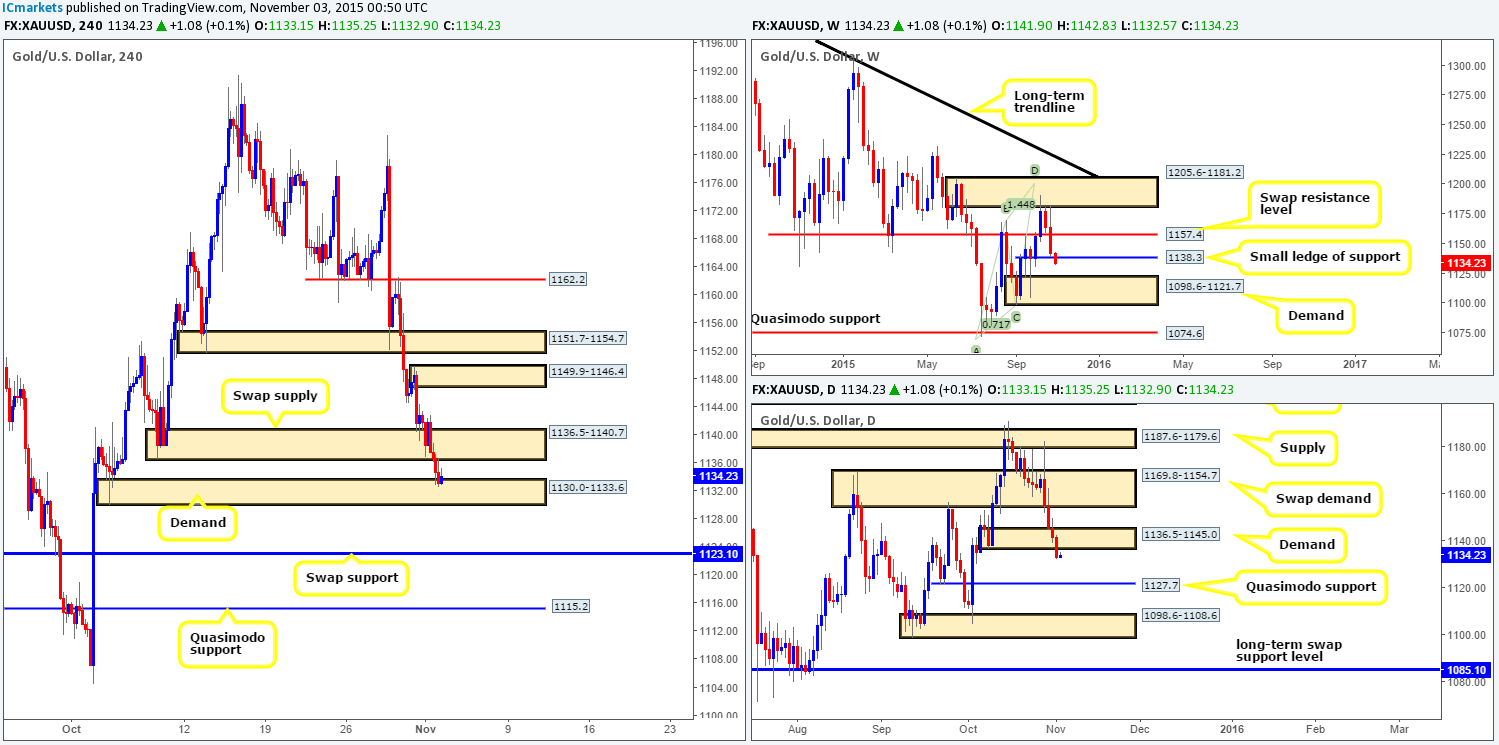
Kicking off this morning’s analysis with a quick look at the weekly timeframe reveals that price is now trading beneath the small ‘ledge’ of support at 1138.3. Beyond this barrier, traders are now likely honing in on demand coming in at 1098.6-1121.7. Daily action on the other hand shows price closed below demand at 1136.5-1145.0 yesterday, potentially setting the stage for a further decline down towards Quasimodo support sitting at 1127.7.
Looking at the 4hr timeframe, however, we can see that the recent drive lower in this market pushed price below demand (now supply) seen at 1136.5-1140.7. This did two things. Firstly, it took out our buy order at 1141.1, and secondly, it sent price into the jaws of a demand area seen at 1130.0-1133.6. Other than this area of demand, we see very little supportive structure below until around the swap support barrier coming in at 1123.1 (sits below the daily Quasimodo support at 1127.7), followed by Quasimodo support drawn from 1115.2 (located within weekly demand at 1098.6-1121.7).
Given the above, we have absolutely no interest in buying from the current demand area. For one, we do not fancy buying into higher timeframe flow (see above), and two, with the swap supply area lurking above at 1136.5-1140.7, risk/reward would not be favorable. This leaves us with shorts. Usually, we’d wait for price to close below and retest the current demand, but seeing as the daily Quasimodo support is sitting just below, it’s very difficult to trade this market right now unfortunately! As such, at least for the time being, we are going to remain flat.
Levels to watch/live orders:
- Buys: Flat (Stop loss: N/A).
- Sells: Flat (Stop loss: N/A).


