EUR/USD:
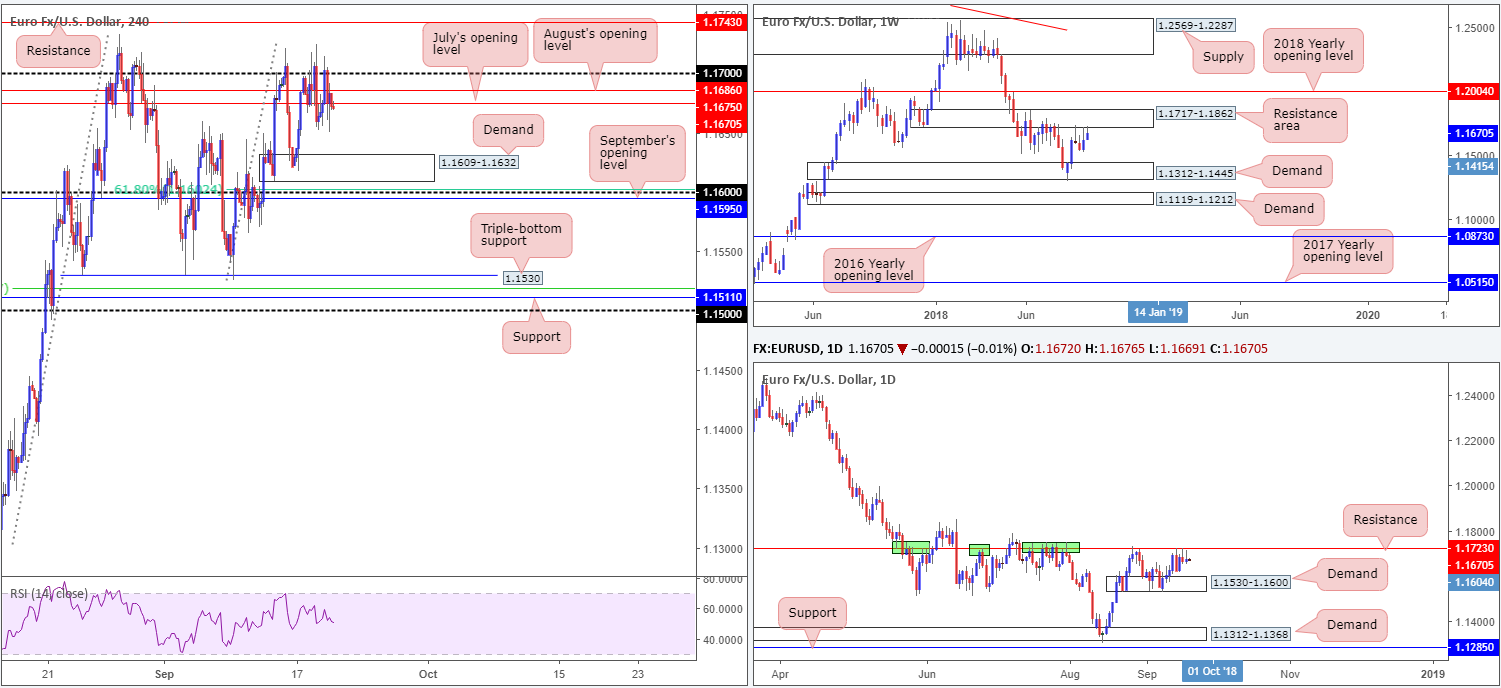
Since Monday, speculative interest remains capped beneath the 1.17 band on the H4 timeframe. July and August’s opening levels at 1.1675/1.1686 are largely being ignored. Should the sellers remain defensive, the next port of call on the H4 scale falls in around demand coming in at 1.1609-1.1632, shadowed closely by the 1.16 handle, a 61.8% Fib support at 1.1602 and September’s opening level at 1.1595.
Against the backdrop of intraday flow, the daily candles are seen capped by a resistance level plotted at 1.1723. Note this level boasts incredibly strong history. Also worth noting is the weekly resistance area at 1.1717-1.1862 currently in play, which happens to house the aforementioned daily resistance level within its lower range. Downside targets on the bigger picture can be seen at a weekly demand zone coming in at 1.1312-1.1445, and a daily demand base drawn from 1.1530-1.1600.
Areas of consideration:
The higher-timeframe resistances, along with the 1.17 handle on the H4 timeframe, caution against an exuberantly bullish approach today/this week.
A H4 close beneath July’s opening level at 1.1675 from current price could trigger a bout of selling back towards the current H4 demand. A retest to the underside of 1.1675 following a close lower will likely draw in sellers, so do keep your eyes open for this possibility today/this week.
However, should we break through 1.17, intraday traders will likely have their crosshairs fixed on the H4 resistance level mentioned above at 1.1743 for possible shorting opportunities. This level warrants particular attention. Not only because it’s a well-rounded resistance, but also due to where it is positioned on the higher timeframes!
Today’s data points: German Buba President Weidmann speaks; Philly Fed manufacturing index.
GBP/USD:
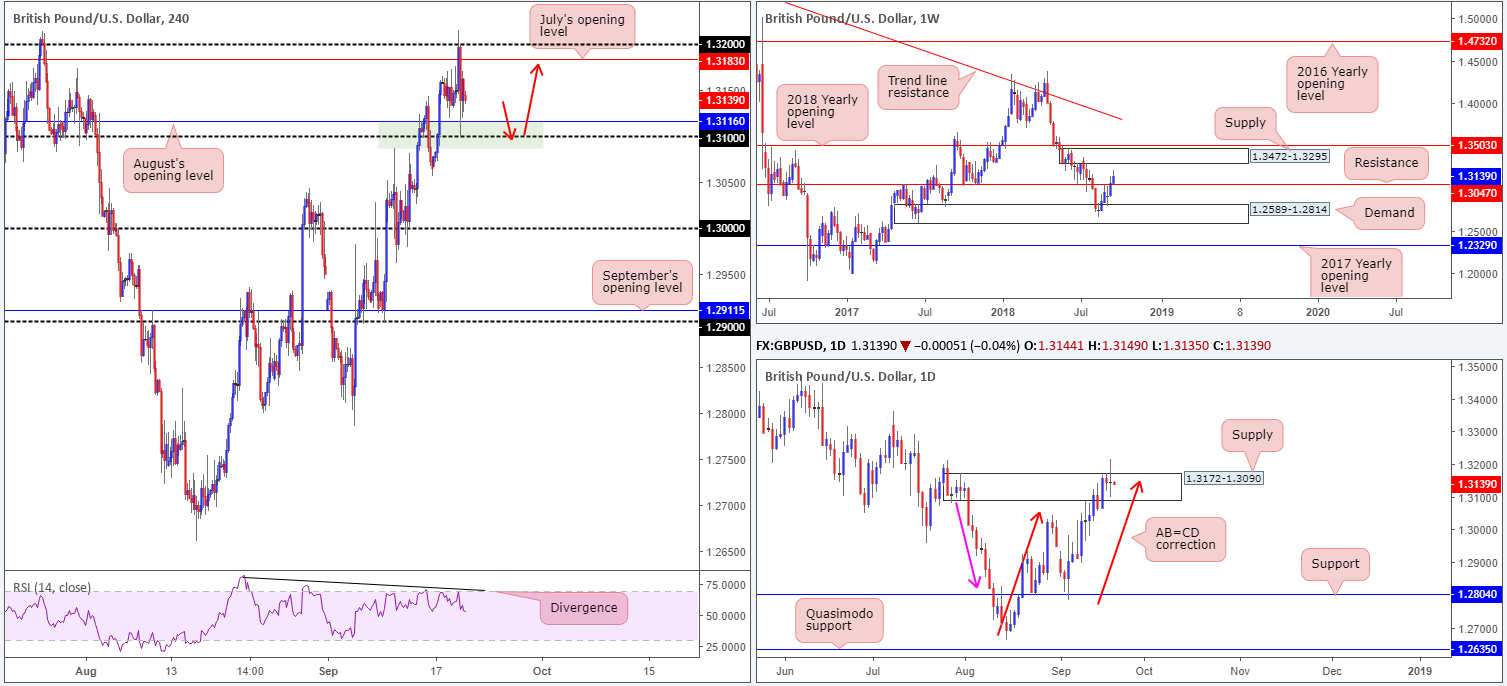
Sterling endured a roller-coaster session on Wednesday, surging beyond 1.32 after inflation data surprised to the upside. However, the tone of commentary relating to Brexit also offered traders reasons for cautious optimism, falling heavily after news that May is set to reject Barnier’s Irish backstop proposal, returning back to its 1.31 handle. As you can see, 1.31 and August’s opening level at 1.3116 remain supportive for the time being.
The story on the weekly timeframe, nonetheless, shows weekly price attacked higher ground in recent trade, firmly clearing resistance at 1.3047. Assuming further upside is observed, the next destination is likely to be a supply zone seen printed at 1.3472-1.3295. Contrary to weekly positioning, daily price is seen trading within the upper range of a supply zone priced in at 1.3172-1.3090, though do note this area was violated during yesterday’s session. Besides this supply emphasizing a strong base (check out the downside momentum – pink arrow), the area also fuses with an AB=CD correction (red arrows) point at 1.3150ish.
Areas of consideration:
With weekly price signaling further buying on the horizon, along with H4 action seen establishing firm support off of 1.31 and the top edge of the current daily supply recently suffering a breach to the upside, the buyers appear to have the upper hand at the moment. With that being the case, traders may be interested in a retest play off of 1.31 today (red arrows). Stop-loss orders, according to the technical picture, are best placed below the grey zone around the 1.3080 point, with an initial target objective set at around July’s opening level at 1.3183.
Today’s data points: UK retail sales m/m; Philly Fed manufacturing index.
AUD/USD:
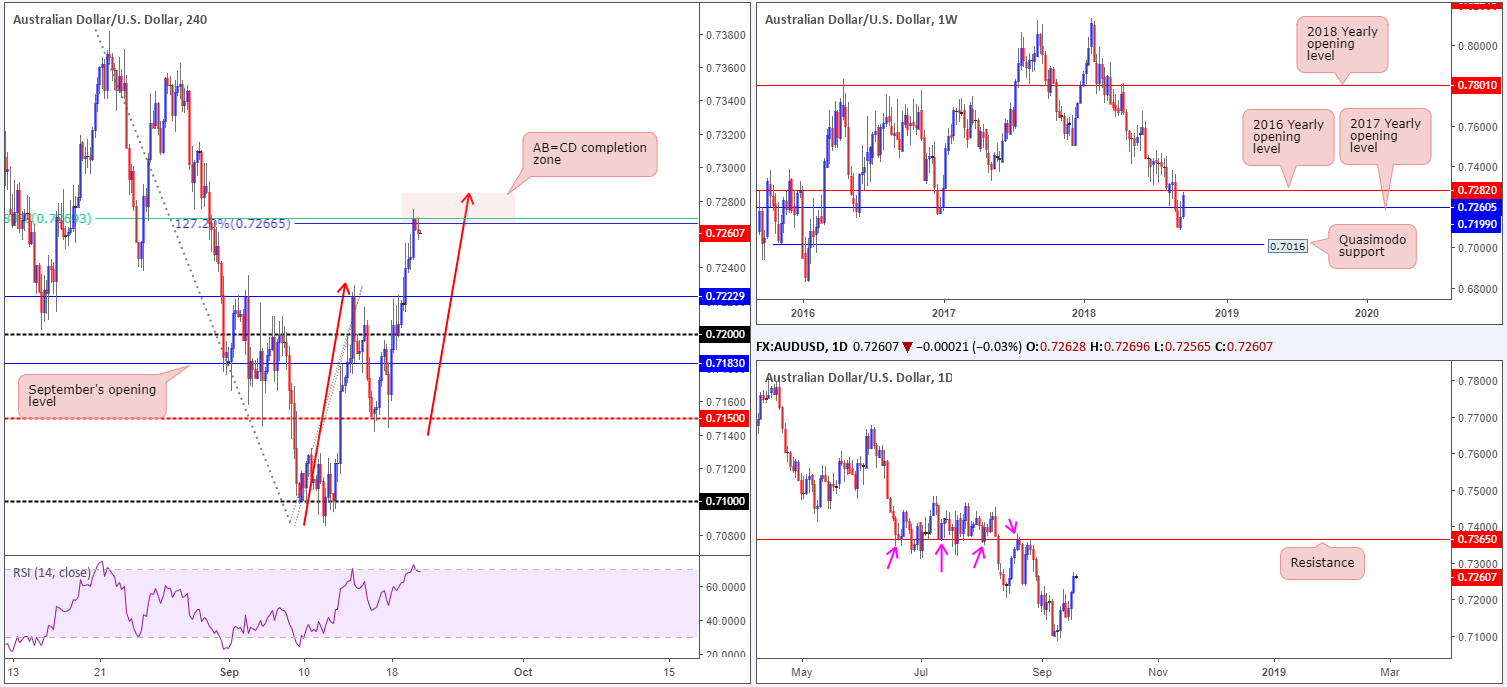
Buoyed by industrial metals and improved China sentiment, the Australian dollar printed its third consecutive gain on Wednesday vs. its US counterpart. In terms of where we stand on the weekly timeframe, price recently crossed above its 2017 yearly opening level at 0.7199 and is seen nearing the underside of the 2016 yearly opening level at 0.7282. Contrary to this, however, daily flow displays room to push as far north as a notable resistance level plotted at 0.7365.
Dovetailing nicely with the 2016 yearly opening level mentioned above at 0.7282, traders can see a H4 AB=CD approach in play that completes around the 0.7286/0.7266 neighborhood. Traders may have also noticed the AB=CD formation fuses with a 61.8% Fib resistance value at 0.7269. Should sellers respond to this zone, the next downside target from here is visible at 0.7222: a support level that’s followed closely by the 0.72 handle.
Areas of consideration:
With weekly resistance at 0.7282 seen nearby, along with aforementioned H4 structure, a move lower could be on the cards today, targeting support at 0.7222. Should a H4 bearish candlestick formation print from 0.7286/0.7266 (the pink H4 zone), a short on the back of this is certainly an option today.
Today’s data points: Philly Fed manufacturing index.
The use of the site is agreement that the site is for informational and educational purposes only and does not constitute advice in any form in the furtherance of any trade or trading decisions.
The accuracy, completeness and timeliness of the information contained on this site cannot be guaranteed. IC Markets does not warranty, guarantee or make any representations, or assume any liability with regard to financial results based on the use of the information in the site.
News, views, opinions, recommendations and other information obtained from sources outside of www.icmarkets.com.au, used in this site are believed to be reliable, but we cannot guarantee their accuracy or completeness. All such information is subject to change at any time without notice. IC Markets assumes no responsibility for the content of any linked site. The fact that such links may exist does not indicate approval or endorsement of any material contained on any linked site.
IC Markets is not liable for any harm caused by the transmission, through accessing the services or information on this site, of a computer virus, or other computer code or programming device that might be used to access, delete, damage, disable, disrupt or otherwise impede in any manner, the operation of the site or of any user’s software, hardware, data or property.


