A note on lower timeframe confirming price action…
Waiting for lower timeframe confirmation is our main tool to confirm strength within higher timeframe zones, and has really been the key to our trading success. It takes a little time to understand the subtle nuances, however, as each trade is never the same, but once you master the rhythm so to speak, you will be saved from countless unnecessary losing trades. The following is a list of what we look for:
- A break/retest of supply or demand dependent on which way you’re trading.
- A trendline break/retest.
- Buying/selling tails/wicks – essentially we look for a cluster of very obvious spikes off of lower timeframe support and resistance levels within the higher timeframe zone.
- Candlestick patterns. We tend to stick with pin bars and engulfing bars as these have proven to be the most effective.
We search for lower timeframe confirmation between the M15 and H1 timeframes, since most of our higher-timeframe areas begin with the H4. Stops are usually placed 5-10 pips beyond confirming structures.
EUR/USD:
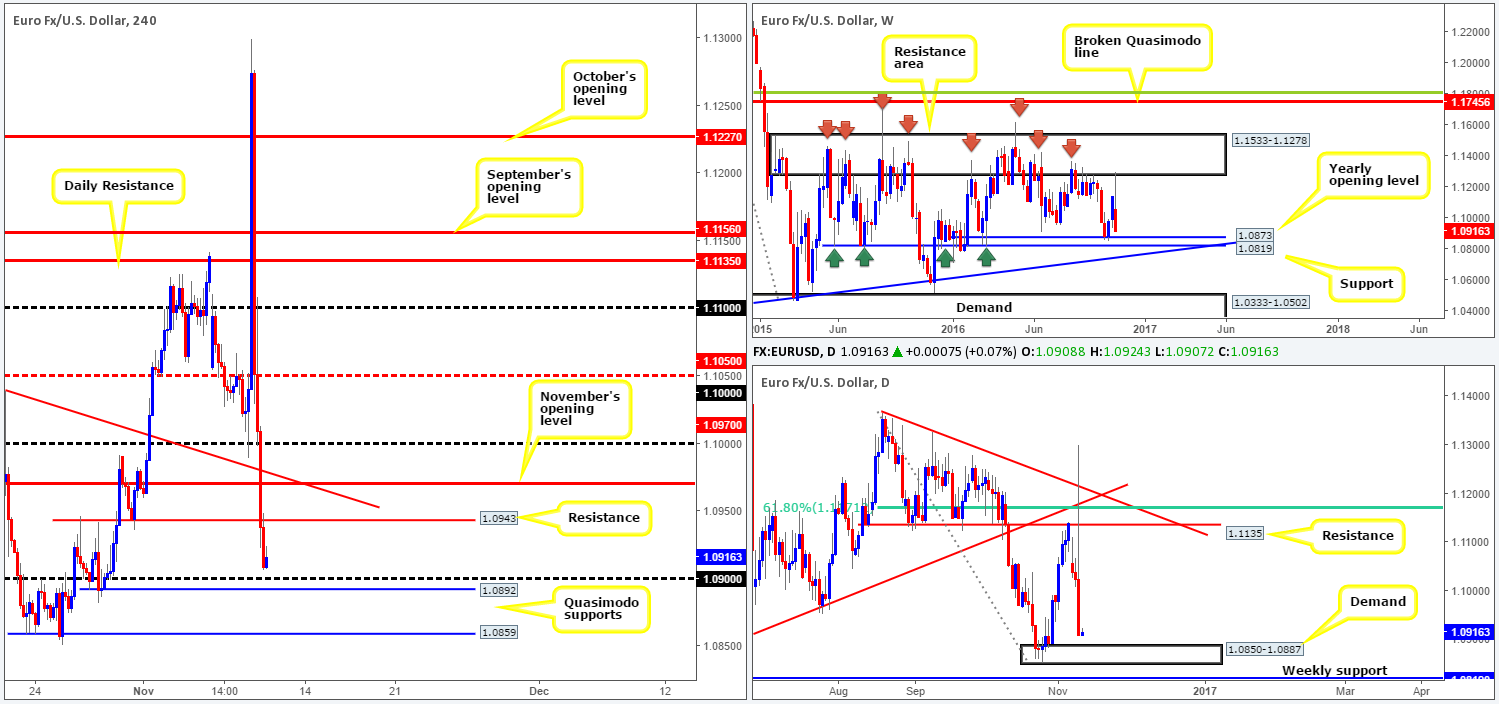
Yesterday’s action was FULL of surprises! Donald Trump was elected as the 45th President of the US. In addition, the dollar also advanced against the majority of its major trading peers, which is not something our desk was expecting in the case of a Trump win! The EUR clocked a high of 1.1299 during the event and ended the day closing nearby its daily lows at 1.0908 – a near-400-pip move! There’s clearly still a lot of uncertainty surrounding the future of the United States, and, of course, how the Fed will respond to the recent proceedings.
Ok, let’s move on to the charts. From the weekly timeframe, price stabbed the underside of a major resistance area coming in at 1.1533-1.1278 (held the market lower since May 2015), and is now seen lurking just ahead of the yearly opening level at 1.0873. Along the same vein, the daily candles are also seen hovering just above the top edge of a demand base drawn from 1.0850-1.0887. This area, as you can probably see, houses the aforementioned yearly opening level, and sits directly above a weekly support penciled in at 1.0819.
Stepping across to the H4 chart, we can see the pair trading a few pips ahead of the 1.09 handle, followed closely by a Quasimodo support at 1.0892. From current price, the next upside target can be seen at 1.0943: a resistance line that sits nearby November’s opening level at 1.0970.
Our suggestions: While 1.09 may bounce price today, the level we have interest in is the H4 Quasimodo support seen below at 1.0859. Building a case for entry here, we have the line placed deep within the current daily demand area, and is also located less than 20 pips below the yearly opening level mentioned above. Trading from 1.0859 also allows one to employ a tight stop-loss order, which, in our opinion, is best positioned below the current daily demand base at around the 1.0845ish range. Ultimately, we’d be looking to reduce risk to breakeven and take a large portion of the position off the table around the 1.09 neighborhood.
Data points to consider: US jobless claims at 1.30pm GMT.
Levels to watch/live orders:
- Buys: 1.0858 ([pending order] stop loss: 1.0845).
- Sells: Flat (stop loss: N/A).
GBP/USD:
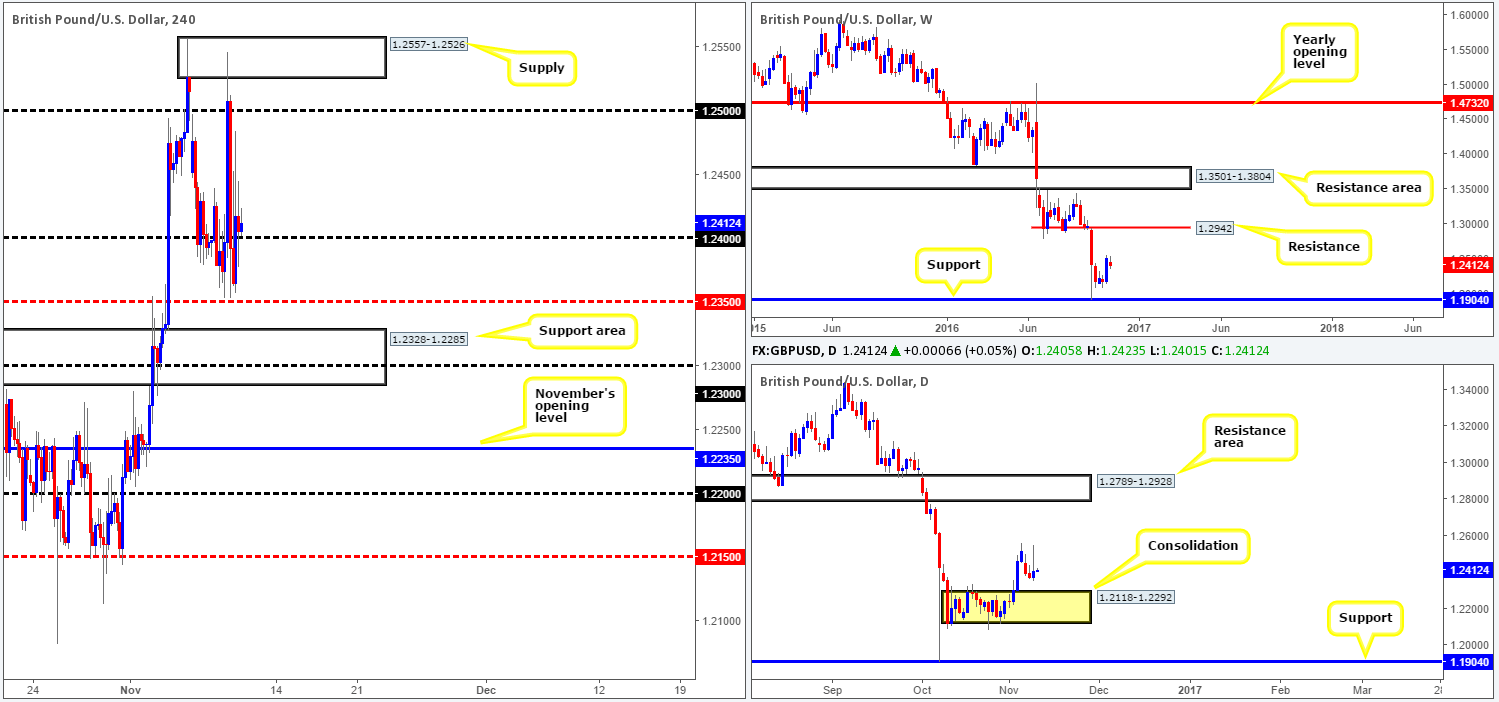
The GBP/USD pair experienced a significant amount of choppy action throughout yesterday’s US election, where the world saw Donald Trump elected as the United States 45th President. Ranging close to 200 pips on the day, the H4 candles were capped by a supply zone registered at 1.2557-1.2526 and support from just above the mid-way point 1.2350.
As our team highlighted in yesterday’s report, the 1.23 handle continues to hold appeal. The level is positioned just eight pips above the top edge of the daily range at 1.2292, as well as being situated within a H4 support area coming in at 1.2328-1.2285. Furthermore, let’s not forget that over on the monthly chart there’s a huge demand now in play between 1.0438-1.3000. This area can only be seen here due to lack of historical data:
Our suggestions: Just to be clear, our desk has absolutely no interest in trading 1.24 or the mid-way support 1.2350. 1.23 is key in our humble opinion. However, given how prone psychological hurdles are to fakeouts, we would not advise placing pending orders here. Instead, patiently wait for a reasonably sized H4 bullish candle close to form prior to pulling the trigger.
Data points to consider: US jobless claims at 1.30pm GMT.
Levels to watch/live orders:
- Buys: 1.23 region ([reasonably sized H4 bullish close required prior to pulling the trigger] stop loss: ideally beyond the trigger candle).
- Sells: Flat (stop loss: N/A).
AUD/USD:
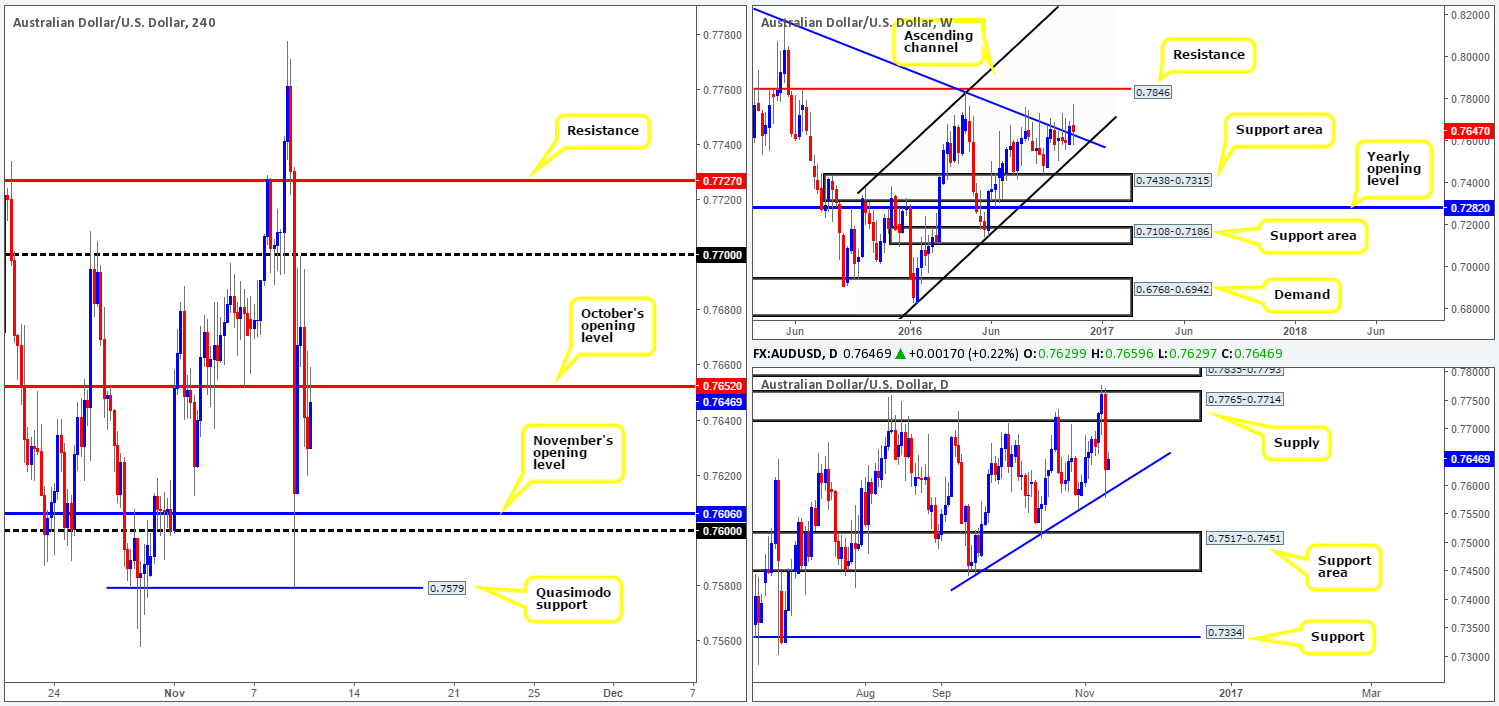
During the course of yesterday’s US election, we saw the Aussie dollar fall sharply going into the early hours of the session. This, as you can see, resulted in multiple H4 tech support levels being wiped out, and only began slowing down once the commodity currency shook hands with the H4 Quasimodo support at 0.7579. It was from here that price action begun to just as aggressively reverse tracks, and eventually touch highs of 0.7699, consequently erasing over 50% of the day’s losses.
As of this point, however, the pair is currently seen kissing the underside of October’s opening level 0.7652. Usually, our team favors these levels, but with daily action seen bouncing off the top of a daily trendline support extended from the low 0.7446 yesterday, as well as weekly price still seen lurking above the weekly trendline support drawn from 0.8295, we’re hesitant.
Our suggestions: Rather than looking to fade 0.7652, our team is, in light of where price is currently positioned over in the bigger picture (see above), now watching for a decisive close to take shape beyond this level. Should this come to fruition, our team would look to buy on any retest seen thereafter, on the condition that the retest is followed up by a reasonably sized H4 bullish close. Upside looks reasonably clear to the 0.77 handle, an ideal first take-profit target, which is shadowed closely by H4 resistance at 0.7727.
Data points to consider: US jobless claims at 1.30pm GMT.
Levels to watch/live orders:
- Buys: Watch for a decisive close above 0.7652 and then look to trade any retest seen thereafter ([reasonably sized H4 bullish close required prior to pulling the trigger] stop loss: ideally beyond the trigger candle).
- Sells: Flat (stop loss: N/A).
USD/JPY:
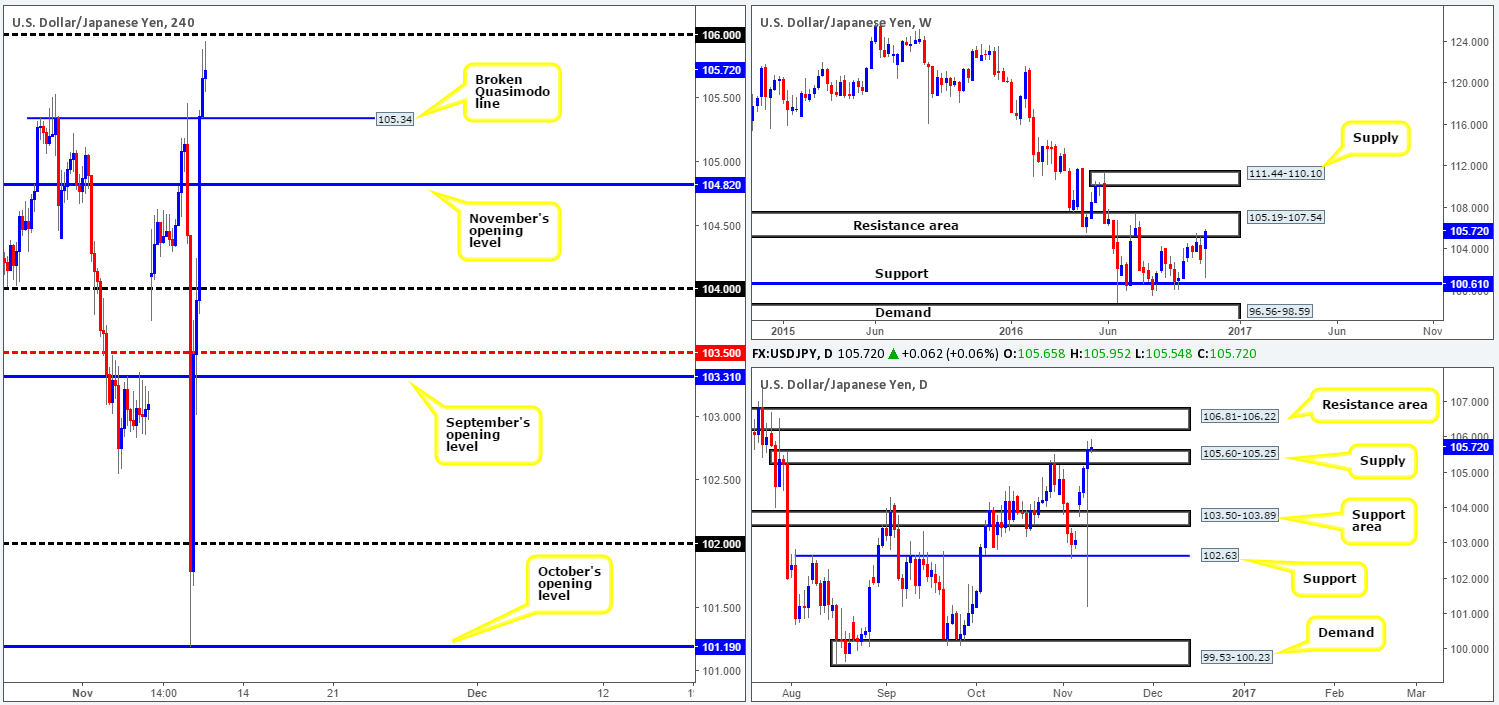
The USD/JPY began yesterday by selling off from a H4 Quasimodo resistance level at 105.34, as investors flocked to the safe-haven yen amid the US elections. Although multiple H4 supports were engulfed during this bearish assault, we saw price stabilize to-the-pip around October’s opening level at 101.19, and take back all of its earlier losses and surprisingly end the day in the green!
In that H4 price is now seen topping out just ahead of the 106 handle, how do things stand on the higher-timeframe picture? Well, over on the weekly chart, the candles continue to tease the lower edge of a resistance area coming in at 105.19-107.54. Meanwhile, down on the daily chart, the candles whipsawed through the top edge of a supply barrier coming in at 105.60-105.25, potentially opening up the possibility for prices to challenge the nearby resistance area at 106.81-106.22.
Our suggestions: The area between the 106 handle and 106.22 (the underside of the above noted daily resistance area at 106.81-106.22) is where our desk presently has their eye on. This zone – coupled with weekly price testing the lower edge of a resistance area, makes 106.22/106 a rather strong area, in our opinion. Fakeouts, however, are possible through this area, since both weekly and daily price may decide to drive deeper into their respective resistance barriers before selling off. Therefore, we’d advise waiting for a lower timeframe sell setup to form beforehand. This could be either in the form of an engulf of demand followed up by a subsequent retest as supply, a trendline break/retest or simply a collection of well-defined selling wicks around the 106 neighborhood. We search for lower timeframe confirmation between the M15 and H1 timeframes, since most of our higher-timeframe areas begin with the H4. Stops are usually placed 5-10 pips beyond confirming structures.
Data points to consider: US jobless claims at 1.30pm GMT.
Levels to watch/live orders:
- Buys: Flat (stop loss: N/A).
- Sells: 106.22/106 region ([lower timeframe confirmation required prior to pulling the trigger] stop loss: dependent on where one confirms this area).
USD/CAD:
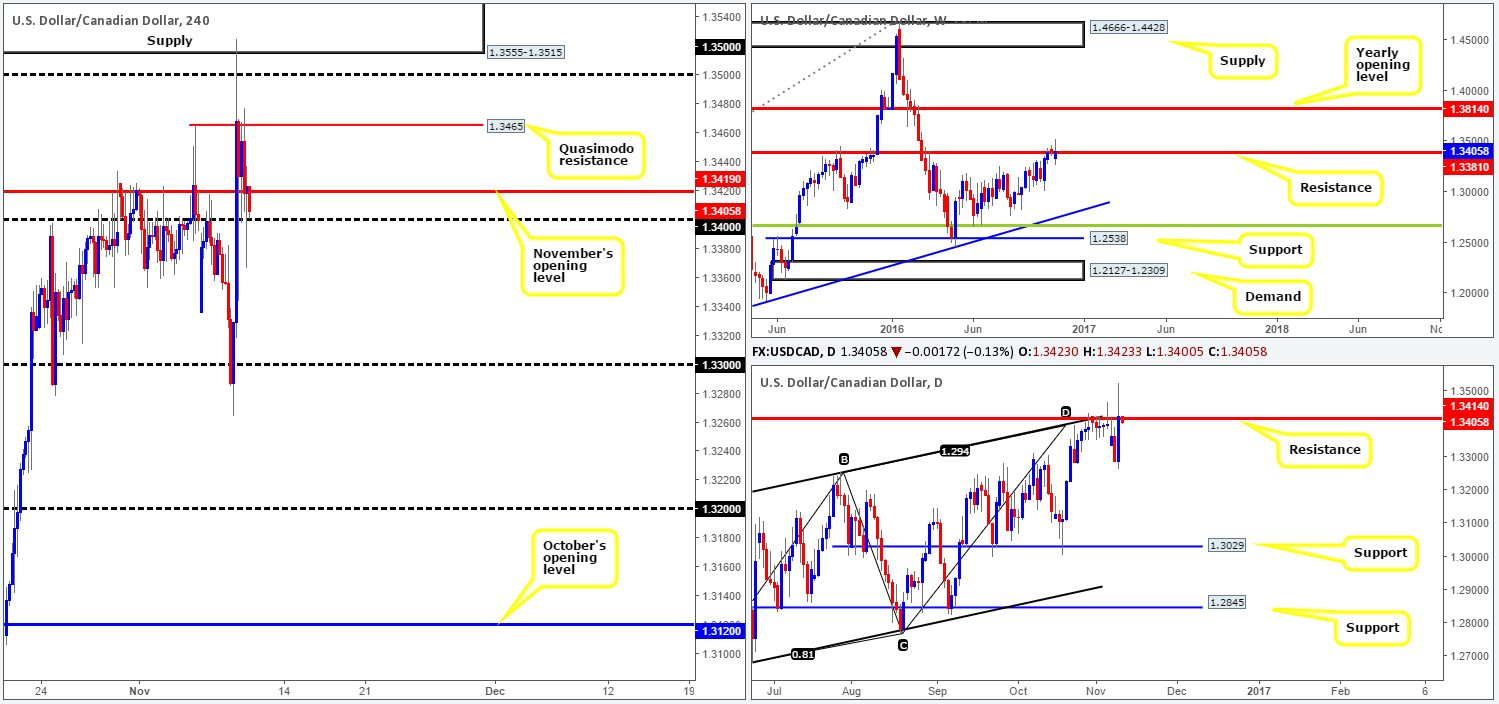
Following a rather aggressive whipsaw through the 1.33 handle in the early hours of yesterday morning, the USD/CAD was heavily bid. The US election, at that point, was well underway with polls literally neck and neck. The H4 candles shortly after, however, caught a strong offer as the world saw Donald Trump elected as the United States 45th President. After piercing through the 1.35 handle and touching base with a supply area coming in at 1.3555-1.3515, the unit ended the day shaking hands with the 1.34 handle.
With upside attempts from here being limited for now by November’s opening level at 1.3419, we feel 1.34 may be on the verge of giving way today. Not only this, but we also have to take into consideration the higher-timeframe picture. Weekly action continues to loiter around resistance at 1.3381, along with daily price seen kissing the underside of resistance at 1.3414, as well as its converging AB=CD completion point around the 1.3384ish range and a channel resistance taken from the high 1.3241.
Our suggestions: Essentially, what we’re looking for today is a firm close below 1.34, followed by a retest and a reasonably sized H4 bearish close. In the event that this comes into view, our team considers this to be a valid call to short down to 1.33, and possibly beyond given the bigger picture (see above).
Data points to consider: US jobless claims at 1.30pm GMT.
Levels to watch/live orders:
- Buys: Flat (stop loss: N/A).
- Sells: Watch for a decisive close below the 1.34 handle and look to trade any retest seen thereafter ([reasonably sized H4 bearish close required prior to pulling the trigger] stop loss: ideally beyond the trigger candle).
USD/CHF:
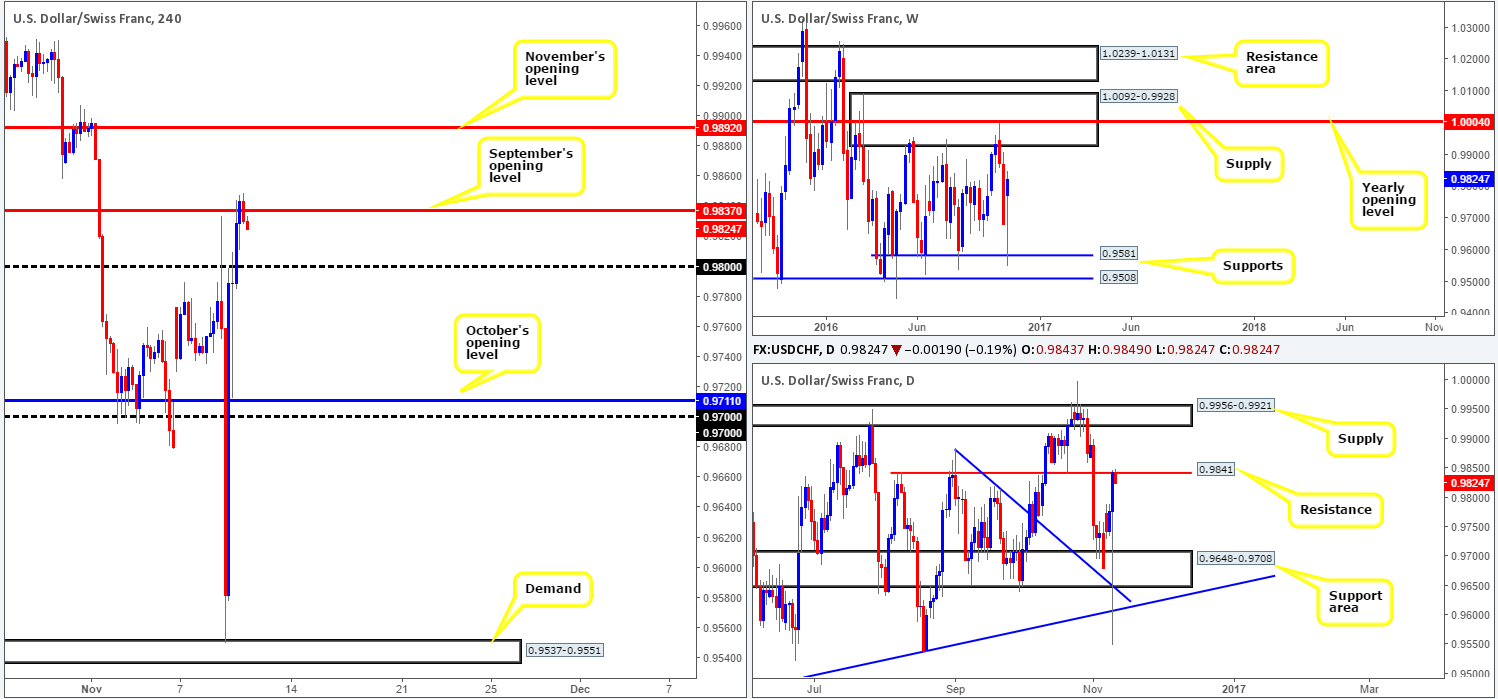
Amidst yesterday’s US election, the weekly candle spiked south to connect with support penciled in at 0.9581, which is considered, at least by our team, to be the lower edge of the current weekly range (1.0092-0.9928/0.9581). Looking down to the daily chart, yesterday’s movement saw price whipsaw through a support area at 0.9648-0.9708, and also two trendline supports (0.9884/0.9443), consequently ending the day touching gloves with resistance logged in at 0.9841.
Alongside the current daily resistance level, we can also see that H4 price is reacting to September’s opening level at 0.9837, which could force the unit to connect with the 0.98 handle. The other key thing to note here is that there’s room on the daily chart for a push down to the top edge of the support area mentioned above at 0.9708. Therefore, a firm close beyond 0.98 could portend further selling down to October’s opening level at 0.9711/0.97 handle.
Our suggestions: According to the technical structure, one could begin looking for shorts at current price. Be that as it may, we would prefer waiting for a close beyond 0.98 as the distance between September’s opening level to 0.98 is limited. On the assumption that our analysis is correct, and price closes below 0.98, watch for price to retest 0.98 as resistance. A retest that holds ground is, in our book, sufficient enough to condone a short entry in this market, ultimately targeting the 0.97 neighborhood. \
Data points to consider: US jobless claims at 1.30pm GMT.
Levels to watch/live orders:
- Buys: Flat (stop loss: N/A).
- Sells: Watch for a close beyond 0.98 and look to trade the retest of this number as resistance ([wait for the retesting candle to close bearishly before pulling the trigger] stop loss: ideally beyond the trigger candle).


