Key risk events today:
OPEC Meetings; BoC Business Outlook Survey.
(Previous analysis as well as outside sources – italics).
EUR/USD:
Weekly gain/loss: -2.93%
Weekly close: 1.0806
Weekly perspective:
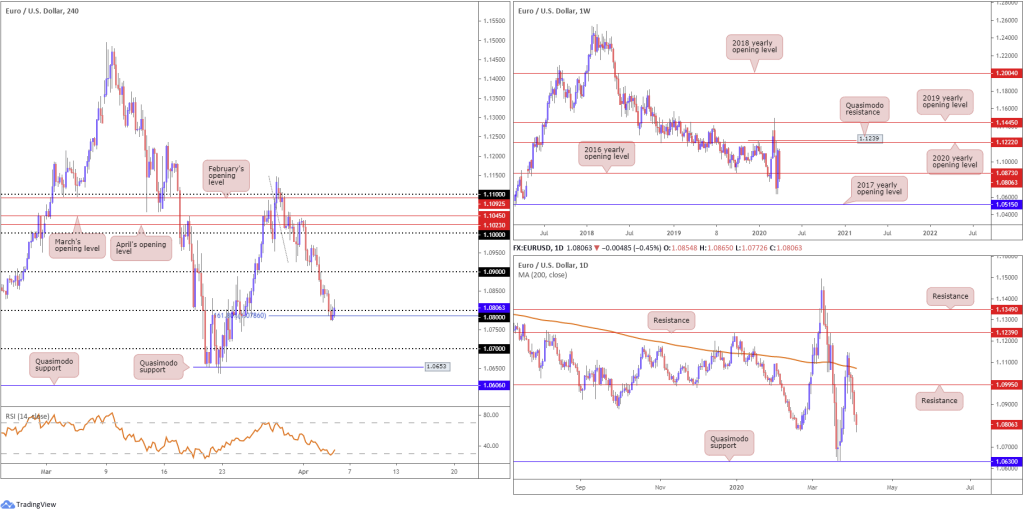
Despite an impressive recovery off multi-year lows at 1.0635, price failed to build on recent gains last week. Leaving Quasimodo resistance at 1.1239 and the 2020 yearly opening level at 1.1222 unchallenged, long-term flow made its way back through the 2016 yearly opening level at 1.0873, closing in the form of a near-full bodied bearish candle, potentially setting the stage for a run to 1.0635 this week, followed by the 2017 yearly opening level 1.0515.
Daily perspective:
The 200-day SMA (orange – 1.1071) delivered a relatively firm ceiling at the beginning of the week, breaching support at 1.0995, in spite of price action producing a healthy hammer candlestick pattern (generally considered a bullish signal at troughs) on Tuesday.
Four out of the five trading days formed reasonably dominant bearish candles, with the unit threatening to take a run at Quasimodo support drawn from 1.0630 this week.
H4 perspective:
Friday’s jobs report revealed the US economy lost 701k jobs in March, far exceeding the 100k expectation. The unemployment rate was similarly downbeat, up 4.4% vs. 3.5% the month prior. What’s also notable is the Labour Department has yet to account for the 10 million Americans who filed for unemployment insurance in recent weeks.
Technical chart studies show the US dollar index concluded the week in firm territory, though mildly pared gains at the tail end of the week off 100.85. Still, the benchmark remains resolute north of 100.00, likely to approach 101.00 sometime this week.
As the relative strength index (RSI) shakes hands with oversold ground on EUR/USD, the 161.8% Fibonacci extension point at 1.0786 along with the 1.08 handle elbowed their way into the spotlight towards the closing stages of the week. A break south of this region shows limited support until reaching a Quasimodo formation at 1.0653, sited south of the 1.07 psychological boundary.
Areas of consideration:
The rebound from 1.08ish is interesting, though could falter in light of the recent close, albeit marginal, beneath the 2016 yearly opening level on the weekly timeframe at 1.0873. In addition, traders will note the lack of daily support until reaching 1.0630.
On account of the above, a violation of 1.08 is likely on the cards this week, unlocking the door for bearish scenarios towards 1.07 and H4 Quasimodo support at 1.0653. Conservative traders may seek additional confirmation in the form of a retest setup at the underside of 1.08 before pulling the trigger.
GBP/USD:
Weekly gain/loss: -1.49%
Weekly close: 1.2263
Weekly perspective:
Sterling reverted to a mild defensive play over the course of recent movement, a week after a near-7% advance off lows at 1.1409, levels not seen since 1985.
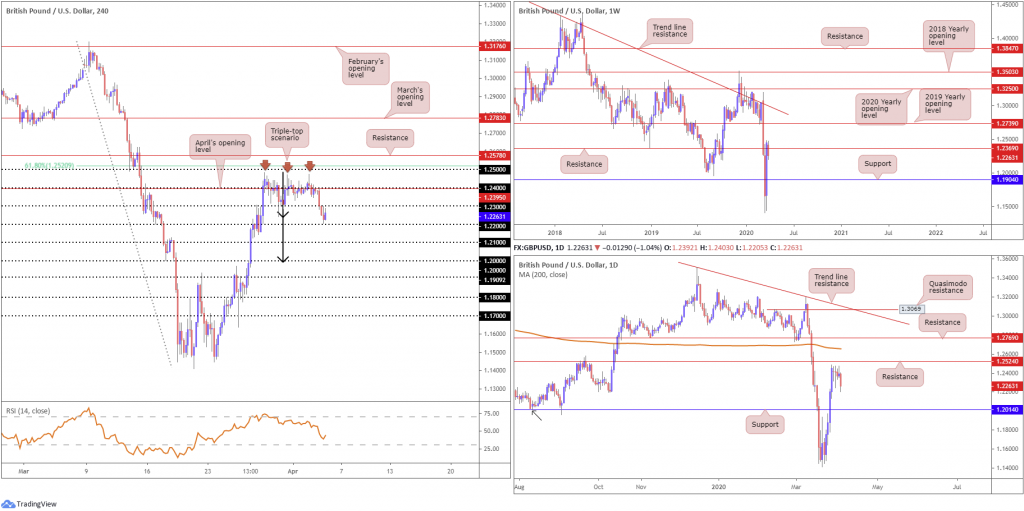
Down more than 180 points, longer-term flow dipped its toe in waters south of resistance at 1.2369, with the possibility of follow-through moves materialising this week to support priced in at 1.1904. The next upside target beyond 1.2369, on the other hand, falls in around the 2019 yearly opening level at 1.2739, with a break exposing long-term trend line resistance, taken from the high 1.5930.
Daily perspective:
Nothing really standout is visible on the daily timeframe as price action spent the majority of the week echoing a muted tone south of resistance at 1.2524 – that is, of course, until Friday’s bearish close of nearly 1%. This follows Thursday’s shooting star candlestick pattern (considered a bearish signal at peaks).
The week’s close may entice further selling this week, leading to support at 1.2014 making an appearance, which, interestingly, was a former Quasimodo formation with the left shoulder derived from August 2019 (black arrow).
H4 perspective:
Following the formation of a triple-top pattern around 1.2476ish, sited just beneath the 1.25 handle and a 61.8% Fibonacci retracement at 1.2520, cable overpowered 1.23 in the early hours of London Friday amid continued demand for the buck, despite dismal US employment data.
H4 price established support ahead of 1.22 in US trade, poised to potentially revisit the underside of 1.23 in the early stages of this week. The break of the lowest trough within the aforementioned triple-top pattern (1.2241) has confirmed the formation as a potential contender for shorts this week, with a take-profit target (measured by taking the value between the highest peak to the lowest trough and adding this to the breakout point) set around the key figure 1.20 (black arrows).
Areas of consideration:
Having noted weekly movement garnering resistance from 1.2369 as well as daily price displaying room to stretch lower to support at 1.2014, the triple-top H4 pattern could complete this week, given the formation’s take profit target resides a touch beneath daily support at 1.20.
Technically, therefore, traders will likely favour short-selling upside corrections this week, from 1.23 and 1.24, with the latter holding April’s opening level close by at 1.2395.
AUD/USD:
Weekly gain/loss: -2.83%
Weekly close: 0.5990
Weekly perspective:
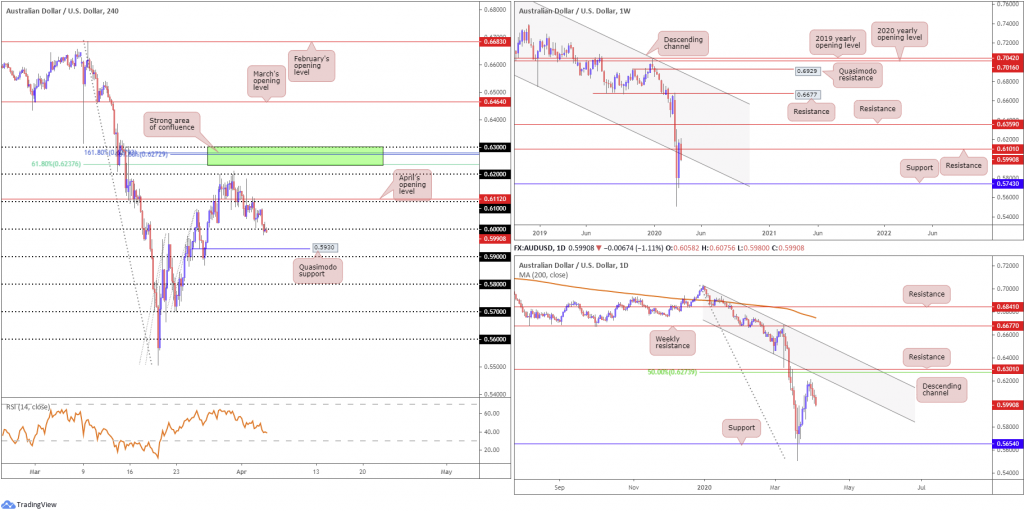
Sellers strengthened their grip over the course of the week, holding the majority of losses into the close. Undermined by the US dollar’s pronounced advance, traders watched long-term flow cross swords with resistance at 0.6101, aligning closely with a channel support-turned resistance, coming in from the low 0.6744.
Paring approximately 40% of the prior week’s gains, support at 0.5743 could be in the offing this week, a level with history dating as far back as September 1998.
Daily perspective:
Leaving resistance at 0.6301 unopposed, Tuesday fashioned an outside bearish day pattern off weekly peaks at 0.6213. This absorbed nearby bids and guided AUD/USD to lows at 0.5980, registering its fourth successive daily decline. Although this may prompt further losses this week, particularly as limited support is visible on the daily timeframe until reaching 0.5654, traders are urged to pencil in channel support-turned resistance, extended from the low 0.6433, closely trailed by the noted resistance at 0.6301 and a 50.0% retracement ratio carved in at 0.6273.
H4 perspective:
Intraday action, based on the H4 timeframe, maintained its offered tone close by weekly lows Friday, unable to glean any respite from less-than-stellar US employment data.
The key figure 0.60 made a showing mid-way through London, but prompted little to the upside. In fact, latest candle action exhibited a relatively strong selling wick, suggesting a move to Quasimodo support at 0.5930 could be in store, closely followed by 0.59.
Areas of consideration:
Although more of a decisive close sub 0.60 is likely needed before traders deem the H4 timeframe fit for bearish themes, the fact we’re coming from weekly resistance at 0.6101/channel support-turned resistance as well as plenty of room seen to manoeuvre lower on the daily timeframe, some traders may seek short sales in early trade this week, targeting the noted H4 support levels.
USD/JPY:
Weekly gain/loss: +0.44%
Weekly close: 108.38
Weekly perspective:
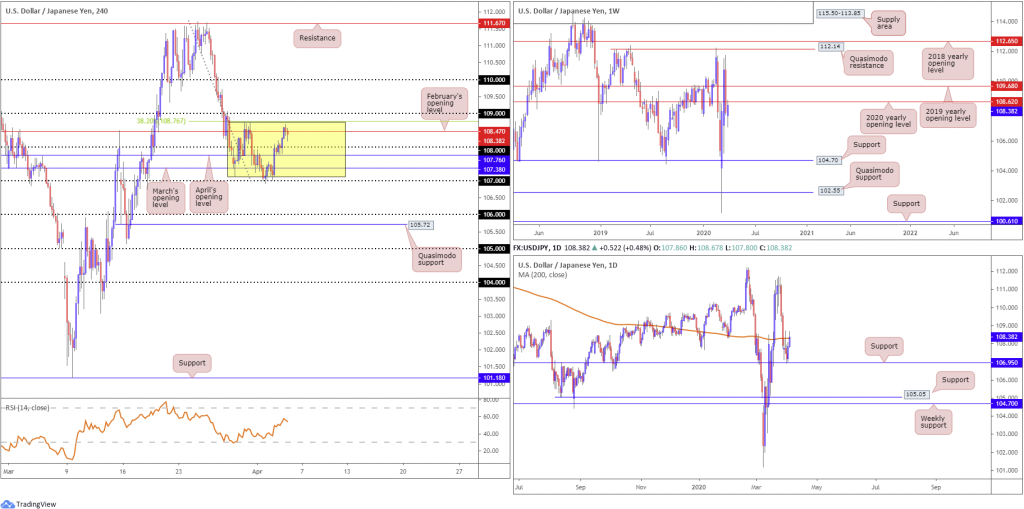
After a pivotal correction off peaks, formed south of Quasimodo resistance at 112.14, submerged the 2019 yearly opening level at 109.68 and the 2020 yearly opening level at 108.62, USD/JPY registered a modest recovery trough off 106.92 last week and is seen retesting the underside of 108.62 into the close.
Sustained downside on this timeframe is free to navigate lower until touching gloves with a familiar area of support coming in at 104.70, while further recovery could see the 2019 yearly opening level at 109.68 re-emerge.
It might also interest some traders to note 104.70 denotes the lower boundary of a multi-month range between Quasimodo resistance mentioned above at 112.14.
Daily perspective:
A closer reading of price action on the daily timeframe recently saw the pair ricochet from support at 106.95 and test its 200-day SMA at 108.31.
Beyond the SMA value, there’s not really much to hang our hat on in terms of nearby resistance, therefore most traders will likely fix their crosshairs on the 2020 yearly opening level at 108.62 sited on the weekly timeframe. Yet, beneath 106.95, support can be found at 105.05, positioned a touch above weekly support at 104.70.
H4 perspective:
Ultimately, the aftermath of Friday’s US employment data provided little impetus as H4 candles hover a few points beneath the upper boundary of a reasonably defined consolidation between 107.13/108.74. Note also the upper edge is bolstered by a 38.2% Fibonacci retracement at 108.76 and February’s opening level sited at 108.47.
Inside the walls of the current range we can also see March and April’s opening levels at 107.38 and 107.76, respectively, and the 108 handle.
Outside of the walls, 109 resides close by as resistance along with 107 and 106 as support.
Areas of consideration:
The top edge of the H4 range around 108.74 is likely of interest to sellers today/early week, given it merges nearby a 38.2% Fibonacci retracement at 108.76 and February’s opening level at 108.47 on the H4. What’s also notable is the 200-day SMA at 108.30ish and the 2020 yearly opening level at 108.62. Collectively, this is formidable resistance. However, there is a chance traders may witness a fakeout to 109 before sellers step in.
USD/CAD:
Weekly gain/loss: +1.62%
Weekly close: 1.4196
Weekly perspective:
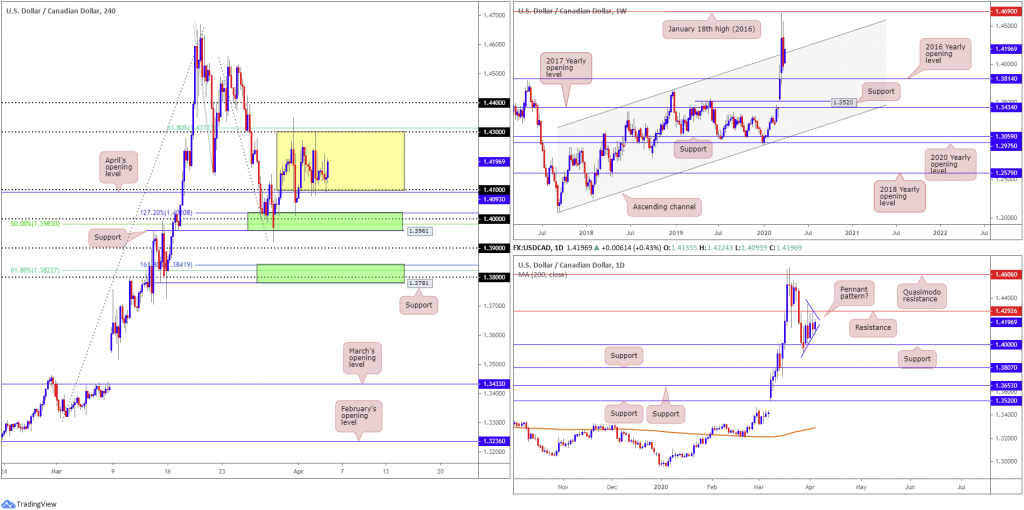
USD/CAD is seen attempting to secure ground above channel resistance, extended from the high 1.3661, despite a sizeable move to the downside in recent trading. Further buying from this point has January 18th high at 1.4690 (2016) to target, whereas moves lower could draw in support at the 2016 yearly opening level from 1.3814.
Daily perspective:
A closer examination of price action on the daily timeframe reveals the candles remain somewhat confined between resistance at 1.4292 and support coming in at 1.4000, with the former welcoming more of the action last week.
Additional support is seen at 1.3807, in the event we push for lower levels, while a jump higher has eyes for Quasimodo resistance at 1.4606.
Pattern traders will also note the possible pennant formation (1.4349/1.4011), generally considered a continuation pattern. However, until this area witnesses a decisive breakout it’s difficult to trade.
H4 perspective:
Since the beginning of the week, H4 price has been involved in the construction of a reasonably well-defined consolidation (yellow) between 1.43 (supported closely by a 61.8% Fibonacci retracement at 1.4313) and 1.41 (bolstered closely by April’s opening level at 1.4093).
Outside of the current range, 1.44 may offer resistance, while to the downside an interesting area of support resides at 1.3961-1.4020 (upper green zone), made up of a 127.2% Fibonacci extension base at 1.4020, the round number 1.40, a 50.0% retracement at 1.3983 and support coming in at 1.3961.
Another potential base of support can be seen around 1.3781-1.3841 (lower green), comprised of support at 1.3781, the 1.38 handle, a 61.8% Fibonacci retracement at 1.3822 and a 161.8% Fibonacci extension point at 1.3841.
Areas of consideration:
Range traders may attempt to engage between H4 range limits 1.41/43 this week; do remain aware that this consolidation is in the early stages of forming therefore the likelihood of a whipsaw being seen is certainly there. Waiting for a H4 candlestick pattern to form before engaging can help avoid this.
A break of 1.41 will likely land price back within 1.3961/1.4020, which could offer a ‘floor’ this week, knowing the area houses daily support at 1.4000.
A breach of 1.43, on the other hand, may look for 1.44 as an upside target.
USD/CHF:
Weekly gain/loss: +2.63%
Weekly close: 0.9758
Weekly perspective:
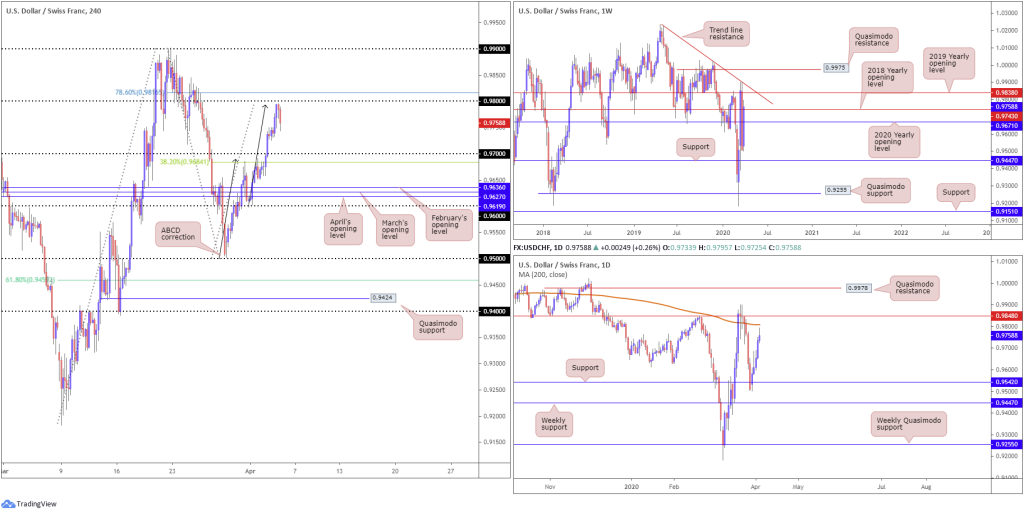
A pick up in USD demand lifted USD/CHF northbound last week, resulting in price crossing swords with the 2018 yearly opening level at 0.9743. A break of here shines the spotlight on the 2019 yearly opening level at 0.9838 and trend line resistance, etched from the high 1.0236; a rejection, however, could materialise into a substantial sell-off as the river south, assuming we get past the 2020 yearly opening level at 0.9671, is clear until support at 0.9447.
Daily perspective:
Off support at 0.9542, shaped by way of five consecutive bullish candles, price action is seen fast approaching the 200-day SMA value at 0.9808. North of here has resistance from 0.9848, boasting moderately healthy history as an S/R level, with Quasimodo resistance at 0.9978 in the offing should we press for higher levels this week.
H4 perspective:
Friday, particularly in the early stages of the session, maintained its bid tone as the buck’s demand remained unabated post-US employment.
USD/CHF, however, did pivot lower ahead of the 0.98 handle in the hours leading up to the close, responding to an ABCD bearish completion (black arrows) at 0.9794, with the possibility of further dips to 0.97, shadowed by the 38.2% Fibonacci retracement at 0.9684 (a traditional take-profit target out of ABCD formations).
Areas of consideration:
For those who read Friday’s technical briefing you may recall the following piece –
The 0.98 handle on the H4 timeframe, coupled with a potential ABCD bearish correction and a 78.6% Fibonacci retracement at 0.9816, as well as the 200-day SMA value at 0.9808, could collectively send USD/CHF lower if tested today. This would, however, entail whipsawing above weekly resistance at 0.9744, though a 50-point whipsaw is considered reasonably minor on the weekly scale, therefore is certainly a possibility.
Although many may have missed the move lower, likely due to a combination of waiting for at least 0.98 to enter the fold and the fear of holding a position over the weekend, a retest at 0.98ish is still not out of the question in early trade today. This is largely because Friday’s pullback could simply be traders covering long positions into the week’s close.
Therefore, 0.9816/0.9794 remains a valid resistance zone this week.
Dow Jones Industrial Average:
Weekly gain/loss: -2.18%
Weekly close: 21059
Weekly perspective:
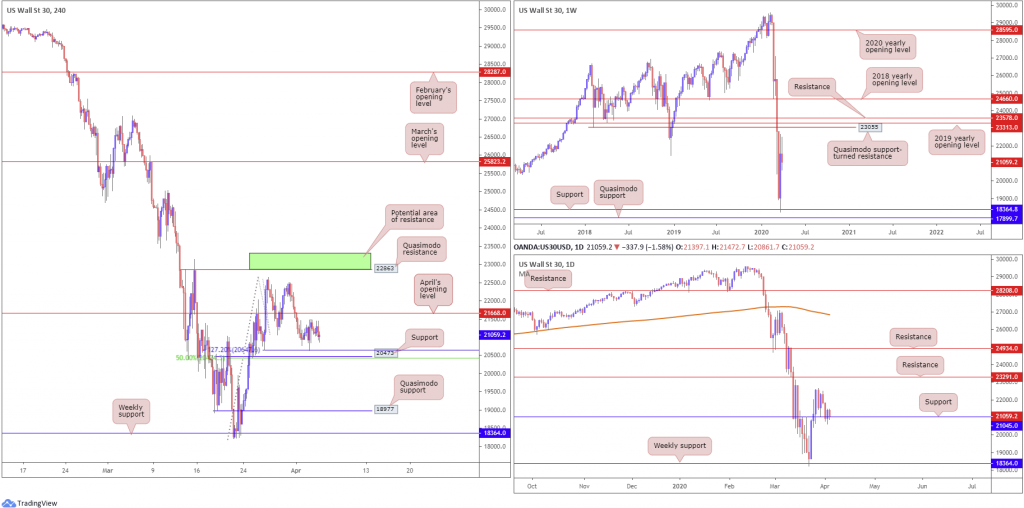
Price movement on the weekly timeframe continued to languish beneath Quasimodo support-turned resistance at 23055 last week, following a recent recovery off support at 18364.
Technical structure also notes resistance can be seen at the 2019 yearly opening level from 23313 and also at 23578, whereas Quasimodo support is sited just south of support at 17899.
Daily perspective:
Support at 21045 remains a feature on the daily timeframe right now, but has so far generated little to the upside. A break beneath here could also be considered an early cue we’re headed for weekly support mentioned above at 18364 this week.
H4 perspective:
US equities concluded Friday lower as investors digested dismal US employment figures, echoing the ongoing concerns surrounding the coronavirus pandemic. The Dow Jones Industrial Average lost 360.91 points, or 1.69%; the S&P 500 also erased 38.25 points, or 1.51%, and the tech-heavy Nasdaq 100 concluded lower by 107.54 points, or 1.41%.
Technicians on the H4 timeframe will note the 127.2% Fibonacci extension at 20647 entered the fold Thursday, which represents the top base of a support area, comprised of support coming in at 20473 and a 50.0% retracement at 20433.
The rebound from 20433/20647 produced a nice-looking bullish outside candlestick formation, though failed to spark moves higher Friday, with price poised to potentially retest 20433/20647 in early trade this week. To the upside, aside from April’s opening level at 21668, tops are sited around 22500, followed by Quasimodo resistance at 22863.
Reinforcing the noted H4 support area is daily support mentioned above at 21045.
Areas of consideration:
Buying from current price, knowing the unit is effectively bolstered by H4 and daily confluence, is still a possibility this week; however, most will likely seek a H4 close north of April’s opening level at 21668 prior to committing.
H4 Quasimodo resistance at 22863 also represents a healthy level this week, owing to daily resistance merging closely at 23291 and weekly resistance at 23055 (H4 green zone). As such, not only does this represent an upside target for the week, it is also considered a considerable reversal zone.
XAU/USD (GOLD):
Weekly gain/loss: -0.60%
Weekly close: 1616.4
Weekly perspective:
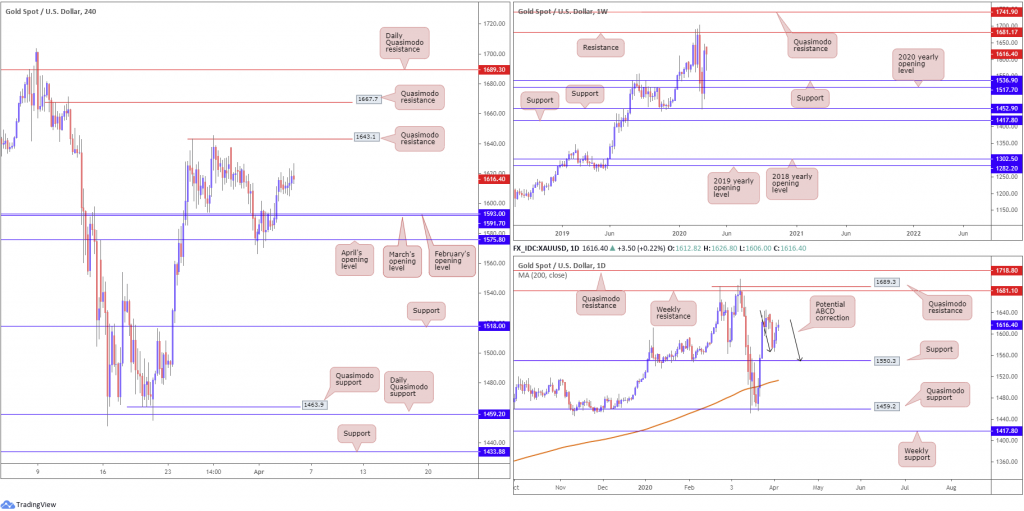
Adding nearly $130, demand for the yellow metal intensified in recent weeks, consequently clawing back a large portion of lost ground. Conquering resistance at 1536.9 (now a serving support) and the 2020 yearly opening level at 1517.7, focus has shifted to resistance at 1681.1, with a break exposing Quasimodo resistance at 1741.9.
Daily perspective:
The technical story on the daily timeframe has support lurking around 1550.3, with the said weekly resistance at 1681.1 posted to the upside, followed by daily Quasimodo resistance at 1689.3. Daily price structure also notes a possible ABCD bullish correction that terminates around the said daily support (black arrows), along with the 200-day SMA (orange – 1512.9) seen drifting towards current support.
H4 perspective:
Friday witnessed limited movement, ranging no more than $4.
March and February’s opening levels at 1591.7/1593.0 remain reasonably dominant fixtures on this scale as support, while to the upside a shallow Quasimodo resistance is seen at 1643.1, followed by another layer of Quasimodo resistance at 1667.7.
Areas of consideration:
Off April’s opening level at 1575.8, Thursday’s breakout above 1591.7/1593.0 on the H4 timeframe, coupled with the weekly timeframe showing room for higher prices, may arouse intraday buyer interest, with the majority likely favouring entry on a retest of 1591.7/1593.0, targeting noted H4 Quasimodo resistances.
Conservative traders will likely seek additional confirmation at 1591.7/1593.0 in order to help avoid a potential whipsaw. This could be something as simple as a bullish candlestick pattern, such as a hammer or engulfing formation.
The accuracy, completeness and timeliness of the information contained on this site cannot be guaranteed. IC Markets does not warranty, guarantee or make any representations, or assume any liability regarding financial results based on the use of the information in the site.
News, views, opinions, recommendations and other information obtained from sources outside of www.icmarkets.com.au, used in this site are believed to be reliable, but we cannot guarantee their accuracy or completeness. All such information is subject to change at any time without notice. IC Markets assumes no responsibility for the content of any linked site.
The fact that such links may exist does not indicate approval or endorsement of any material contained on any linked site. IC Markets is not liable for any harm caused by the transmission, through accessing the services or information on this site, of a computer virus, or other computer code or programming device that might be used to access, delete, damage, disable, disrupt or otherwise impede in any manner, the operation of the site or of any user’s software, hardware, data or property.


