A note on lower timeframe confirming price action…
Waiting for lower timeframe confirmation is our main tool to confirm strength within higher timeframe zones, and has really been the key to our trading success. It takes a little time to understand the subtle nuances, however, as each trade is never the same, but once you master the rhythm so to speak, you will be saved from countless unnecessary losing trades. The following is a list of what we look for:
- A break/retest of supply or demand dependent on which way you’re trading.
- A trendline break/retest.
- Buying/selling tails – essentially we look for a cluster of very obvious spikes off of lower timeframe support and resistance levels within the higher timeframe zone.
- Candlestick patterns. We tend to only stick with pin bars and engulfing bars as these have proven to be the most effective.
For us, lower timeframe confirmation starts on the M15 and finishes up on the H1, since most of our higher timeframe areas begin with the H4. Stops usually placed 5-10 pips beyond your confirming structures.
EUR/USD:
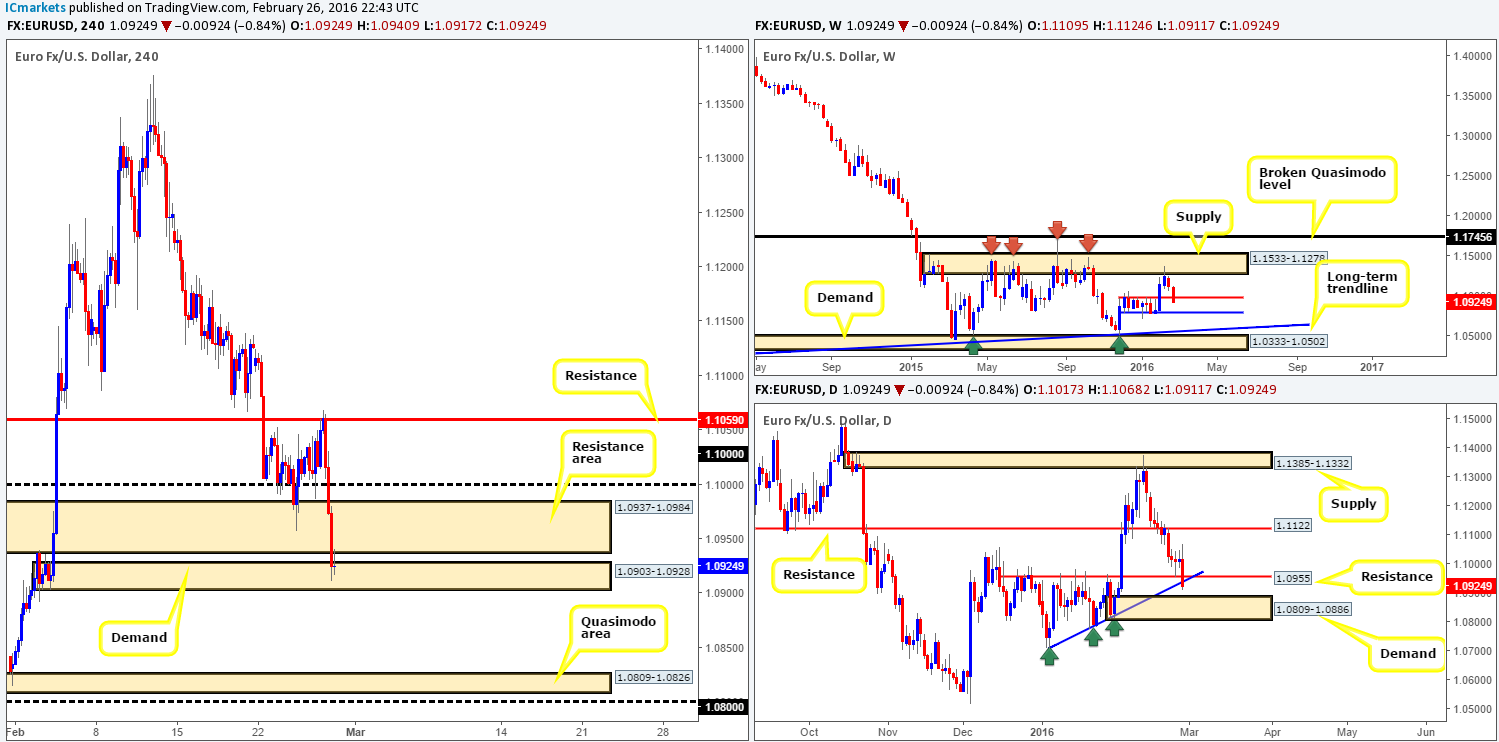
The past week saw the single currency decline a further 200 pips into the close 1.0924, resulting in a rather vicious full-bodied bearish weekly candle forming. Consequent to this, weekly support (now acting resistance) at 1.0983 was taken out, thus opening up the possibility for further downside this week to weekly support penciled in at 1.0796.
Climbing down into the pits of the daily chart, one can see that the week ended closing below both support drawn from 1.0955 and a trendline support extended from the low 1.0711. In view of this, there is a strong possibility that the demand zone at 1.0809-1.0886 will be the next target in the firing range this week. Should price reach this area, we highly anticipate a bounce since the weekly support at 1.0796 is seen bolstering this zone from just below.
Moving in a little closer to the action, the H4 chart shows that the market (backed by a positive U.S GDP number on Friday) responded beautifully to resistance coming in at 1.1059. This, as you can see, dragged the pair through both the large psychological support 1.1000 and also the huge support area chalked up at 1.0937-1.0984, before stabilizing around demand fixed at 1.0903-1.0928 by the week’s end.
In light of the higher-timeframe action (see above in bold), and the fact that there is now a large area of resistance overshadowing the current H4 demand, the most we’re expecting from here is a small intraday bounce at best today.
If our analysis is correct, price should push below this area which would likely set the stage for a continuation move towards the Quasimodo support area at 1.0809-1.0826. To trade this move, we’d need a retest to the underside of the current demand as supply followed by a lower timeframe sell signal. However, caution is still advised here since let’s not forget that even though the weekly’s downside path is clear, the top-side of daily demand at 1.0886 could potentially halt selling here.
In regards to buying this pair this week, the only place we feel would give a big enough bounce to the upside would be the aforementioned H4 Quasimodo area. Not only is it lodged within the extremes of daily demand, but it also sits just above both weekly support (see above for levels) and also psychological support 1.0800. Therefore, there is likely going to be a fakeout seen below the H4 area before buyers step in, as such, we would recommend waiting for the lower timeframes to confirm buying strength exists before risking capital here.
Levels to watch/live orders:
- Buys: 1.0809-1.0826 [Tentative – confirmation required] (Stop loss: dependent on where one confirms this area).
- Sells: Watch for bids to be consumed at 1.0903-1.0928 and look to trade any retest seen thereafter (lower timeframe confirmation required).
GBP/USD:
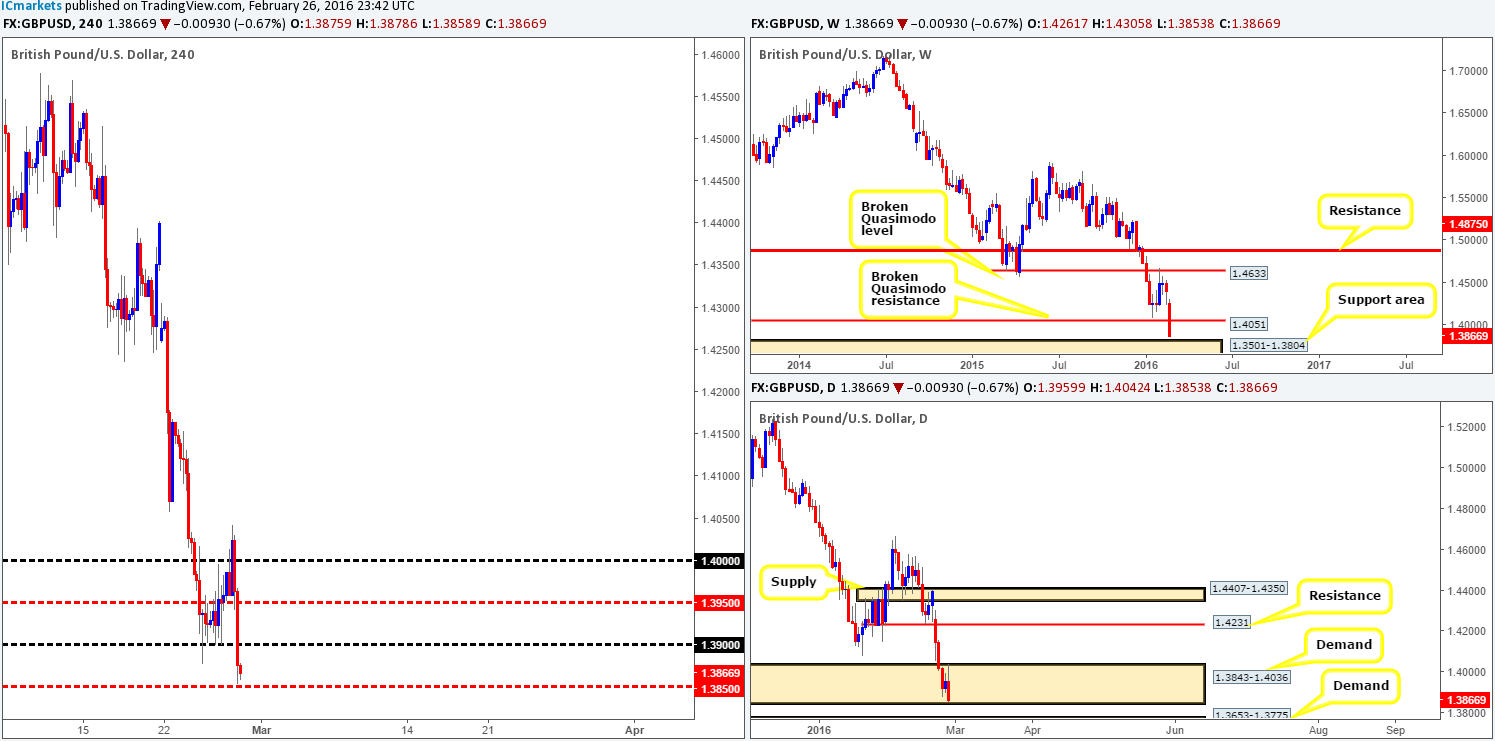
Largely due to fears surrounding a possible Brexit from the E.U., Pound Sterling sustained further losses for a second straight week, consequently erasing over 500 pips. Because of this, the weekly Quasimodo support at 1.4051 was annihilated, leaving Cable closing the week (1.3866) just ahead of a major area of weekly support at 1.3501-1.3804. This barrier has capped downside within this market since mid-2001, so it would be surprising not to see this pair find active buyers here.
Despite the recent selling, daily action remains trading within demand formed at 1.3843-1.4036. Nevertheless, the bulls appear to be struggling to find a foothold here as is evident from Friday’s bearish engulfing candle. To our way of seeing things, a better area to be looking for longs this week would be the demand below it at 1.3653-1.3775, since it fuses nicely with the large weekly support area mentioned above at 1.3501-1.3804.
As can be seen from the H4 chart, Friday saw the pair sell-off following positive numbers from the U.S GDP, closing the week out just ahead of mid-level support at 1.3850. Technically, we do not see this pair finding strong support until we reach the 1.3800 region. Reason being is that this number is backed by the top-side of the weekly support zone at 1.3804, and is also sitting just above daily demand at 1.3653-1.3775. Therefore, do keep a tab on this number for a possible long opportunity this week.
In addition to this, should the GBP retest the 1.3900 figure as resistance today – a confirmed sell trade from here could be possible (with lower timeframe confirmation), targeting the 1.3800 region.
Levels to watch/live orders:
- Buys: 1.3800 [Tentative – confirmation required] (Stop loss: dependent on where one confirms this level).
- Sells: 1.3900 [Tentative – confirmation required] (Stop loss: dependent on where one confirms this level).
AUD/USD:
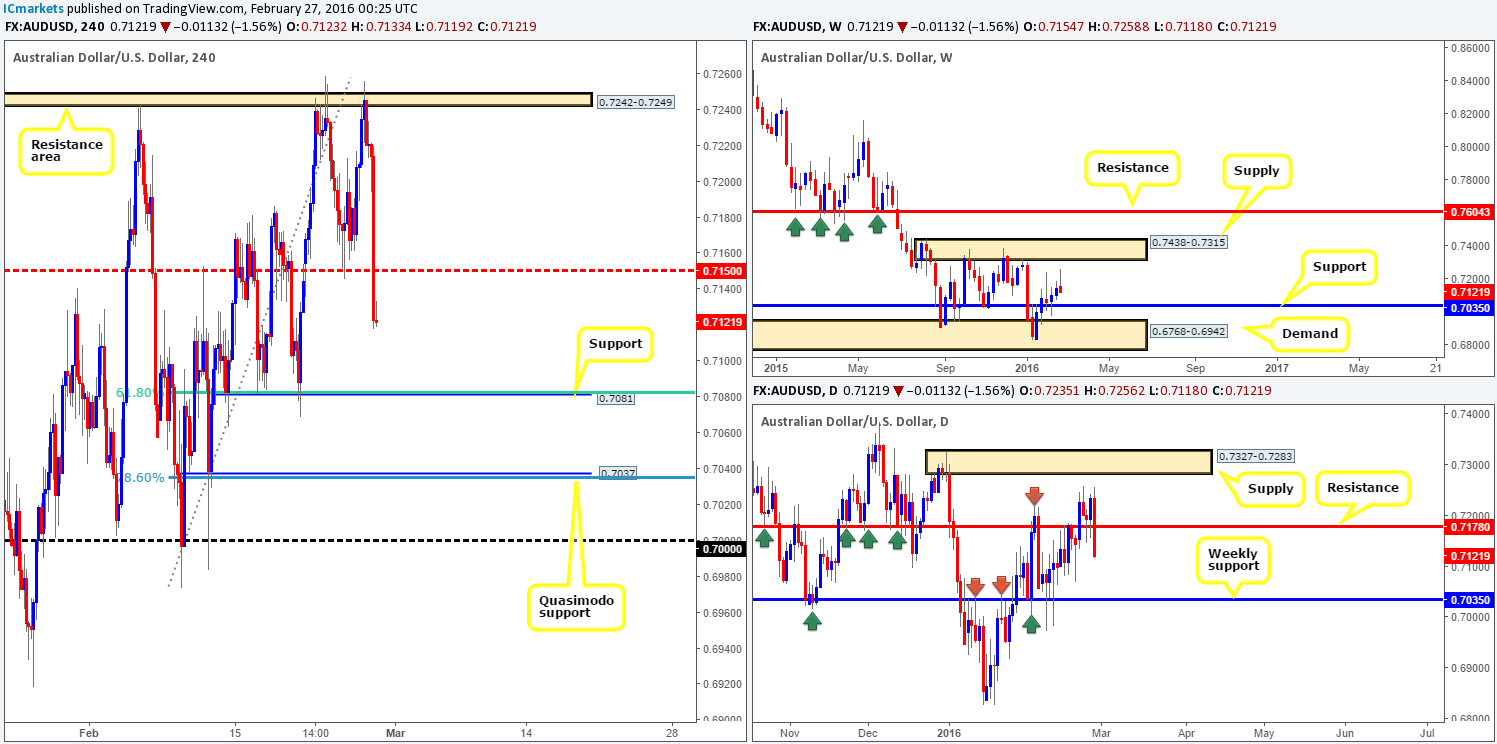
Although the Aussie dollar ranged over 140 pips last week, the market ended with price closing a mere 23 pips below the prior week’s close at 0.7121. This, as shown on the weekly chart, formed a clear bearish selling wick which could indicate that we may be heading down to revisit support at 0.7035 sometime this week.
Down on the daily timeframe, support at 0.7178 (now acting resistance) was aggressively taken out on Friday after being respected for the best part of last week, quickly erasing any gains the market had accrued. The next downside target to pay attention to (as per this timeframe) is the weekly support hurdle we just discussed above.
A quick look at Friday’s action on the H4 chart reveals that the resistance area at 0.7242-0.7249, along with a strong dollar, did a good job of suppressing the bulls resulting in price closing below mid-level support 0.7150 by the week’s end. As a result of this, the runway south appears to be clear for prices to challenge support at 0.7081.
Whilst shorting on the retest of 0.7150 is certainly something we’ll be watching for today, buying from 0.7081 is not a level we’d stamp high-probability for a reversal even though it converges with the 61.8% Fibonacci level at 0.7082. The more attractive level, in our opinion, sits below at 0.7037 – a Quasimodo support, which ties in beautifully with the weekly support level at 0.7035 and the 78.6% Fibonacci level at 0.7033.
So, to sum up, we see potential shorting opportunities on the retest of 0.7150, targeting 0.7081 and 0.7037. Also, upon reaching 0.7037, longs could be possible from this region, targeting 0.7081 first and foremost. Just to be clear here, each level would require confirmation from the lower timeframes before we’d consider trading, since a fakeout is very likely going to be seen before opposition steps in.
Levels to watch/live orders:
- Buys: 0.7037 [Tentative – confirmation required] (Stop loss: dependent on where one confirms this level).
- Sells: 0.7150 [Tentative – confirmation required] (Stop loss: dependent on where one confirms this level).
USD/JPY:
Looking at the daily chart of the USD/JPY, one can clearly see renewed buying pressure formed from the Feb 11th low 110.96 on Wednesday, consequently printing a compact double-bottom formation. This ignited the buy-side of this market which saw price wrap up the week closing a few pips shy of weekly resistance (114.12) at 113.96, recording gains of over 140 pips.
As already established, price is nearing weekly resistance at 114.12. On the H4 chart, however, this level also boasts both a psychological resistance number at 114.00, a 78.6% Fibonacci level at 114.05 as well as a trendline taken from the high 115.19, consequently forming a tight sell zone to have on your watch list early on today. We would not recommend placing pending orders here due to the fact that a fakeout above the weekly hurdle may take place as it did back on the 16th February, 2016. Therefore, the best, and in our opinion, most logical way to approach this market today would be to carefully watch the lower timeframe action around 114.12. In the event the bulls continue to press forward, then we’ll shift our attention to the H4 supply seen at 115.19-114.85 for a lower timeframe confirmed sell trade, seeing as it was this area that helped facilitate the previous fakeout.
The first take-profit target, should one manage to enter short from the 114.12 region today would be the H4 demand below at 113.16-113.51, followed closely by another H4 demand at 112.56-112.82 and then psychological support 112.00.
Levels to watch/live orders:
- Buys: Flat (Stop loss: N/A).
- Sells: 114.12 region [Tentative – confirmation required] (Stop loss: dependent on where one confirms this area). 115.19-114.85 [Tentative – confirmation required] (Stop loss: dependent on where one confirms this area).
USD/CAD:
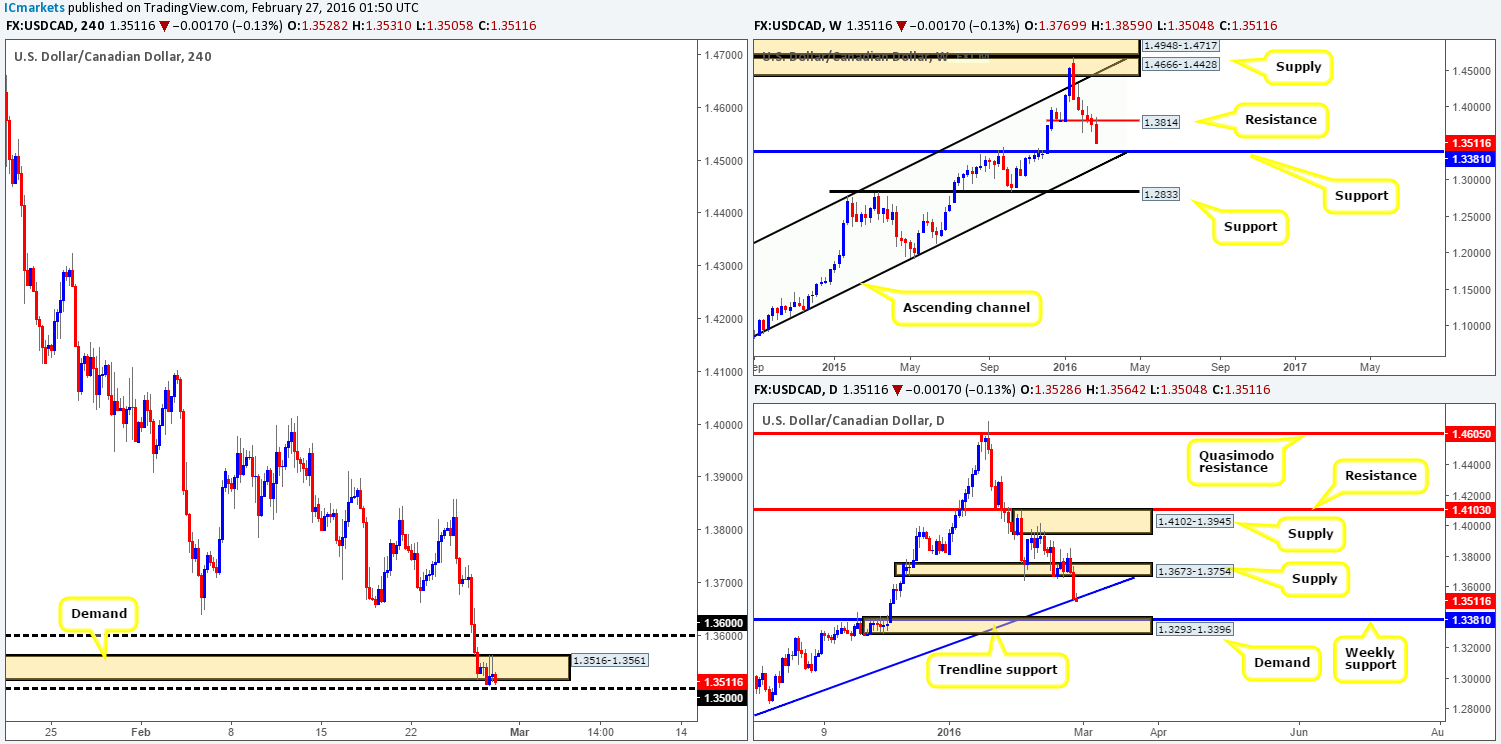
The USD/CAD has been trading south for six straight weeks now, down from its peak of 1.4689. Following the close below support at 1.3814, last week’s action saw the Loonie retest the underside of this barrier as resistance and aggressively drive 250 pips lower into the close 1.3511. As a result of this, support at 1.3381 is likely going to be in the firing range this week.
Zooming in and looking at the daily picture, a small close was seen below the trendline support (1.1919) which could potentially trigger further downside this week to demand coming in at 1.3293-1.3396 (surrounds weekly support at 1.3381).
A quick recap of Friday’s trading on the H4 chart shows that the buyers and sellers were seen battling for position around the lower limits of demand at 1.3516-1.3561. We sure most will agree with us here in saying this demand is hanging on by its last thread and the only other support seen below comes in at 1.3500 – a psychological number.
However, trading long from 1.3500 is out of the question for us today, due to what’s being seen on the higher-timeframe picture right now (see above). For this reason, our plan of attack today and most probably into the week is on trading below 1.3500. Ultimately, what we’d like to see is a close below this number and subsequent retest as resistance along with a lower timeframe sell signal. Based on this, we would feel comfortable shorting this market down to H4 demand at 1.3358-1.3396, which lies within the aforementioned daily demand, and also surrounds the above said weekly support. So, not only would this make for a good take-profit zone, it would also be a fantastic area to look to buy from (waiting for confirmation here is advised due to the possibility that price may drive lower into the daily demand area thus potentially faking beyond the H4 demand).
Levels to watch/live orders:
- Buys: 1.3358-1.3396 [Tentative – confirmation required] (Stop loss: dependent on where one confirms this area).
- Sells: Watch for bids to be consumed around 1.3500 and look to trade any retest seen thereafter (lower timeframe confirmation required).
USD/CHF:
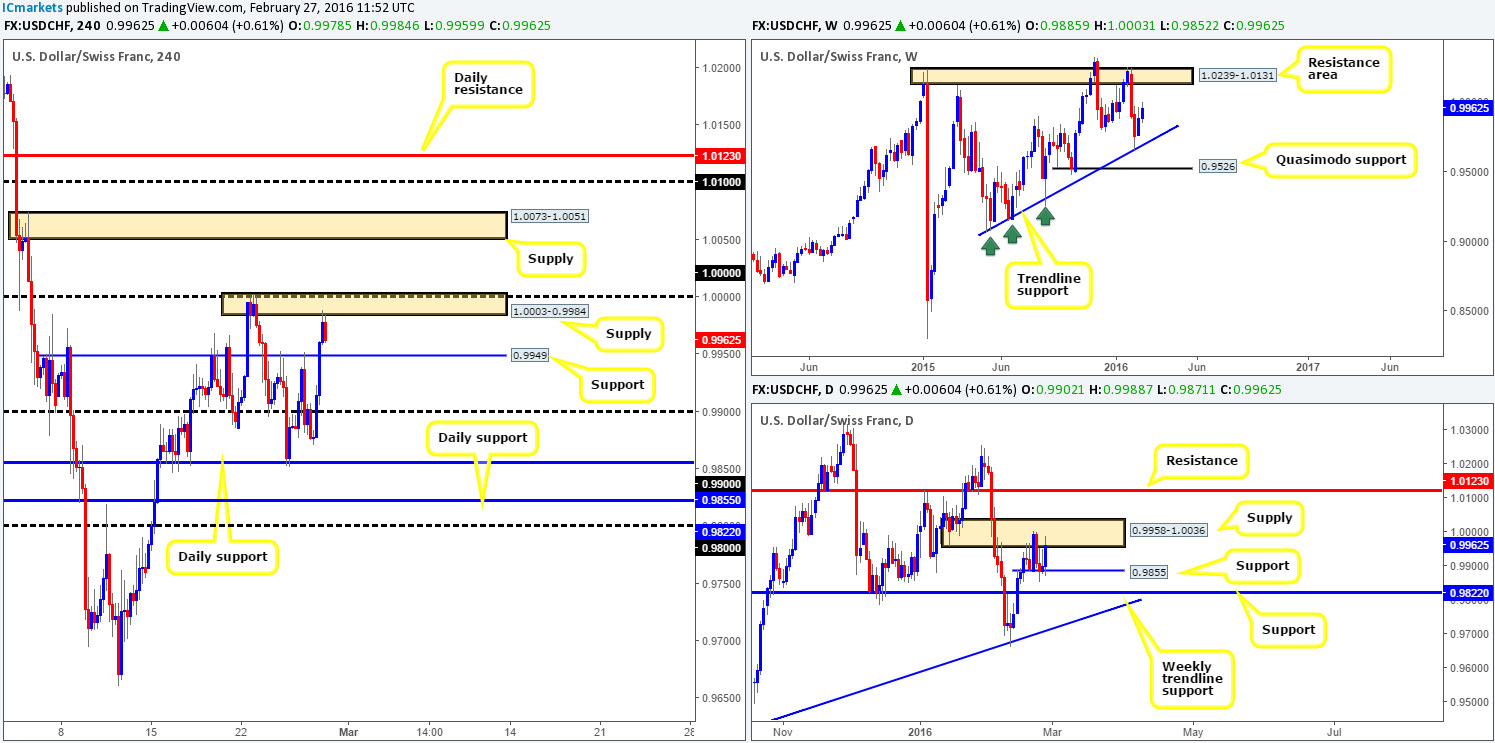
Following a to-the-pip bounce off the weekly trendline extended from the low 0.9071, last week saw USD/CHF rally a further seventy pips by the close 0.9962. Technically, there is very little seen on the weekly timeframe stopping this pair from continuing to punch higher this week, at least until price reaches the weekly resistance zone at 1.0239-1.0131.
On the other side of the ledger, however, daily flow shows upside has been capped by supply drawn from 0.9958-1.0036 since the 18th Feb. Despite this, there is also a strong base of bids seen below defending the 0.9855 region which has been holding firm also since the 18th Feb. A cut above the supply here would likely place resistance at 1.0123 back in view, whereas a push below the 0.9855 number opens up the door down to support penciled in at 0.9822.
Looking at Friday’s trading on the H4 chart, the pair clearly benefited from the positive U.S GDP numbers as price heavily accelerated north, breaking above resistance (now acting support) at 0.9949 and touching gloves with a supply seen at 1.0003-0.9984. As should be obvious from looking at the chart, price is effectively ship wrecked in between the above said barriers for now. Personally, the space in between here is too small for us to get excited about, therefore, we’re going to be looking beyond these areas for a trade today/this week.
If 0.9949 is taken out, psychological support at 0.9900 would likely be the next limit to reach, followed closely by the small daily support visible at 0.9855. That being the case, should we see price retest the underside of 0.9949 following a close lower, together with a lower timeframe sell signal, a trade short would be permitted. However, traders might want to handle this trade aggressively as weekly buyers could potentially make an appearance at any time (see above in bold).
On the other hand, a cut above supply at 1.0003-0.9984 would likely expose supply at 1.0073-1.0051, followed by the 1.0100 figure and daily resistance mentioned above at 1.0123. As such, a trade long may present itself should price retest the supply as demand following a close higher along with a lower timeframe buy signal. This would be the more favored trade for us this week as even though it would mean buying into daily supply, we would effectively be trading in-line with weekly flow.
Levels to watch/live orders:
- Buys: Watch for offers to be consumed around 1.0003-0.9984 and look to trade any retest seen thereafter (lower timeframe confirmation required).
- Sells: Watch for bids to be consumed around 0.9949 and look to trade any retest seen thereafter (lower timeframe confirmation required).
DOW 30:
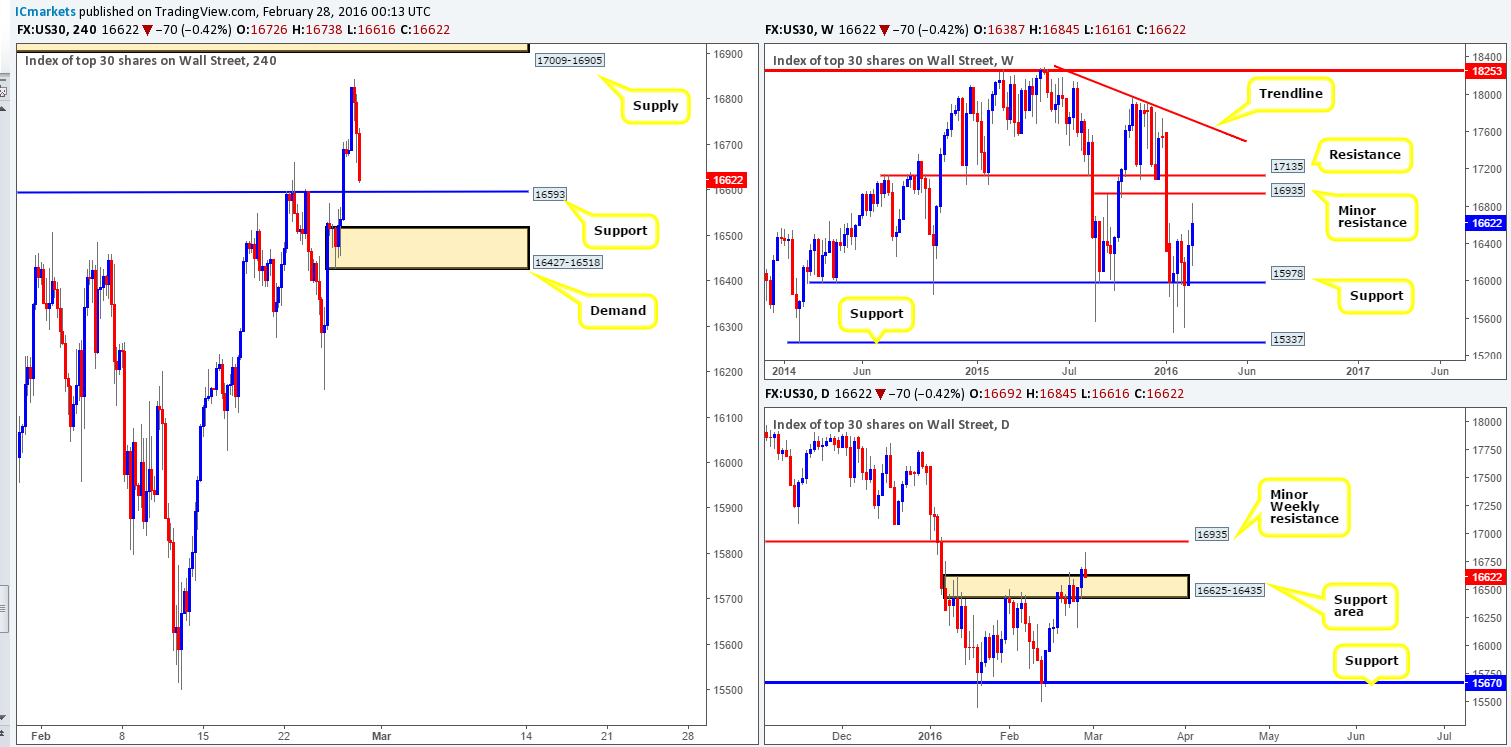
U.S. stocks extended higher for a second straight week, gaining over 230 points. This surge in buying, as you can see from the weekly chart, came relatively close to crossing swords with a minor resistance at 16935 before pulling back into the close 16622. Keep an eyeball on this resistance level this week as it could play a significant role during upcoming trade.
Scanning lower to the daily chart, Thursday’s action closed above a sturdy resistance area drawn from 16625-16435 and ended the week retesting the top-side of this zone as support. In the process, a bearish pin candle formed which could attract less-informed sellers into the market who focus purely on candle patterns.
Over on the H4 chart, we can see that Friday’s daily bearish candle not only closed within a daily support area, but also closed just ahead of a H4 support formed at the 16593 region – would you want to sell knowing this? With pattern traders likely looking to trade short today, we’re going to be hunting for longs from either the above said H4 support, or the demand lurking just below it at 16427-16518. This demand, like the support level, is located within the aforementioned daily support area, thus adding weight to these barriers. Waiting for confirmation at the support level is recommended as there’s little stopping price from driving lower to the demand zone. Unlike the support level, however, entering long from the demand zone has a clear stop-loss area beyond the daily support zone around 16360. Therefore, this would, dependent on the time of day, be a nice boundary to enter at market from since we’re not expecting price to hang around here for long. The ultimate target from either zone, nonetheless, is the H4 supply sitting above at 17009-16905, which surrounds the aforementioned minor weekly resistance level.
Levels to watch/live orders:
- Buys: 16593 [Tentative – confirmation required] (Stop loss: dependent on where one confirms this level). 16427-16518 [Dependent on the time of day, a market entry is possible here] (Stop loss: 16360).
- Sells: Flat (Stop loss: N/A).
XAU/USD: (Gold)
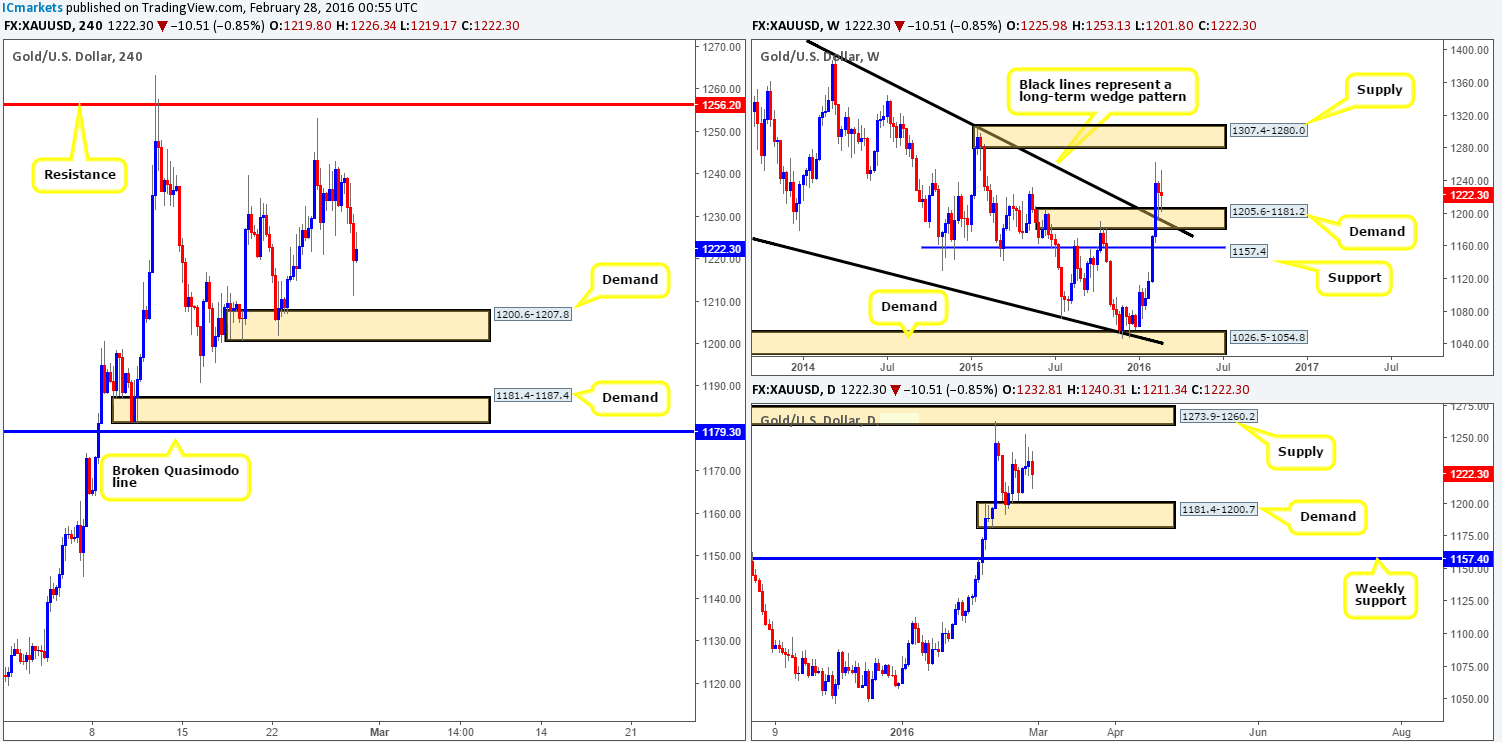
Despite Gold erasing around $4 last week and printing a weekly indecision candle, the weekly demand at 1205.6-1181.2 (boasts a broken weekly wedge resistance (now support) taken from the high 1485.3) remained well-bid. The next upside target to have on your watch list this week can be seen at supply drawn from 1307.4-1280.0. Meanwhile, a cut through the current demand zone will likely expose support penciled in at 1157.4.
The daily chart on the other hand depicts a slightly different picture. The yellow metal continues to loiter mid-range between demand at 1181.4-1200.7 and supply overhead at 1273.9-1260.2. A break above this supply will land one within touching distance of the weekly supply area mentioned above, whilst a break below places weekly support 1157.4 back in view.
Stepping across from the daily to the H4 chart, it’s clear that price took a hit on Friday as traders favored the U.S. dollar following a positive U.S. GDP reading, forcing price to lows of 1211.3 on the day. Given that price is trading from a weekly buy zone, we remain within the buyers’ camp this week. That being the case, all eyes will continue to focus on the following H4 areas:
- The demand at 1200.6-1207.8, which sits on top of the daily demand mentioned above at 1181.4-1200.7.
- On the assumption that the above area caves in, the next buy zone can be seen at 1181.4-1187.4 – another demand which happens to be positioned within the extremes of the above said daily demand.
Both areas are high-probability for a bounce in our opinion. The higher of the two is the more risky since price may ignore this zone and head to the lower area, since this base has already been visited. Therefore, we’d advise waiting for the lower timeframes to confirm this zone before risking capital. The lower of the two demands, albeit the better zone to trade, is also open to a fakeout due to the broken H4 Quasimodo line lurking just below it at 1179.3. One could trade this area at market if they are willing to place their stops below this Quasimodo line. If not, it might be best to go with the safe option and trade only upon pinning down a lower timeframe buy set up.
Levels to watch/live orders:
- Buys: 1200.6-1207.8 [Tentative – confirmation required] (Stop loss: dependent on where one confirms this area). 1181.4-1187.4 [Tentative – confirmation required] (Stop loss: dependent on where one confirms this area).
- Sells: Flat (Stop loss: N/A).


