A note on lower timeframe confirming price action…
Waiting for lower timeframe confirmation is our main tool to confirm strength within higher timeframe zones, and has really been the key to our trading success. It takes a little time to understand the subtle nuances, however, as each trade is never the same, but once you master the rhythm so to speak, you will be saved from countless unnecessary losing trades. The following is a list of what we look for:
- A break/retest of supply or demand dependent on which way you’re trading.
- A trendline break/retest.
- Buying/selling tails – essentially we look for a cluster of very obvious spikes off of lower timeframe support and resistance levels within the higher timeframe zone.
- Candlestick patterns. We tend to only stick with pin bars and engulfing bars as these have proven to be the most effective.
For us, lower timeframe confirmation starts on the M15 and finishes up on the H1, since most of our higher timeframe areas begin with the H4.
EUR/USD:
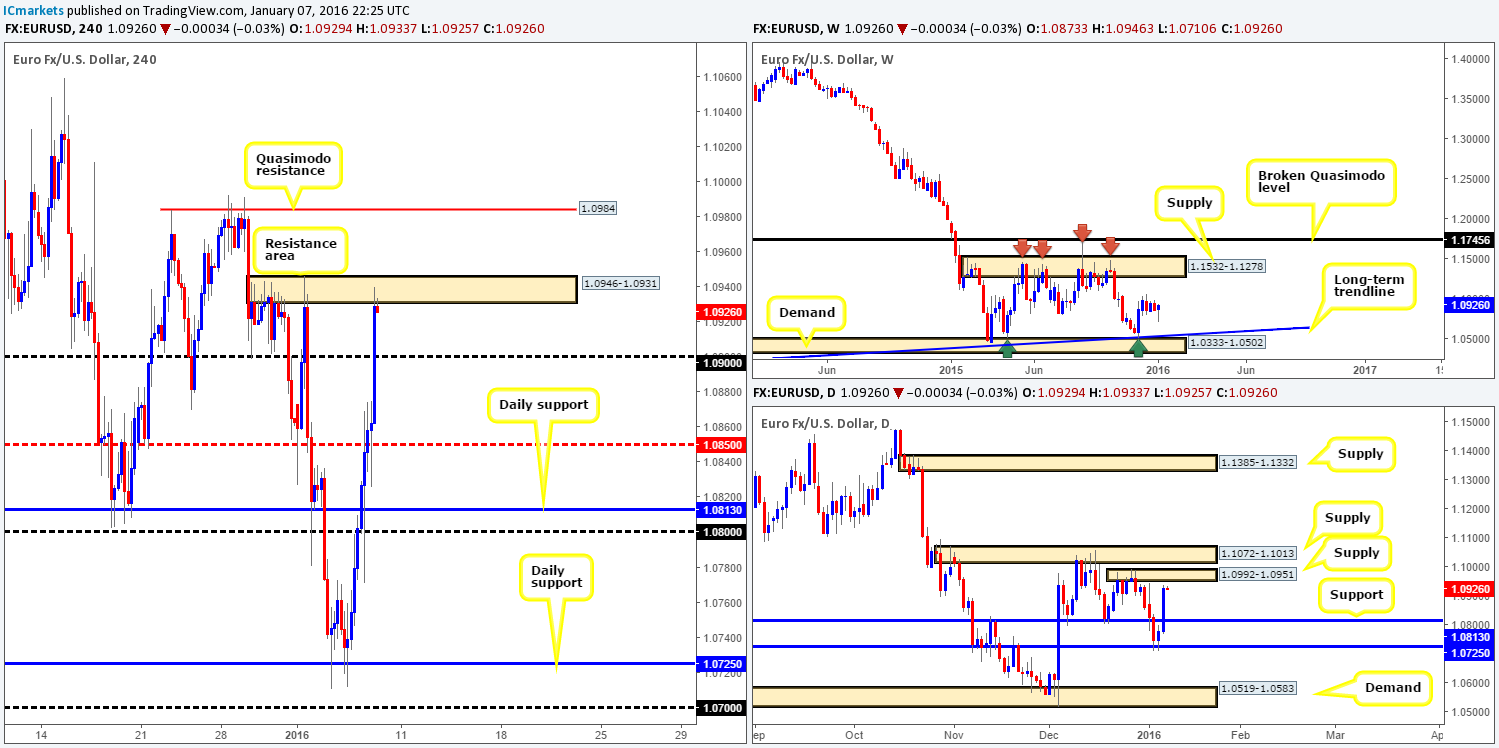
The EUR currency rallied for a second consecutive day yesterday, engulfing several resistances and ended with price nudging into a H4 resistance area penciled in at 1.0946-1.0931. Question is: does this look a stable enough platform to consider shorts today?
Well. One could say that it does due to it fusing together with the underside of daily supply at 1.0992-1.0951. Conversely, another may point out that we mustn’t lose sight of the fact that this daily supply is overshadowed by another daily supply lurking just above it at 1.1072-1.1013. Therefore, price could easily continue driving higher.
With the weekly chart offering very little in our opinion (loitering mid-range between supply at 1.1532-1.1278 and demand at 1.0333-1.0502), the only place we’d consider shorting today would be 1.0984 – a H4 Quasimodo resistance. This level is located deep within daily supply at 1.0992-1.0951, so you’ll have the benefit of placing your stop ABOVE this daily structure. That being said though, as we’ve already explained, there’s a chance this market could continue to rally, so unless 1.0984 boasts attractive lower timeframe selling price action, we’d very likely pass on the trade. All in all, we’d be very surprised if price hit 1.0984 pre-NFP as prices usually enter into a small consolidation in anticipation of the mighty release.
Levels to watch/live orders:
- Buys: Flat (Stop loss: N/A).
- Sells: 1.0984 [Tentative – confirmation required] (Stop loss: Dependent on where one confirms this level).
GBP/USD: (Trade update: Stopped out at 1.4597)
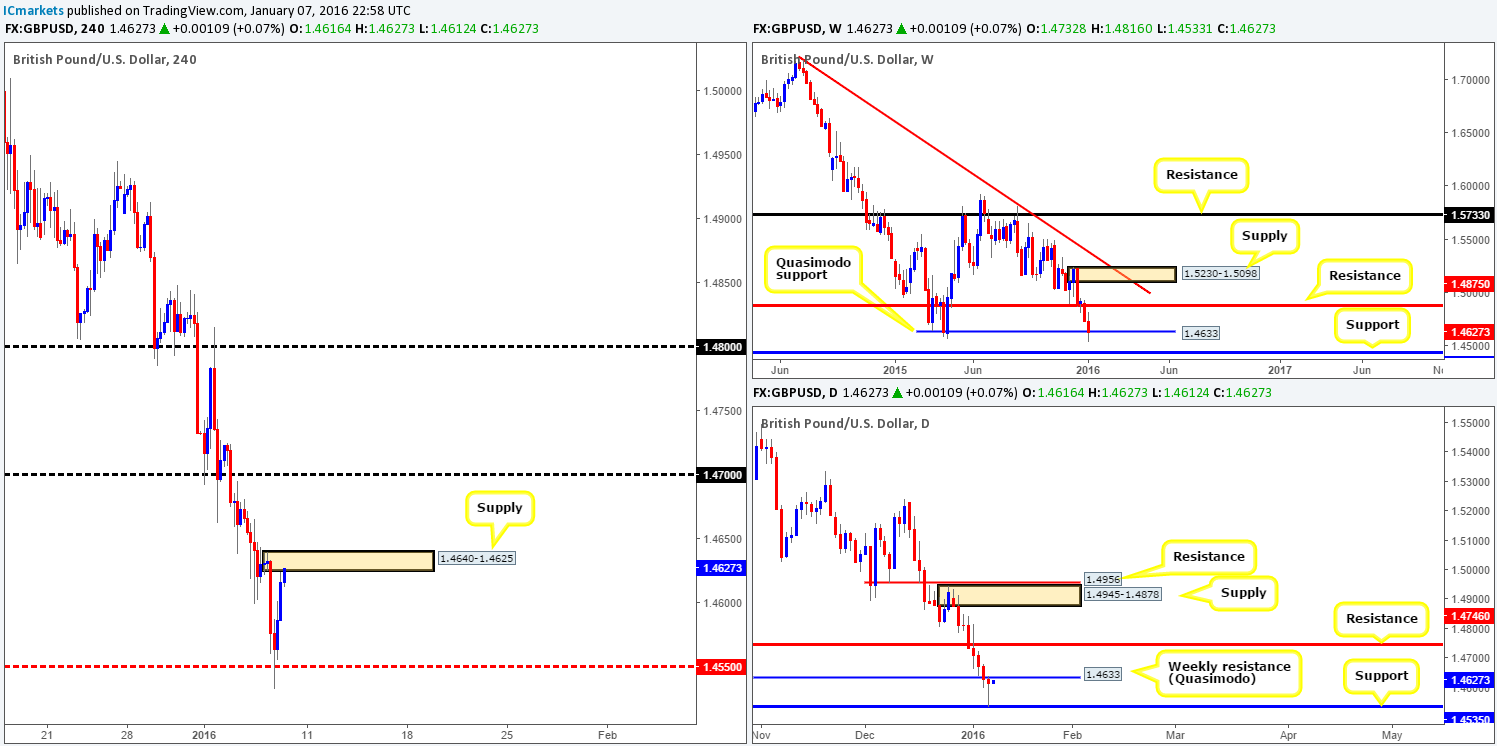
Coming in from the top this morning, the weekly Quasimodo support at 1.4633 has very likely been taken out. The removal of stops here (including ours) technically opens the path to further selling down to support fixed at 1.4429. Zooming in and looking at the daily chart, however, we can see that following the break of the weekly Quasimodo, price attacked bids at support drawn from 1.4530. This not only printed a nice-looking buying tail, but also dragged this pair back up to the underside of the weekly level itself, which should effectively act as resistance now.
Turning our attention to the H4 structure, price is, at the time of writing, plugging into offers around supply seen at 1.4640-1.4625. Given that this small area looks to be the decision-point where heavy sellers stepped in yesterday to break through the weekly Quasimodo support (see above), this zone could prove to be a tough resistance to consume. In light of this and the fact that this pair has not recorded gains for eight days now, our prime focus today will be on looking for lower timeframe sell entries within this H4 zone. Should this setup come to fruition, we’d want the stop to be at breakeven before the employment release hits the press. First take-profit target comes in at 1.4600, followed by mid-level support at 1.4550. The reason for requiring confirmation with this setup is due to the daily support mentioned above.
Levels to watch/live orders:
- Buys: Flat (Stop loss: N/A).
- Sells: 1.4640-1.4625 [Tentative – confirmation required] (Stop loss: 1.4643).
AUD/USD:
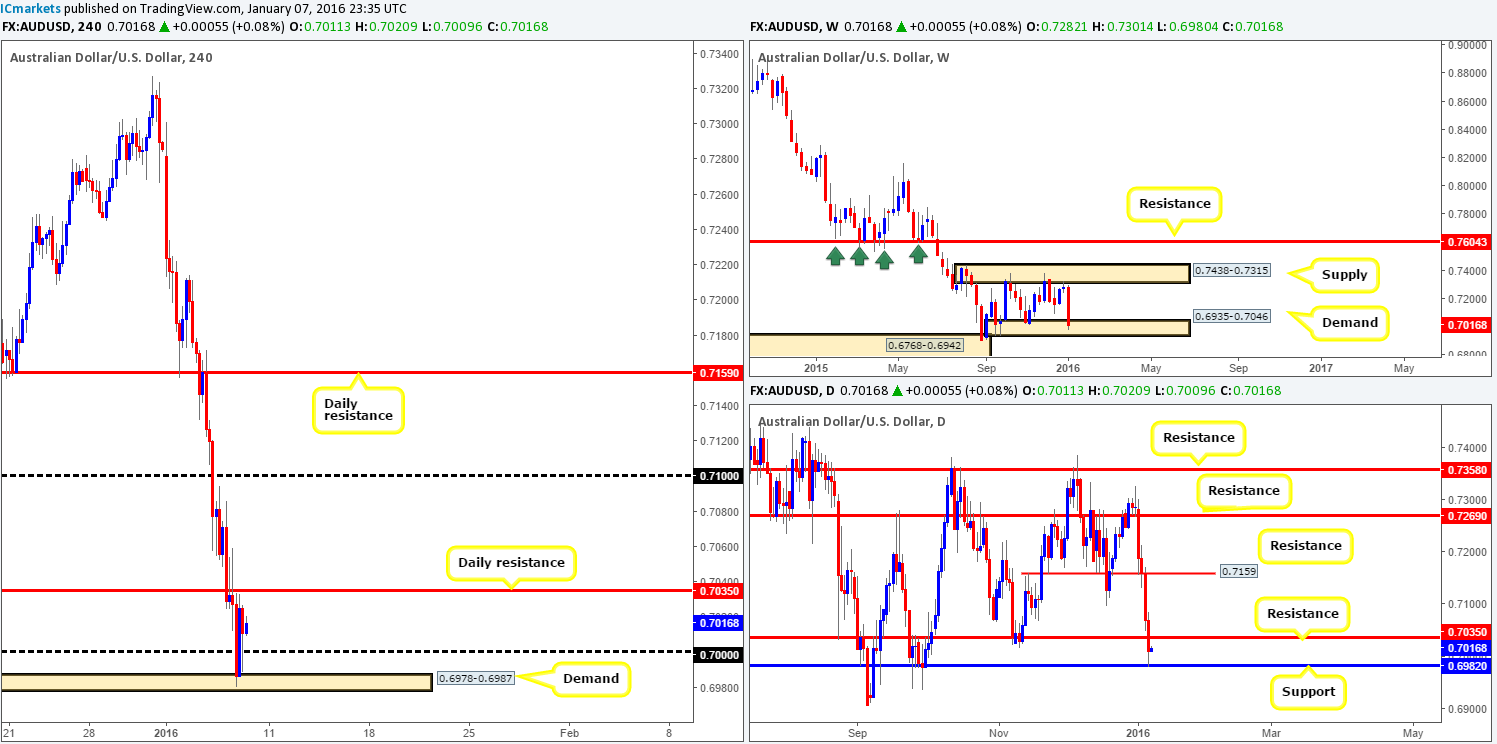
2016 has so far seen very little but red candles! Yesterday’s trade marked the fourth consecutive daily loss for this pair with China being the main fundamental stimulant. Technically, this resulted in weekly action being forced deep into demand fixed between 0.6935-0.7046, and daily movement breaking below yet another support (now resistance) at 0.7035, allowing price to shake hands with another support drawn from 0.6982.
Down on the H4 chart, we can see that yesterday’s trade momentarily surpassed the large psychological support 0.7000 and tagged in bids around demand just below it at 0.6978-0.6987 (encapsulates the daily support mentioned above at 0.6982) before advancing higher.
Given the points made above, we do not see the commodity currency breaking beyond the H4 demand and current daily resistance before the NFP hits the line. With that in mind, we’ll remain on the sidelines and wait for further price action to develop before making any further decisions.
Levels to watch/live orders:
- Buys: Flat (Stop loss: N/A).
- Sells: Flat (Stop loss: N/A).
USD/JPY:
Yesterday’s 80-pip decline marks the fourth consecutive drop in value since the beginning of the year, as China continues to dominate the markets. With investors fleeing to buy the safe-have Yen, where do we see this pair changing course, or at least bouncing?
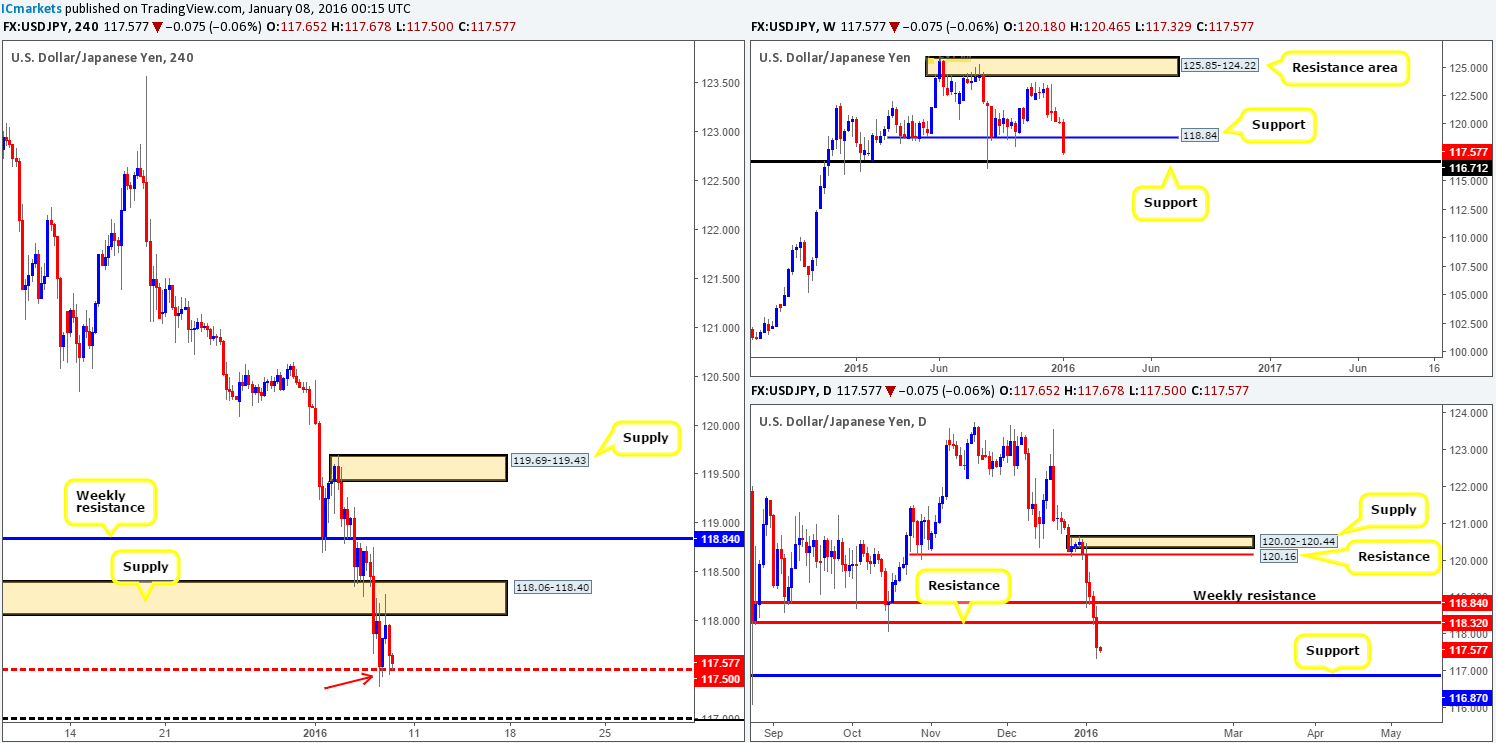
Both weekly support at 118.84 and daily support at 118.32 have, in our opinion, been well and truly consumed now. This likely leaves the path free for further downside to 116.71 on the weekly and 116.87 on the daily. However, scanning across to the H4 chart, it’s relatively clear to see that this unit remains bid from mid-level support 117.50 at the moment, and offered from the recently broken demand (now acting supply) at 118.06-118.40.
Personally, we do not see 117.50 holding for much longer due to higher timeframe pressure and the majority of buyers already likely being consumed by the tail printed during the London open (seen marked with a red arrow at 117.32). Therefore, today’s spotlight will firmly be focused on psychological support 117.00. This level – coupled with the higher timeframe supports at 116.71/116.87 form a potentially tight concentration of bids to keep an eye on for possible confirmed longs pre/post NFP (we never trade news). The reason for requiring lower timeframe confirmation at this barrier is simply because current fundamentals may override this technical buy zone.
Levels to watch/live orders:
- Buys: 117.00/116.71 [Tentative – confirmation required] (Stop loss: Dependent on where one confirms this area).
- Sells: Flat (Stop loss: N/A).
USD/CAD:
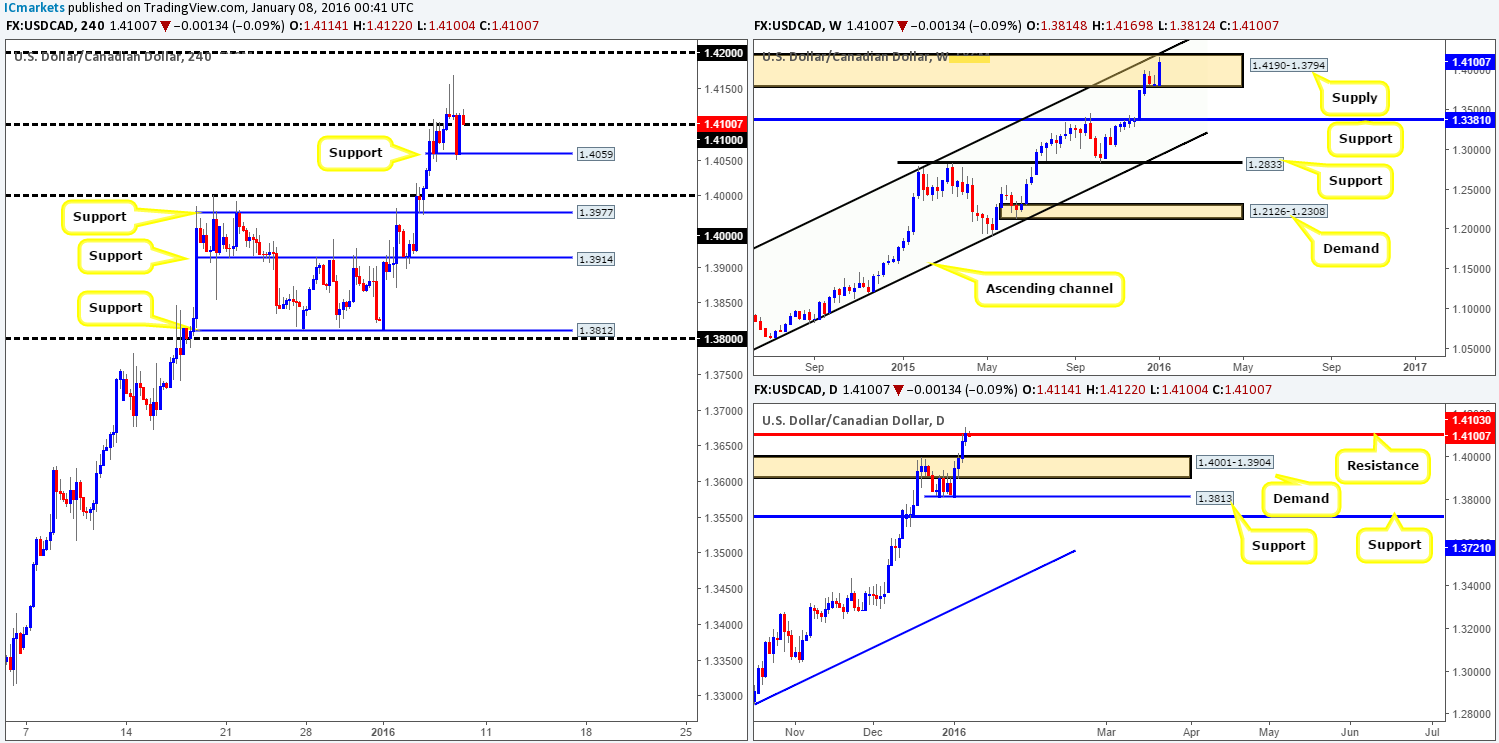
During the course of yesterday’s sessions the USD/CAD rose to a session high of 1.4169, before collapsing going into the American session. This sell-off saw the market whipsaw through psychological support 1.4100 and tag in bids from H4 support drawn from 1.4059 before closing the day back above 1.4100.
With price seen resting on 1.4100 at present, traders thinking of buying from here may want to hold fire. The reasons? Take a look at the weekly chart. Price is trading very high within a major supply at 1.4190-1.3794, which, as you can see, ties in nicely with an upper channel resistance band extended from the high 1.1173. Adding to this, daily action recently printed a bearish selling wick at the underside of resistance given at 1.4103.
Although this pair’s trend is extremely strong right now, trading long on the basis of psychological support 1.4100 when faced with huge higher-timeframe resistance may not be worth the risk. All of this coupled with volatility expected from the NFP release makes this a relatively easy decision to remain flat for the time being.
Levels to watch/live orders:
- Buys: Flat (Stop loss: N/A).
- Sells: Flat (Stop loss: N/A).
USD/CHF:
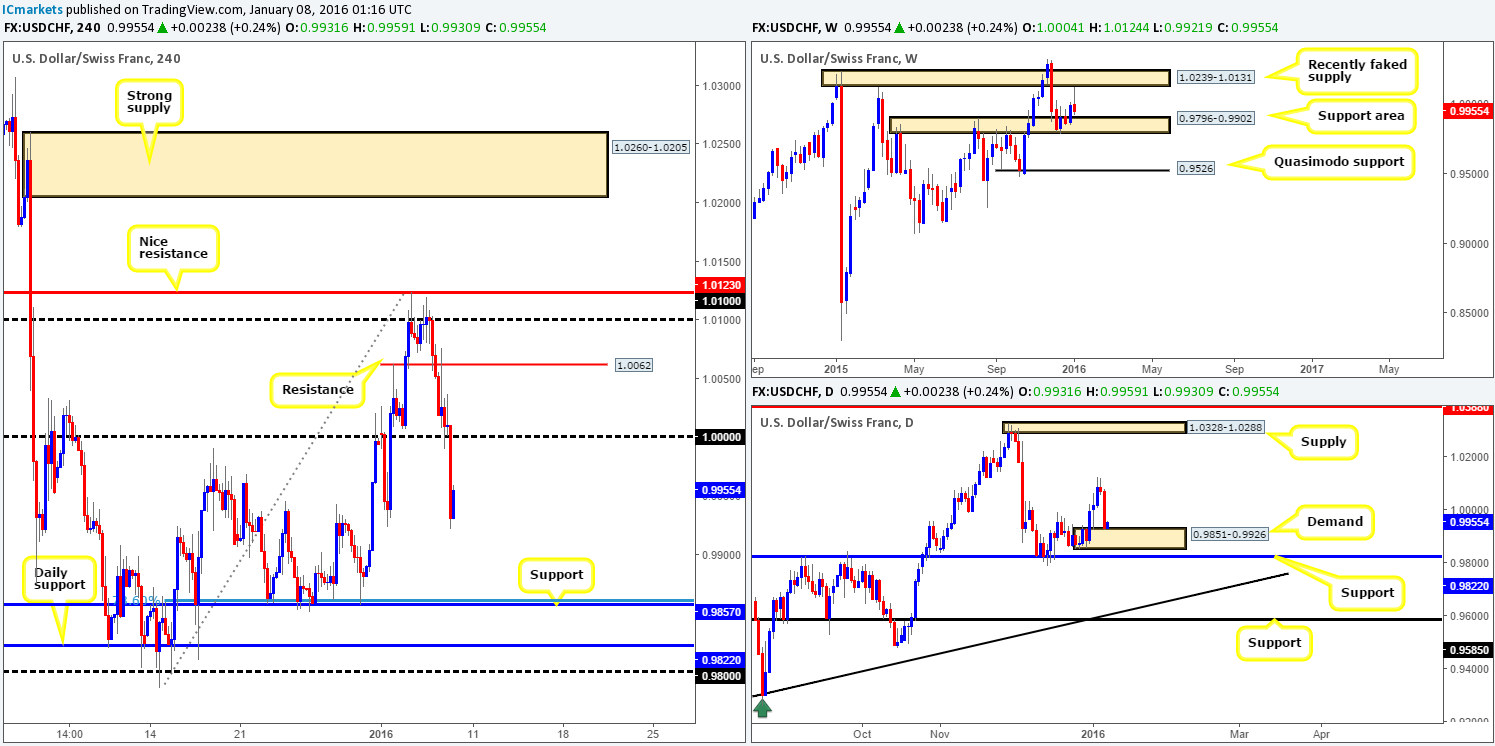
Amid yesterday’s trade, we saw the bears smash through H4 support at 1.0062, only to retest it as resistance going into the London open. This sparked further selling interest bringing prices down to parity (a noted buy zone in our previous report). The rebound from here was enough to profit in the lower timeframes, but unfortunately we could not locate a bullish signal to get long. Following a brief pause, the USD/CHF continued to drive lower, taking out bids from 1.0000 and connecting with the 4th Jan low 0.9923 by the day’s end.
With the weekly chart showing price trading just above a support area at 0.9796-0.9902, and daily movement already trading from demand at 0.9851-0.9926, where do we see this market heading today? Well, we really like the look of H4 support coming in at 0.9857. This barrier not only sits deep within the daily demand, but is also positioned just within the weekly support area as well (see above for levels). In addition to this, 0.9857 blends nicely with the 78.6 Fibonacci level coming in at 0.9861.
If you’re considering trading this H4 support level, as we are, we would highly recommend only doing so with some sort of lower timeframe buy signal. Our reason for why comes from the daily support level sitting below it at 0.9822. This level could provide a nice barrier for well-funded traders to fake past daily demand and take stops out for liquidity to buy.
Levels to watch/live orders:
- Buys: 0.9857 [Tentative – confirmation required] (Stop loss: dependent on where one confirms this level).
- Sells: Flat (Stop loss: N/A).
DOW 30:
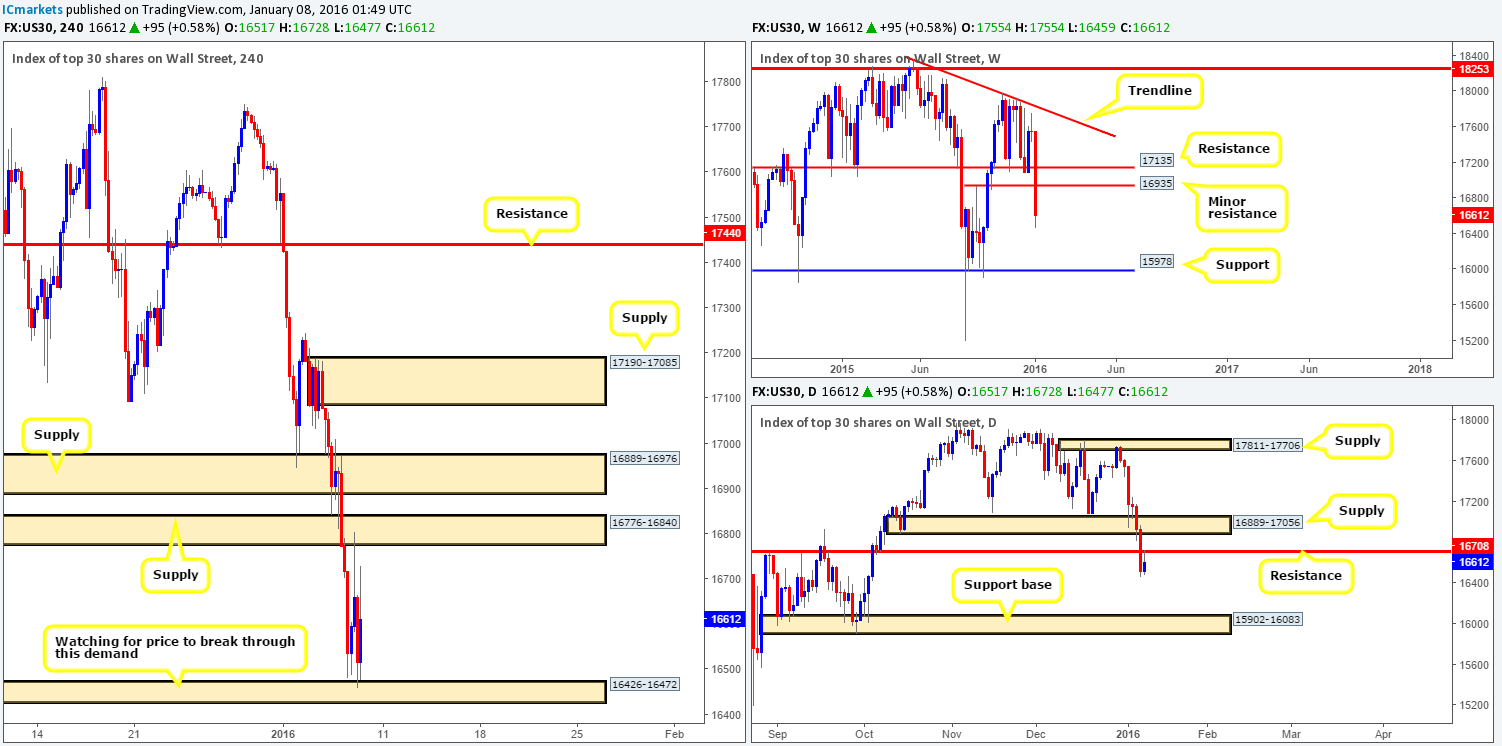
The DOW index took another hit to the mid-section yesterday erasing 417 points off its value, marking the fourth consecutive daily loss for this market, as fears surrounding China’s slowdown continue to dominate.
Technically, the weekly chart, at least in our opinion, shows room to continue driving lower to support penciled in at 15978. Daily action on the other hand, recently took out support at 16708, and is, as the time of writing, being retested as resistance. The next downside target to be aware of on this timeframe falls in around 15902-16083 – a clear area of support.
Scrolling down to the H4, however, price is currently bid from demand at 16426-16472 and offered from supply coming in at 16776-16840. In view of the clear bearish tone in this market right now, our team will not be looking to buy from current demand. Instead, what we’re looking for is a break below this zone and a retest of it as supply. This will, in effect, be our cue to begin looking for lower timeframe shorts, targeting H4 support at 16036 (sits within the daily support base mentioned above).
Levels to watch/live orders:
- Buys: Flat (Stop loss: N/A).
- Sells: Watch for bids to be consumed around H4 demand at 16426-16472 and then look to trade any retest of this area thereafter (lower timeframe confirmation preferred).
XAU/USD: (Gold)
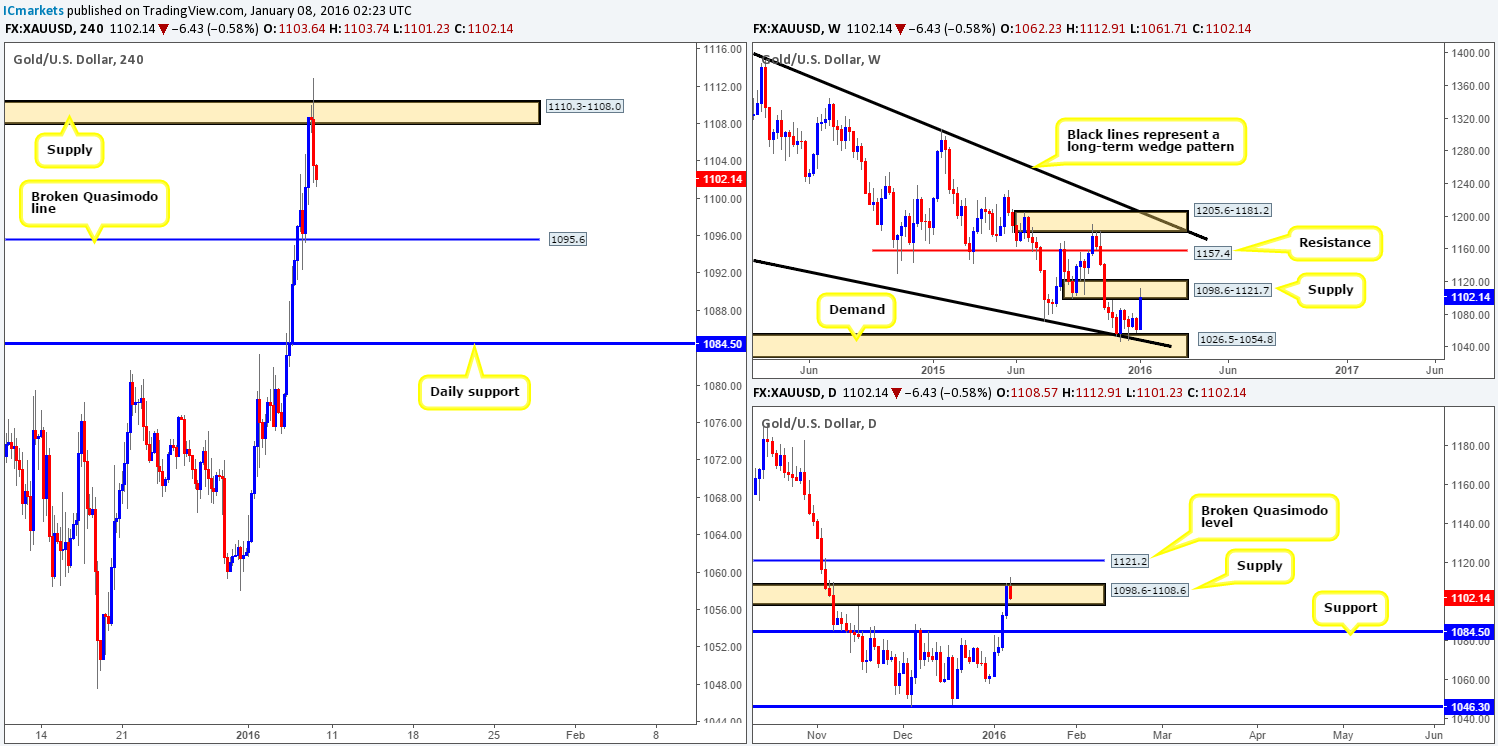
Boosted by events surrounding China which saw the Shanghai Composite index close shortly after opening due to a 7% circuit breaker being triggered, investors continue to bid Gold higher.
Technically, this has pushed the yellow metal into the jaws of weekly supply drawn from 1098.6-1121.7, and also forced prices to spike above daily supply at 1098.6-1108.6 and its partner supply on the H4 at 1110.3-1108.0.
In that price is trading from resistance on all three of our followed timeframes, we’re hesitant to buy right now. As a matter of fact, the same goes for selling, due to H4 action currently loitering mid-range between the above said supply and a broken Quasimodo line of support at 1095.6.
With the NFP release just around the corner, the best path to take (in our opinion) today is to watch how price reacts when/if the market reaches either the H4 Quasimodo support at 1095.6 or the H4 supply above at 1110.3-1108.0 before making any further decisions.
Levels to watch/live orders:
- Buys: 1095.6 [Tentative – confirmation required] (Stop loss: dependent on where one confirms this level).
- Sells: 1110.3-1108.0 [Tentative – confirmation required] (Stop loss: dependent on where one confirms this area).


