A note on lower timeframe confirming price action…
Waiting for lower timeframe confirmation is our main tool to confirm strength within higher timeframe zones, and has really been the key to our trading success. It takes a little time to understand the subtle nuances, however, as each trade is never the same, but once you master the rhythm so to speak, you will be saved from countless unnecessary losing trades. The following is a list of what we look for:
- A break/retest of supply or demand dependent on which way you’re trading.
- A trendline break/retest.
- Buying/selling tails – essentially we look for a cluster of very obvious spikes off of lower timeframe support and resistance levels within the higher timeframe zone.
- Candlestick patterns. We tend to only stick with pin bars and engulfing bars as these have proven to be the most effective.
For us, lower timeframe confirmation starts on the M15 and finishes up on the H1, since most of our higher timeframe areas begin with the H4.
EUR/USD:
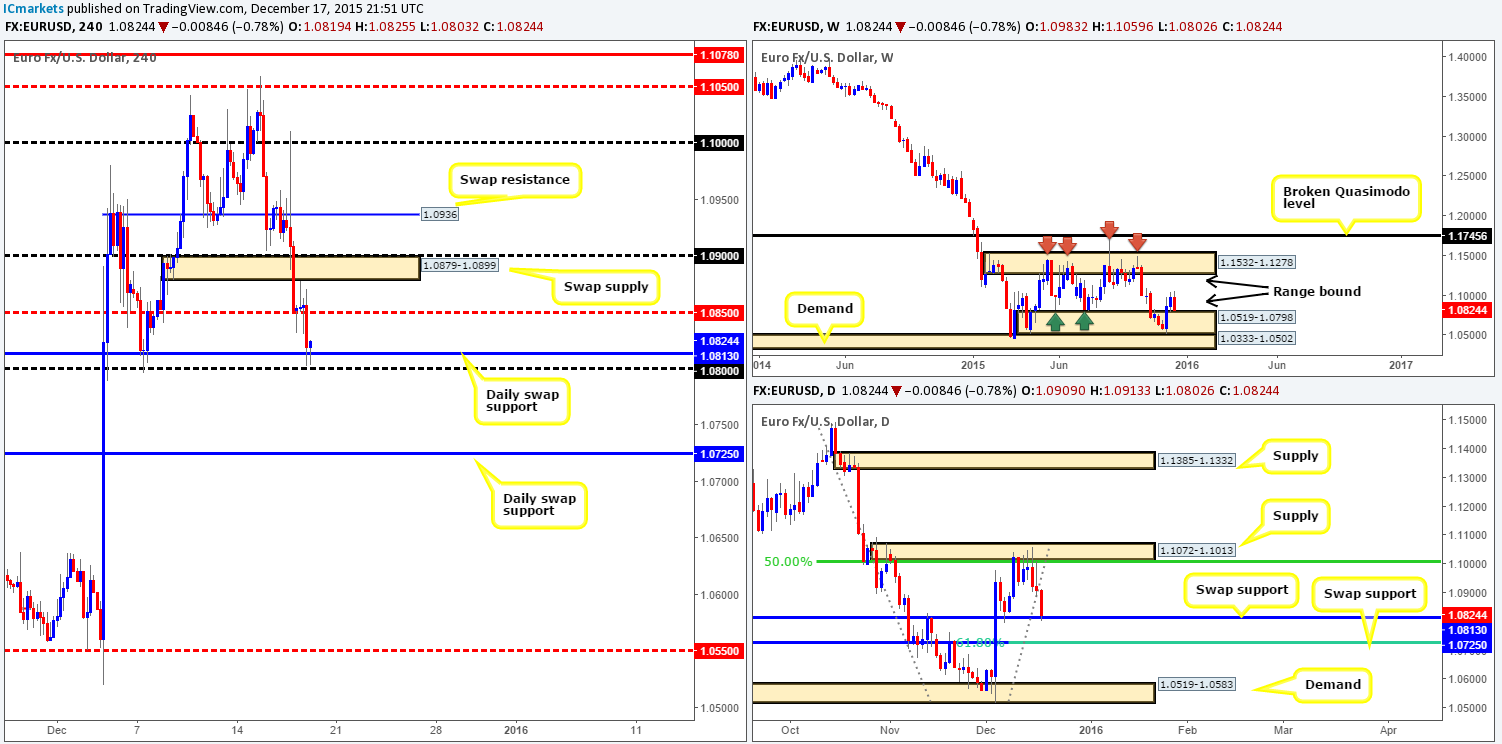
For those who read our previous report on the EUR (http://www.icmarkets.com/blog/thursday-17th-december-daily-technical-outlook-and-review/), we mentioned that we were going to be looking for lower timeframe buy entries between 1.0850/1.0813 yesterday (a bullish Gartely pattern [no longer on the chart] and a daily swap [support] level at 1.0813). Price did find support around the 1.0850 region and even rebounded to the underside of H4 swap supply at 1.0879-1.0899, but, as you can see, the single currency eventually gave way.
At this point, the buyers and sellers are seen battling for position around the above said daily swap (support) level and nearby psychological support below it at 1.0800. This – coupled with weekly action now kissing the top-side of range demand at 1.0519-1.0798 could suggest a possible reversal from here today. Should we manage to find a confirmed entry long around this area, 1.0850 will be our first port of call to take partial profits, followed closely by the H4 swap supply above it at 1.0879-1.0899.
In the event that the combined daily swap (support) level and round number is taken out, however, all eyes will be on the daily swap (support) barrier below at 1.0725 for potential longs, which (seen from the daily chart) converges beautifully with the 61.8% Fibonacci level.
Levels to watch/live orders:
- Buys: 1.0800/1.0813 [Tentative – confirmation required] (Stop loss: dependent on where one confirms this level).
- Sells: Flat (Stop loss: N/A).
GBP/USD:
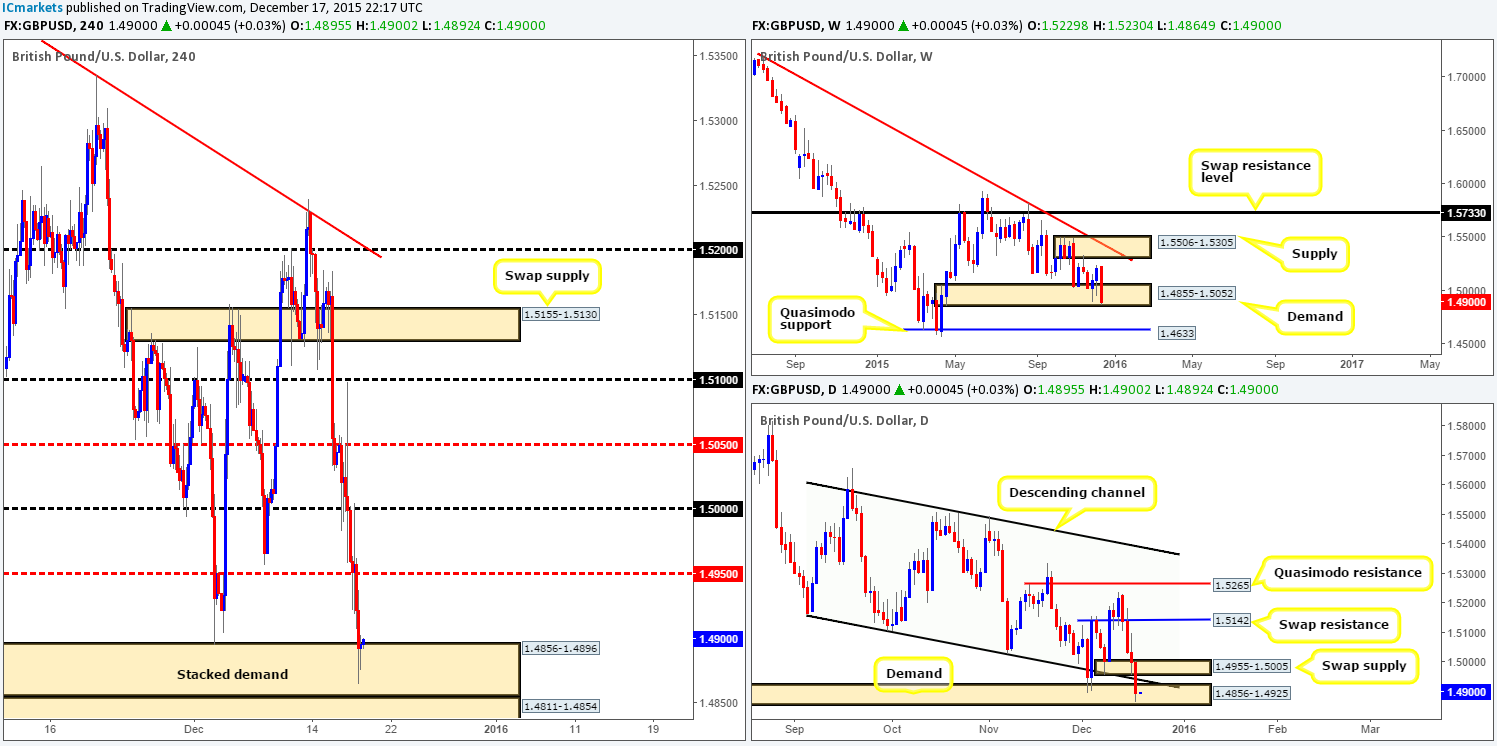
Beginning with a look at the weekly chart this morning, we can see that the GBP has suffered all week! Price is currently testing the lower limits of demand drawn from 1.4855-1.5052, and assuming that this bearish momentum continues and this area is taken out, we see little stopping this pair from continuing lower towards the Quasimodo support level at 1.4633. Moving down to the daily chart, demand (now supply) at 1.4955-1.5005, as well as channel support taken from the low 1.5162 were consumed yesterday, leaving price free to test bids around demand below it at 1.4856-1.4925.
Turning our attention to the H4 chart, it’s clear that all three timeframes are now in demand. H4 shows price testing 1.4856-1.4896, which is bolstered by yet another H4 demand below it at 1.4811-1.4854 (stacked demand). Therefore, as far as supply and demand goes, we should be looking to buy this currency now as this market appears oversold. We remain wary though, as this whole week has seen a sea of red candles print, taking out multiple higher timeframe structures. With this being the case, the only logical path we see is entering long from here ONLY IF we manage to spot a lower timeframe confirmed setup. Ultimately, we’d then target mid-level resistance at 1.4950 to take partial profits.
Levels to watch/ live orders:
- Buys: 1.4856-1.4896 [Tentative – confirmation required] (Stop loss: dependent on where one confirms this area).
- Sells: Flat (Stop loss: N/A).
AUD/USD:
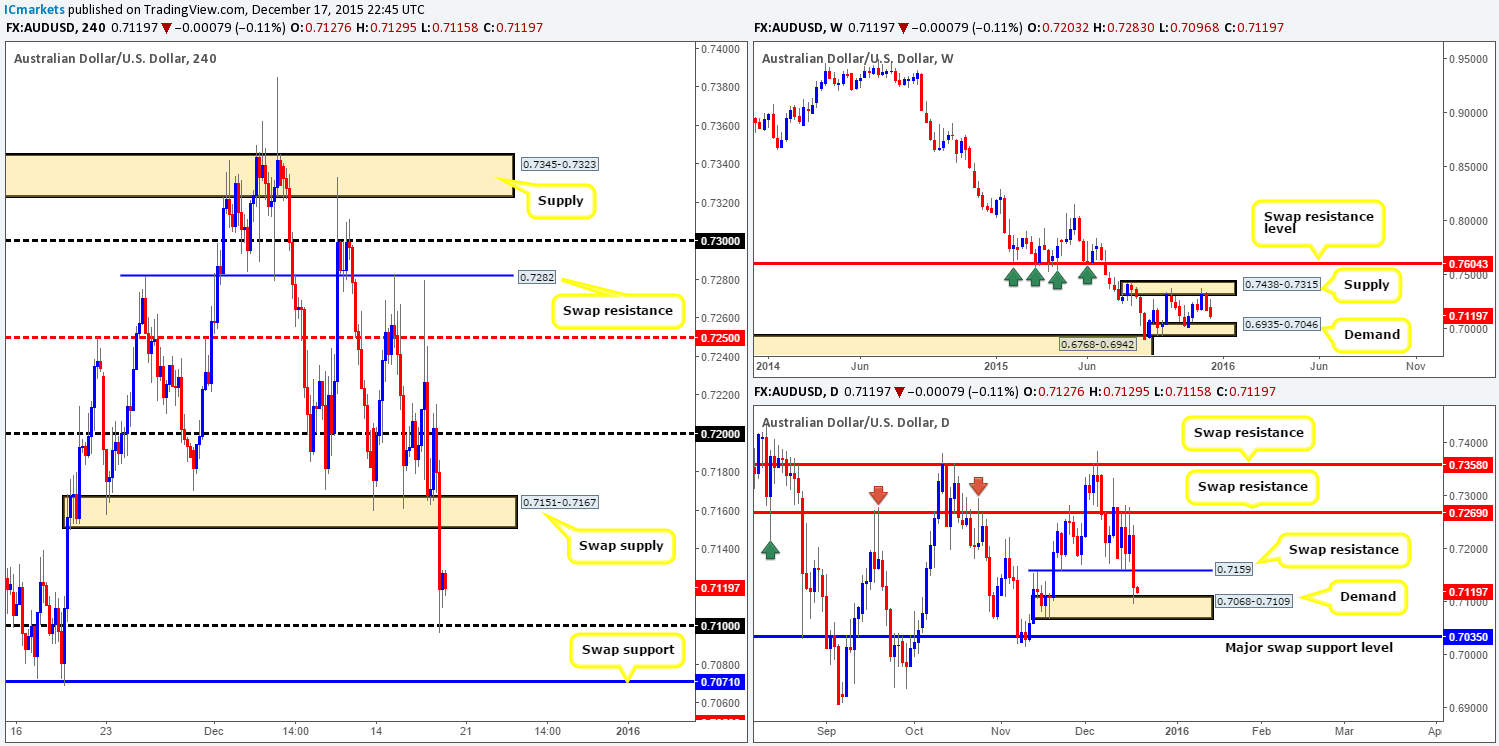
Early on in yesterday’s sessions, the commodity currency bounced nicely from H4 demand at 0.7151-0.7167, rallying price up to psychological resistance 0.7200. It was at this point (the London open) that things began turning sour for the Aussie. Strong sellers stepped in and drove this market through the above said demand (now supply), consequently connecting with active bids sitting at psychological support 0.7100.
As we can see, 0.7100 remains a well-bid level for now. It also coincides with the top-side of daily demand coming in at 0.7068-0.7109, so the rebound here should not cause surprise. However, let’s not forget that weekly action still shows room to continue lower down to demand at 0.6935-0.7046.
Given the points made above, here are the levels on our radar today:
Buys:
- Psychological support 0.7100. Should price retest this barrier along with a lower timeframe buy setup, we’d jump in long for an intraday bounce.
- H4 swap support at 0.7071. In case 0.7100 fails to hold, prices will likely head for this barrier. Considering that it sits deep within the current daily demand, it certainly deserves a place on this list (confirmation required).
Sells:
- H4 swap supply at 0.7151-0.7167. Not only does this beauty surround a daily swap (resistance) level at 0.7159, it also trades in-line with current weekly flow. It would be totally down to the individual trader if they deemed this H4 area good enough to touch trade. We, however, still prefer to wait for a confirming setup on the lower timeframes before getting in to avoid any fakeout that may take place.
Levels to watch/ live orders:
- Buys: 0.7100 [Tentative – confirmation required] (Stop loss: dependent on where one confirms this level). 0.7071 [Tentative – confirmation required] (Stop loss: dependent on where one confirms this level).
- Sells: 0.7151-0.7167 [Tentative – confirmation required] (Stop loss: dependent on where one confirms this area).
USD/JPY:
Starting from the top this morning, the USD/JPY continues to trade strong from the weekly swap (support) level at 120.29. In order for the buyers to continue bidding this market north, however, some wood will need to be chopped through first around the 123.75/122.22 region before this market can extend up to supply at 125.27-124.11. Daily action on the other hand, shows recent movement closed above swap resistance (now support) at 122.22. Should the buyers remain dominant above this number, then this could suggest further upside to resistance coming in at 123.59.
Down on the H4 chart, yesterday’s sessions saw the pair bid above swap supply at 122.22-122.42, which, as you can see, was retested as demand before prices rallied to connect with offers around the swap resistance at 122.84. Given that the reaction from this resistance brought trade back down to the swap demand area, where do we go from here?
Well, one could look to join any move seen from this area back up to 122.84 for an intraday long, but we would not be comfortable with this. Ultimately, for us to become buyers in this market now, we’d need to see three things happen. Firstly, a close above the current H4 swap (resistance) level, secondly, a successful retest of this level as support and finally a lower timeframe buy setup following the retest. As for targets, there would only be one in our opinion – the H4 Quasimodo resistance level at 123.28.
Levels to watch/ live orders:
- Buys: Watch for offers to be consumed around 122.84 and then look to trade any retest seen thereafter (confirmation required).
- Sells: Flat (Stop loss: N/A).
USD/CAD:
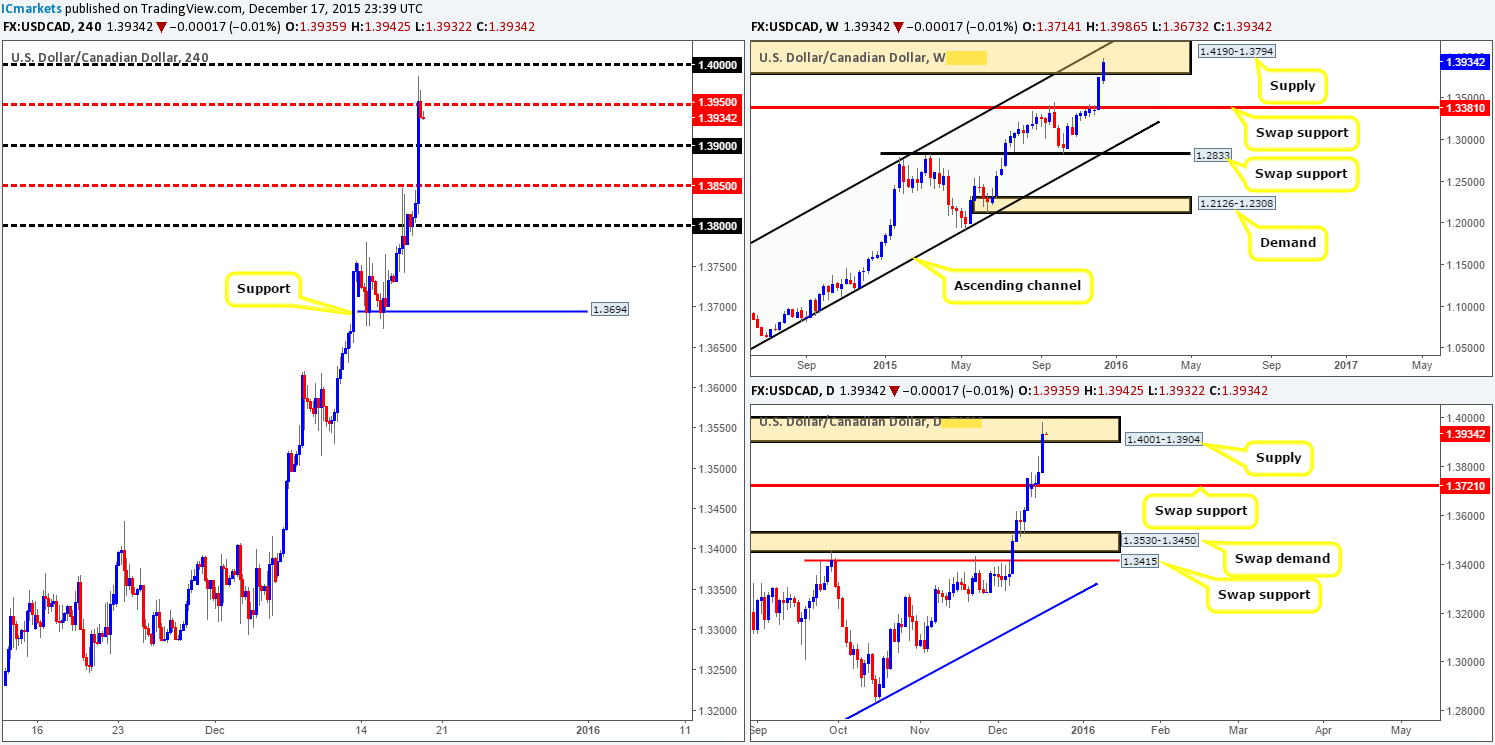
Coming at you directly from the weekly timeframe this morning, which shows price now trading relatively deep within supply coming in at 1.4190-1.3794. On top of this, a long-term channel resistance taken from the high 1.1172 converges nicely with this area. By the same token, current trade on the daily chart is also residing relatively deep within supply at 1.4001-1.3904. Should this buying frenzy continue above here, we’ll then be watching the swap resistance level at 1.4103.
From the H4 chart, however, we can see that most of yesterday’s buying was done going into the American session, which saw prices rally over 100 pips and connect with mid-level resistance 1.3950. Now, with both the weekly and daily charts showing prices trading within supplies (see above) right now, would we sell from 1.3950? No we would not. Here’s why…
- Look at the higher timeframe supplies, there’s room within these structures for prices to move higher up to the large psychological resistance 1.4000.
- Given the current buying on this pair, it seems there’s little that can stop it right now. Shorting into the overall flow, especially when it’s as strong as this makes us nervous.
On account of the above, the only opportunity we see today is if price closes above 1.3950 and retests it as support (confirmation required), targeting 1.4000. Just to clear here guys, the lower timeframe confirming setup would need to be very clear for us to trade this move! Other than this, we’re quite content on laying low until price reaches 1.4000.
Levels to watch/ live orders:
- Buys: Watch for offers to be consumed around 1.3950 and then look to trade any retest seen thereafter (confirmation required).
- Sells: Flat (Stop loss: N/A).
USD/CHF:
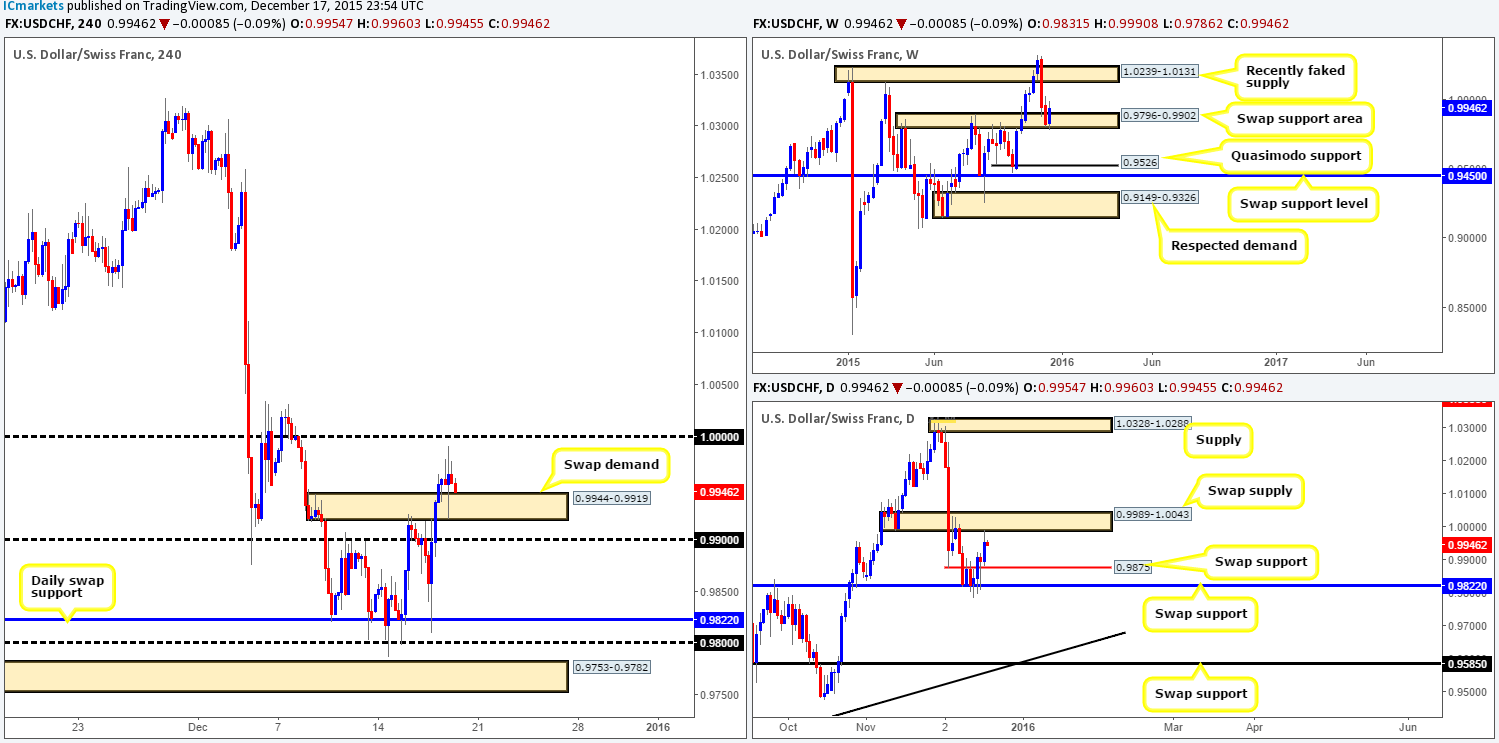
During the course of yesterday’s sessions, H4 action broke above supply at 0.9944-0.9919 and later retested it as demand. Price, as you can see, came within ten pips of hitting parity yesterday before slightly selling off. The reason for price stopping here can be seen on the daily chart, as price reacted to underside of a swap supply area coming in at 0.9989-1.0043. Does this mean we are expecting this pair to trade lower now? Not at all. We agree, with both the current daily swap supply, and the fact that parity lurks within this area forms a nice barrier of resistance, but we still remain unsure. Reason being is that over on the weekly chart, it’s pretty clear who has been in control for the majority of the week from the swap support area at 0.9796-0.9902! In addition to this, there is room for prices to continue appreciating on this timeframe up to the recently fake supply area given at 1.0239-1.0131.
With the above points in mind, we’d really like to see parity consumed and retested as support before we become buyers in this market. As for selling, we’re going to pass for the time being since getting caught on the wrong side of weekly flow will not do your account any favors!
Levels to watch/ live orders:
- Buys: Watch for offers at 1.0000 to be consumed and then look to trade any retest seen thereafter (confirmation required).
- Sells: Flat (Stop loss: N/A).
DOW 30
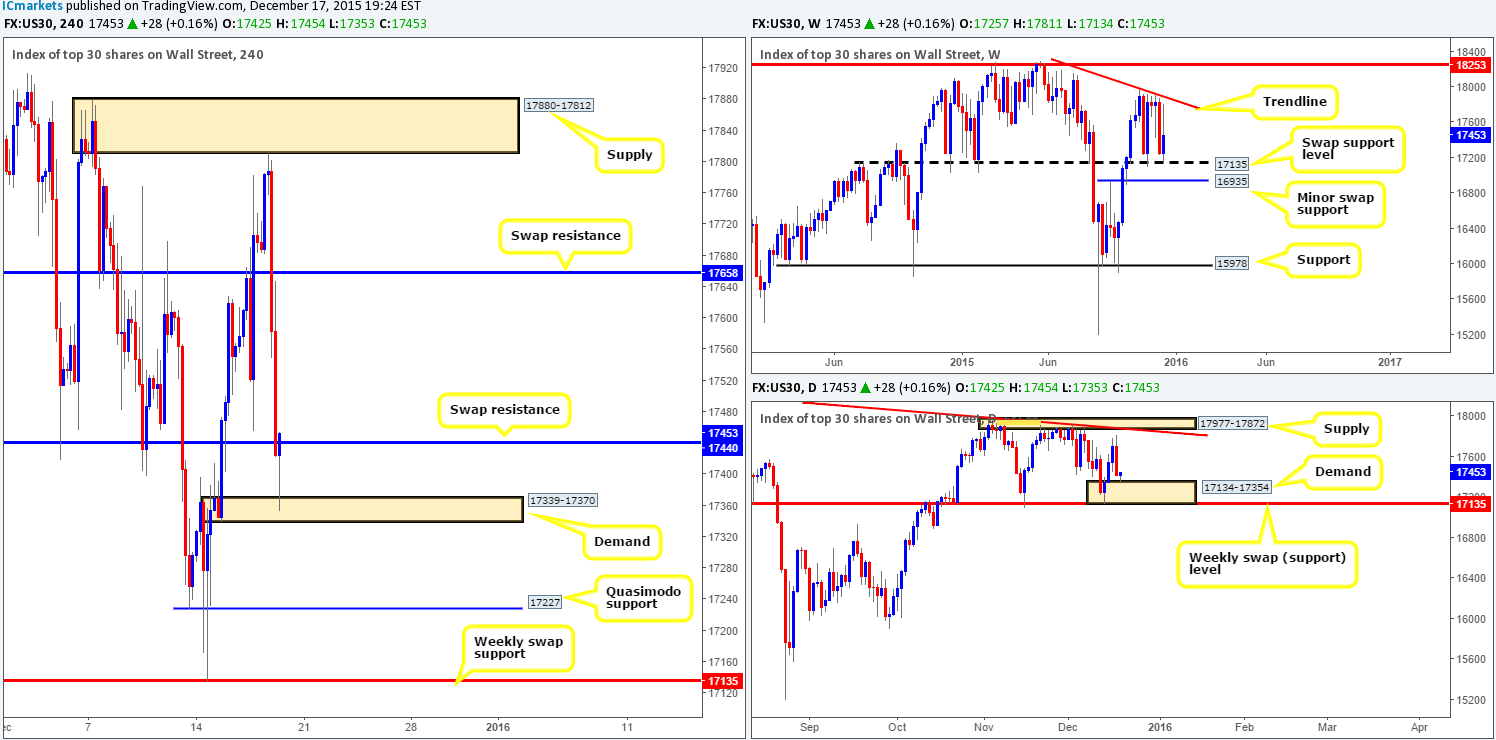
After price shook hands with H4 supply at 17880-17812 yesterday, the DOW sold off in aggressive fashion early on in the American session. This, as you can see, took out bids from both 17658 and 17440 before nudging into a small H4 demand drawn from 17339-17370.
The reaction from this demand thus far has been impressive, and considering that this area converges nicely with a daily demand at 17134-17354, it’s possible this market may continue rallying today. However, for us to become buyers in this market, a close above and retest of the recently broken support (now resistance) level at 17440 would need to be seen for us to begin looking for a confirmed entry into this market.
Should the above come to fruition, we’ll be eyeing the H4 swap (resistance) level above at 17658 as our immediate take-profit target.
Levels to watch/ live orders:
- Buys: Watch for offers at 17440 to be consumed and then look to trade any retest seen thereafter (confirmation required).
- Sells: Flat (Stop loss: N/A).


