Waiting for lower timeframe confirmation is our main tool to confirm strength within higher timeframe zones, and has really been the key to our trading success. It takes a little time to understand the subtle nuances, however, as each trade is never the same, but once you master the rhythm so to speak, you will be saved from countless unnecessary losing trades. The following is a list of what we look for:
- A break/retest of supply or demand dependent on which way you’re trading.
- A trendline break/retest.
- Buying/selling tails/wicks – essentially we look for a cluster of very obvious spikes off of lower timeframe support and resistance levels within the higher timeframe zone.
We typically search for lower-timeframe confirmation between the M15 and H1 timeframes, since most of our higher-timeframe areas begin with the H4. Stops are usually placed 1-3 pips beyond confirming structures.
EUR/USD:
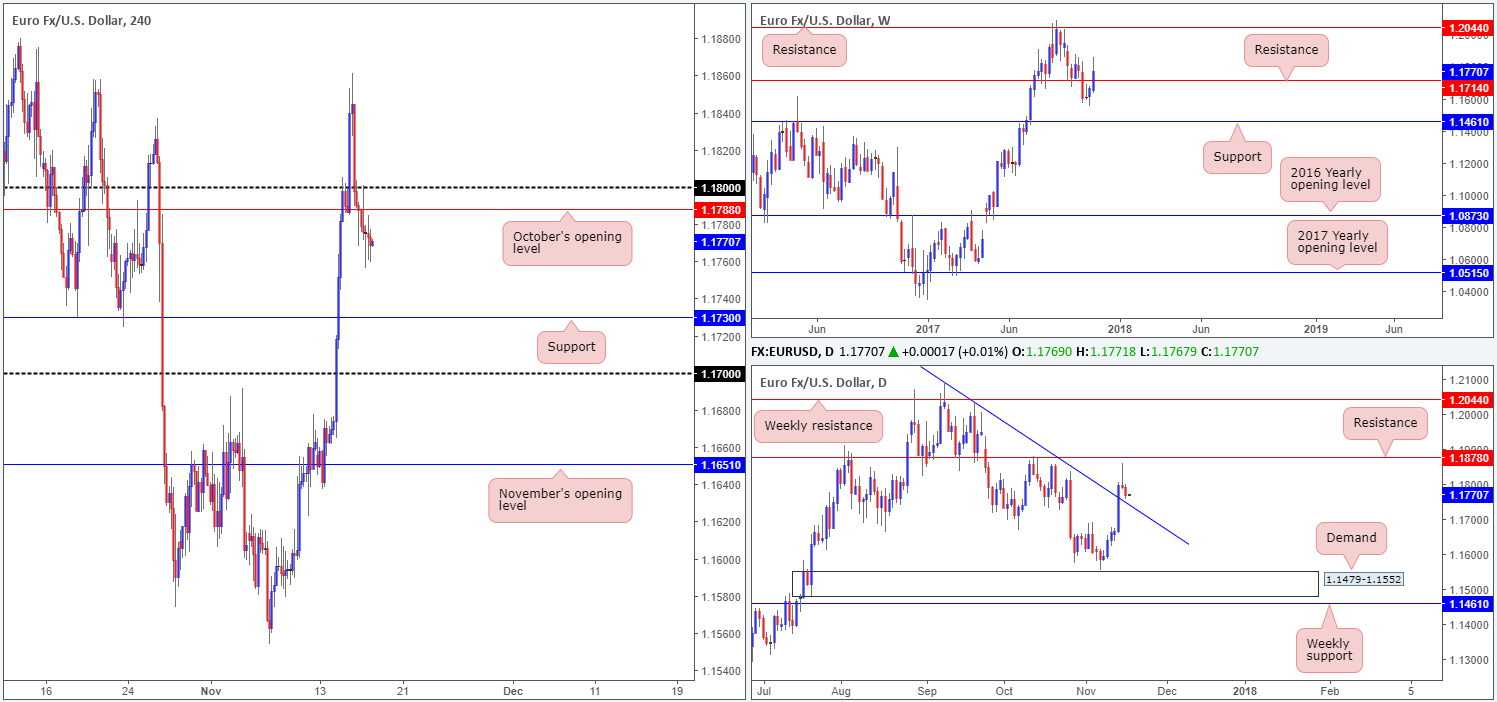
The shared currency employed more of a subtle approach during the course of Thursday’s sessions, consolidating sub October’s opening level at 1.1788. According to H4 structure, price is trading with a reasonably strong bias to the downside at the moment, as there’s room seen for the market to drop as far south as the H4 support at 1.1730, followed closely by the 1.17 hurdle. The problem with this is that daily structure shows there’s a trendline support positioned nearby (taken from the high 1.2092). What's more, weekly price remains trading above weekly resistance at 1.1714. For that reason, we’re wary of shorts right now.
Looking at the buy side of this market, we have our eye on the aforementioned H4 support. 1.1730 is located nearby the recently engulfed weekly resistance at 1.1714, which could act as support. Additionally, the H4 barrier intersects nicely with the aforesaid daily trendline support.
Suggestions: The H4 support is, therefore, appealing for a long trade. Though, we would strongly advise waiting for additional confirmation before pulling the trigger. The core reason behind this is simply due to the nearby 1.17 handle likely being a magnet for price.
Data points to consider: ECB President Draghi speaks at 8.30am; German Buba President Weidmann speaks at 1pm; US housing figures at 1.30pm GMT.
Levels to watch/live orders:
- Buys: 1.1730 region ([waiting for a reasonably sized H4 bullish candle to form – preferably a full or near-full-bodied candle – is advised] stop loss: ideally beyond the candle’s tail).
- Sells: Flat (stop loss: N/A).
GBP/USD:
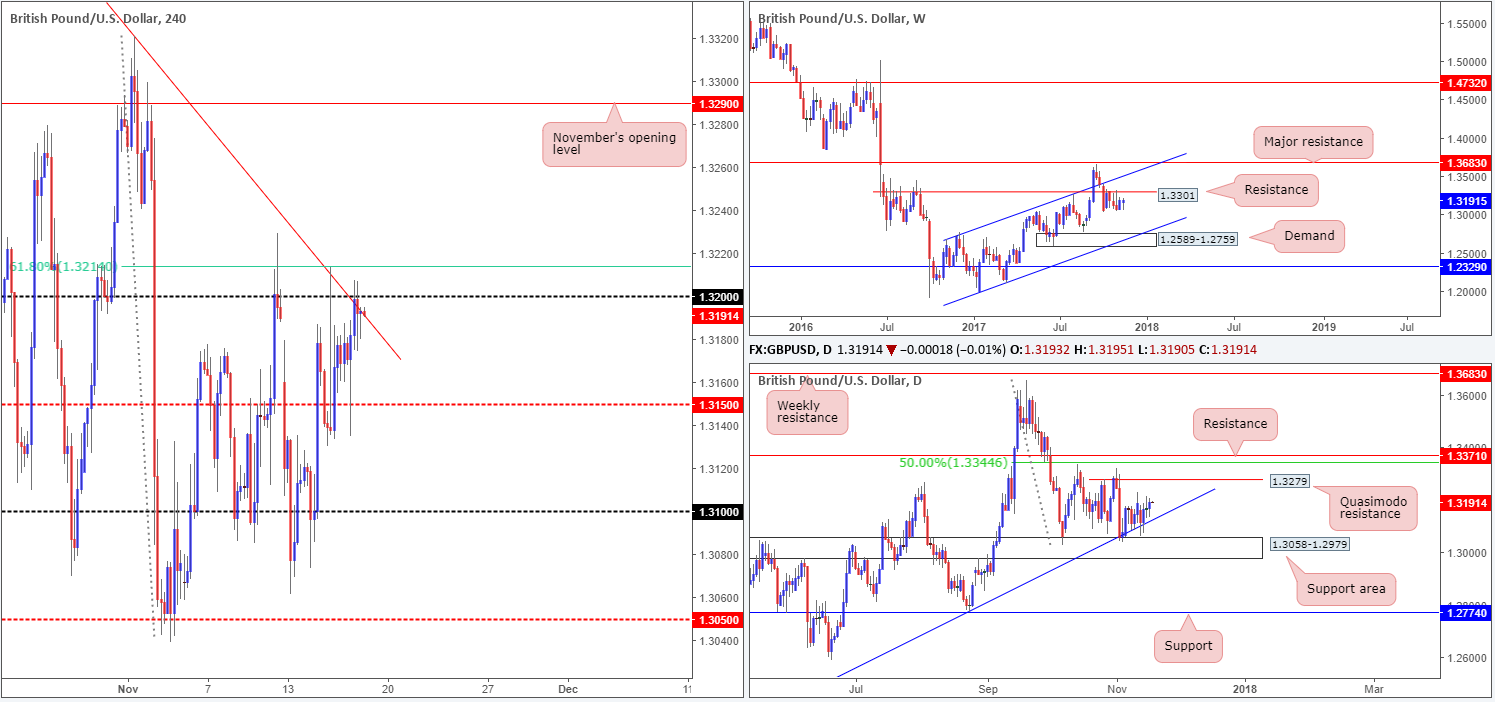
Although Thursday’s action gained traction during early London on the back of better-than-expected UK retail sales data, it was not enough to outmuscle bears around the 1.32 neighborhood. Converging with a steep H4 trendline resistance extended from the high 1.3657 and a 61.8% H4 Fib resistance at 1.3214, the H4 candles ended the day closing a few pips beneath 1.32.
Over on the weekly timeframe, we can see that the British pound has been consolidating beneath a resistance level at 1.3301 since early October. Capping downside in this market, however, is a daily trendline support extended from the low 1.2108 and a daily support area coming in at 1.3058-1.2979. One other thing to keep in mind here is the fact that the market, at least from current price on the daily scale, displays room to rally as far north as 1.3279: a daily Quasimodo resistance line.
Suggestions: With buyers looking reasonably strong around 1.32 right now, attempting to sell from this region is not advised. Despite this, looking for longs above 1.32 is also a risky play, considering we have weekly sellers holding beneath 1.3301. In view of this, the team has decided to remain flat going into the week’s close.
Data points to consider: US housing figures at 1.30pm GMT.
Levels to watch/live orders:
- Buys: Flat (stop loss: N/A).
- Sells: Flat (stop loss: N/A).
AUD/USD:
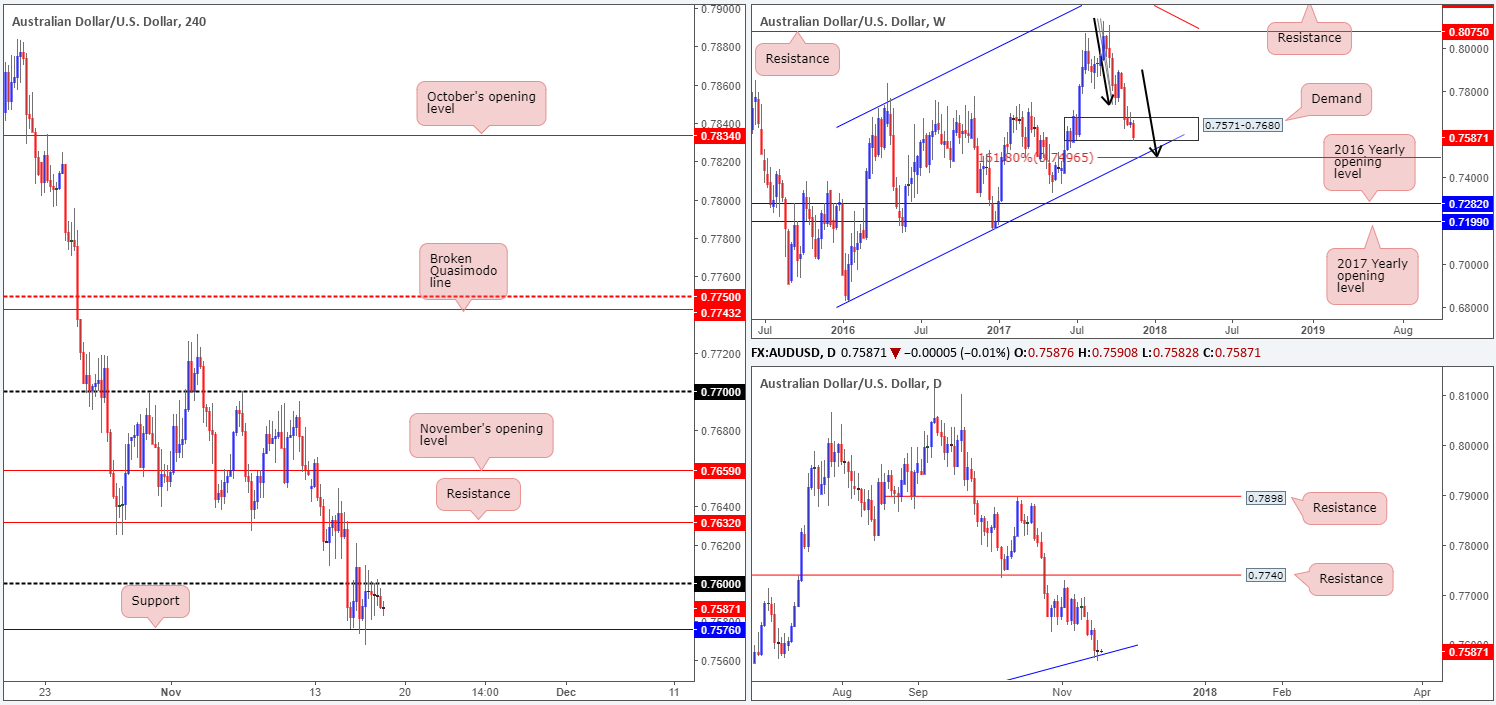
AUD/USD prices are effectively unchanged this morning. The H4 candles, as you can see, remain confined between the 0.76 handle and a H4 support coming in at 0.7576. Weekly demand at 0.7571-0.7680 remains in play, but appears fragile given how deep price is trading right now. In the event that this area gives way, the next downside target can be seen at 0.7496: a weekly AB=CD 161.8% Fib ext. that aligns beautifully with a weekly channel support etched from the low 0.6827. Meanwhile, down on the daily timeframe, there is a trendline support drawn from the low 0.7159 bolstering price at the moment. Notice yesterday’s indecision candle.
Suggestions: Although the current weekly demand looks extremely vulnerable, it’d be unwise to ignore it. This is especially true considering that there’s a daily trendline support currently in motion as well, as the H4 support mentioned above at 0.7576. However, to buy this market is tricky with 0.76 positioned so close. Even with a push above 0.76, however, there’s not much room to play with as H4 resistance is planted at 0.7632. With this being the case, opting to stand on the sidelines may be the better path to take today.
Data points to consider: US housing figures at 1.30pm GMT.
Levels to watch/live orders:
- Buys: Flat (stop loss: N/A).
- Sells: Flat (stop loss: N/A).
USD/JPY:
In recent trading, the USD/JPY peaked at 113.33 during the early hours of London, and later whipsawed through the 113 handle to end the day at 113.04. Yesterday’s action, as can be seen on the daily timeframe, printed an inverted hammer candle around the top edge of demand at 112.29-112.92. Although this is considered to be a bullish signal, traders might want to note where price is trading from! On the weekly timeframe, we can see that the bears remain in the driving seat after selling off from supply fixed at 115.50-113.85.
Suggestions: Neither a long nor short seems appropriate right now. Initiating a trade around the 113 hurdle would, at least in our opinion, be an unnecessary risk given the conflict of opinion being seen on the bigger picture. As a result, our desk will likely remain on the sidelines and look to reassess structure going into Monday’s opening bell.
Data points to consider: US housing figures at 1.30pm GMT.
Levels to watch/live orders:
- Buys: Flat (stop loss: N/A).
- Sells: Flat (stop loss: N/A).
USD/CAD:
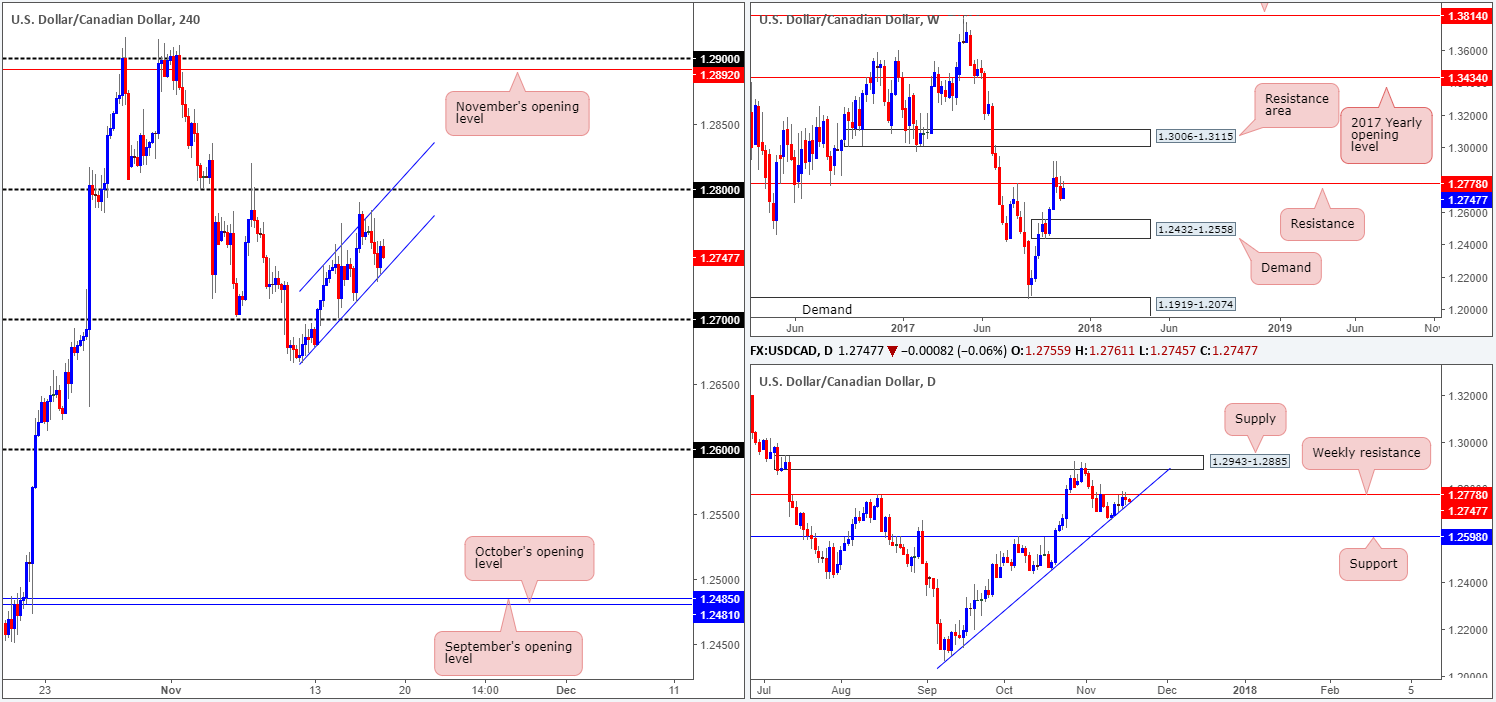
As can be seen from the H4 timeframe this morning, the candles are currently encapsulated within an ascending H4 channel (1.2666/1.2741). Should price continue to climb within this formation, the 1.28 handle is likely the next resistance on the hit list.
Over on the weekly timeframe, the 1.2778 band represents a sturdy weekly resistance level. As a matter of fact, this level was likely the reason price sold off from Wednesday’s peak at 1.2789. While the weekly level boasts a reasonably strong history, the sellers will have to overcome a nearby daily trendline support etched from the low 1.2061. Once this line is consumed, daily structure shows little stopping price from trading as far south as support coming in at 1.2598.
Suggestions: An ideal scenario here would be for H4 price to connect with 1.28 and print a H4 close below the ascending channel formation and daily trendline support. In our book, this is enough to warrant a short, targeting the 1.27 handle, and eventually the 1.26 handle, seeing as it aligns beautifully with the aforementioned daily support.
Data points to consider: US housing figures and CAD inflation data at 1.30pm GMT.
Levels to watch/live orders:
- Buys: Flat (stop loss: N/A).
- Sells: Looking to sell from the 1.28 neighborhood, but not before we see a H4 close below the current daily trendline support.
USD/CHF:
Trade update: took a hit at 0.9915 on a short from 0.9896.
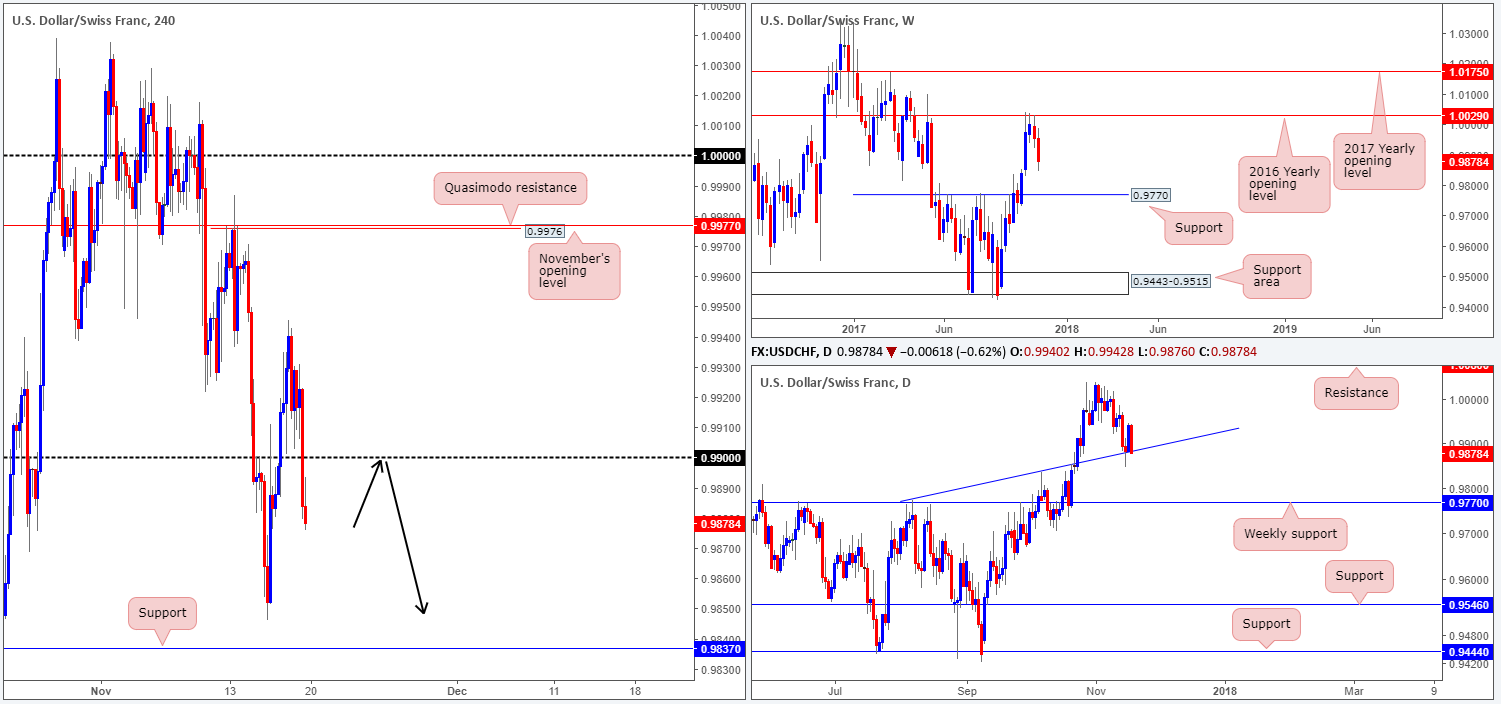
The USD/CHF was among the strongest performers on Thursday, bidding price above the 0.99 handle and back into the walls of a H4 descending channel formation (1.0037/0.9939). From a technical standpoint, the move was likely bolstered by the daily trendline support extended from the high 0.9773.
The next upside target on the H4 timeframe can be seen at 0.9976: a Quasimodo resistance that is positioned nearby the upper channel and parity (1.0000). Also worthy of attention is the weekly timeframe. The 2016 yearly opening level at 1.0029 has been holding the Swissie lower since late October.
Suggestions: We like the look of the H4 Quasimodo resistance for shorts, but feel this may be a tad chancy given that the unit may be drawn to parity. Having said that though, parity is also at risk of a fakeout due to the 2016 yearly opening level seen on the weekly chart lurking only 30 pips above it!
In light of the above structure, the team has decided to remain on the sidelines for the time being.
Data points to consider: US housing figures at 1.30pm GMT.
Levels to watch/live orders:
- Buys: Flat (stop loss: N/A).
- Sells: Flat (stop loss: N/A).
DOW 30:
US equities snapped its two-day losing streak on Thursday, as the index surged. After chalking up several nice-looking H4 buying tails around the H4 support area at 23261-23297, price strongly broke through offers surrounding November’s opening level at 23392. The unit mildly pared losses going into the closing bell as price struggled to breach the collection of local H4 resistances circled in green at 23481/23468.
In the event that price prints a pullback and revisits November’s opening line today, a buy from here could be an option. Besides fusing nicely with a 38.2% H4 Fib support at 23394, both the weekly and daily timeframes show little resistance on the horizon.
Suggestions: Wait for H4 price to retest 23392 and pull the trigger if, and only if, a H4 bullish rotation candle forms (a full or near-full-bodied candle). The initial take-profit target, should the trade come to fruition, will be the H4 supply zone seen at 23579-23556.
Data points to consider: US housing figures at 1.30pm GMT.
Levels to watch/live orders:
- Buys: 23392 region ([waiting for a reasonably sized H4 bullish candle to form – preferably a full or near-full-bodied candle – is advised] stop loss: ideally beyond the candle’s tail).
- Sells: Flat (stop loss: N/A).
GOLD:
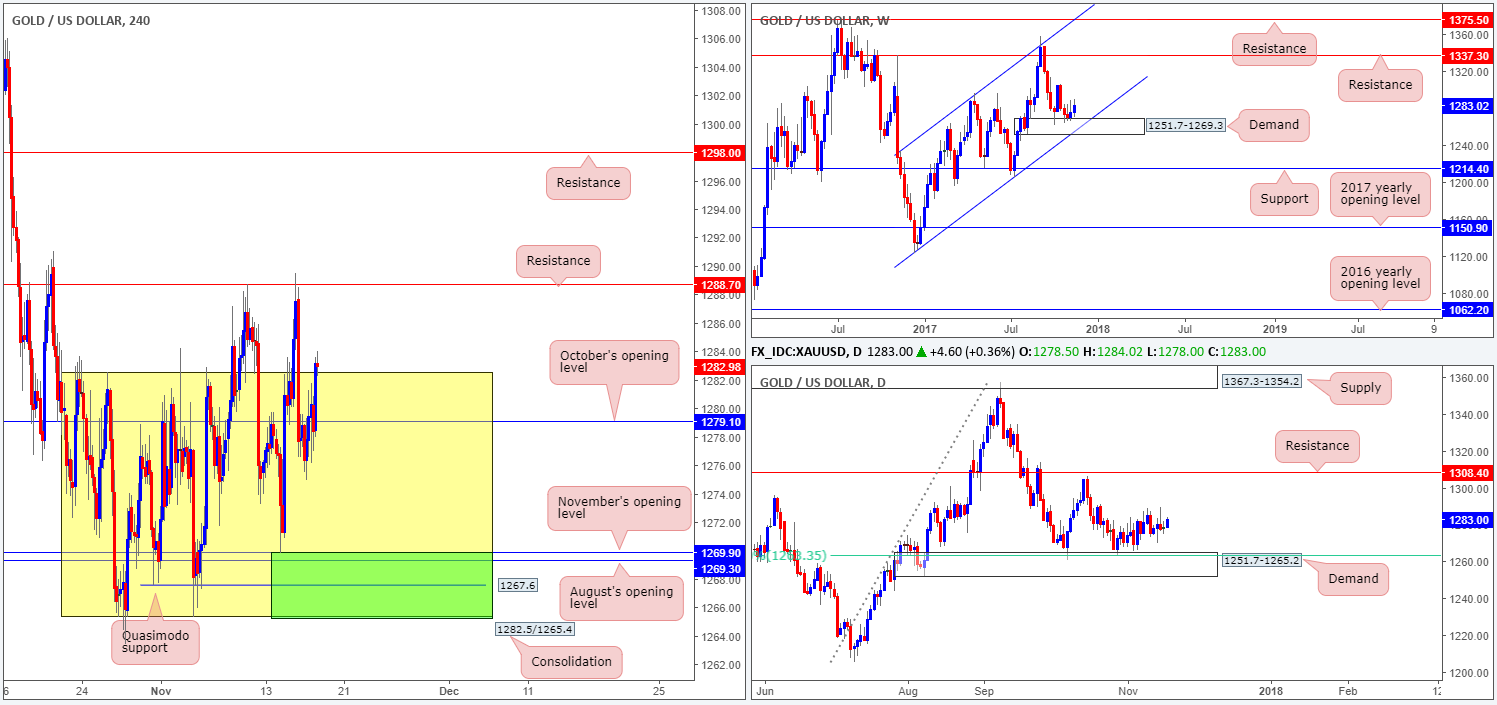
Gold failed to hold sub October’s opening level at 1279.1 on Thursday, and is now seen trading back above the upper H4 range edge at 1282.5. Assuming that the edge holds as support, the next barrier in the spotlight will be a H4 resistance pegged at 1288.7. Despite weekly price trading from weekly demand at 1251.7-1269.3, we need to see H4 price breach 1288.7 before we can become buyers in this market.
Suggestions: Beyond 1288.7, upside is somewhat free until the H4 resistance at 1298.0. Therefore, a trade beyond 1288.7 is high probability as long as the H4 candles retest 1288.7 as support and holds for an entry.
Levels to watch/live orders:
- Buys: Watch for H4 price to engulf 1288.7 and then look to trade any retest seen thereafter ([waiting for a reasonably sized H4 bullish candle to form following the retest – preferably a full or near-full-bodied candle – is advised] stop loss: ideally beyond the candle’s tail).
- Sells: Flat (stop loss: N/A).


