A note on lower timeframe confirming price action…
Waiting for lower timeframe confirmation is our main tool to confirm strength within higher timeframe zones, and has really been the key to our trading success. It takes a little time to understand the subtle nuances, however, as each trade is never the same, but once you master the rhythm so to speak, you will be saved from countless unnecessary losing trades. The following is a list of what we look for:
- A break/retest of supply or demand dependent on which way you’re trading.
- A trendline break/retest.
- Buying/selling tails/wicks – essentially we look for a cluster of very obvious spikes off of lower timeframe support and resistance levels within the higher timeframe zone.
- Candlestick patterns. We tend to stick with pin bars and engulfing bars as these have proven to be the most effective.
We search for lower timeframe confirmation between the M15 and H1 timeframes, since most of our higher-timeframe areas begin with the H4. Stops are usually placed 3-5 pips beyond confirming structures.
EUR/USD:
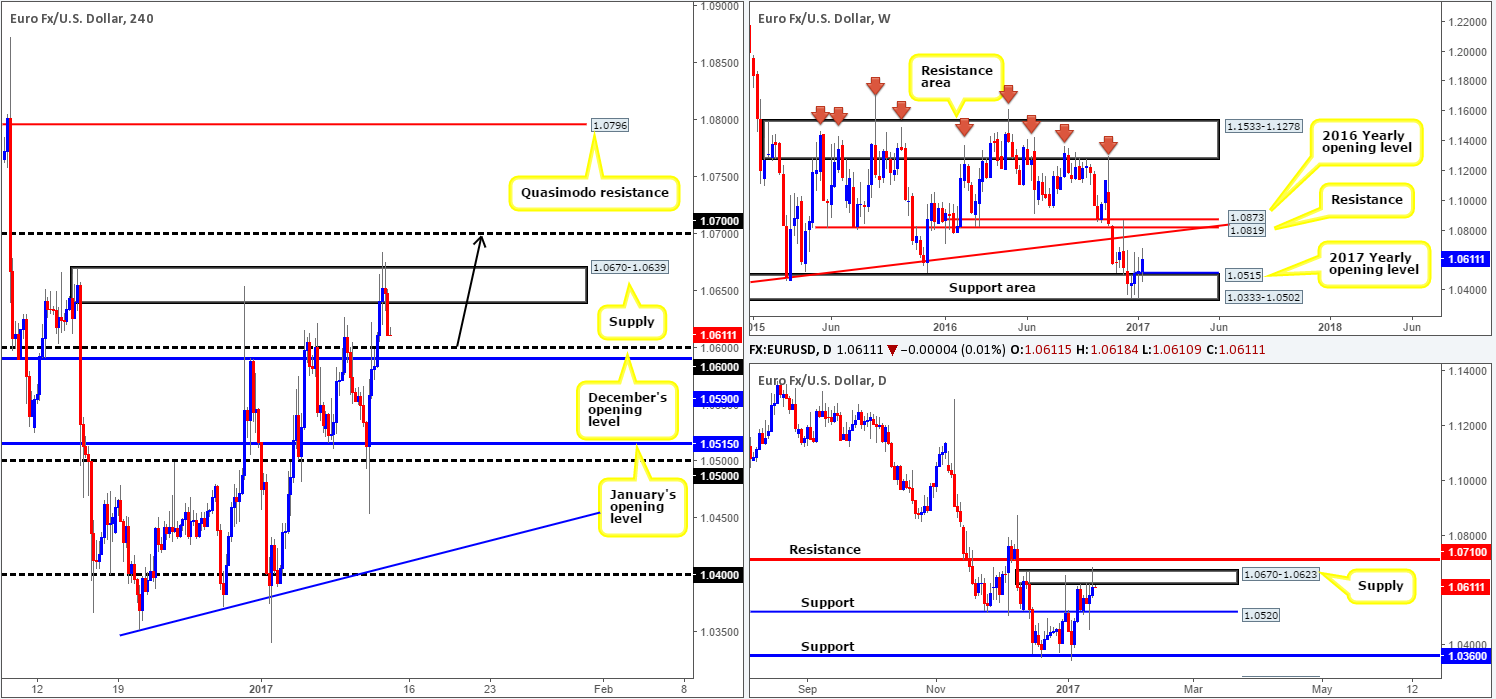
During the early hours of yesterday’s Asia session the single currency gravitated north. As can be seen from the H4 chart, this movement wiped out December’s opening level at 1.0590 and also neighboring psychological level 1.06. Shortly after, the market pierced through the top edge of H4 supply at 1.0670-1.0639 (chalking up three beautiful H4 selling wicks), and subsequently dipped to lows of 1.0632 on the day.
From our perspective, the pendulum certainly looks to be swinging toward more of a rally today. December’s opening level and partnering round number is an area of interest this morning. Here’s why: buy stops have likely been triggered beyond both the current H4 supply and partner daily supply at 1.0670-1.0623, thus increasing the likelihood for a move up to the 1.07 band on the H4 chart. This – coupled with the weekly chart showing upside space to long-term weekly trendline resistance extended from the low 0.8231, makes 1.0590/1.06 a likely area of support to bounce the major today.
Our suggestions: Quite simply, keep a tab on the 1.0590/1.06 H4 zone for possible long opportunities today. Ideally, we’d like to see the lower-timeframe candle action print a buy setup before committing to a trade here (see the top of this report). This should help avoid any fakeout through this zone, which, in our opinion, is highly likely to be seen given how small the area is.
Data points to consider: Fed Chair Janet Yellen speaks at 12am, US retail sales and PPI readings scheduled for release at 1.30pm, FOMC member Harker speaks at 2.30pm, US consumer sentiment data at 3pm GMT.
Levels to watch/live orders:
- Buys: 1.0590/1.06 region ([lower-timeframe confirmation is required here before a trade can be executed] stop loss: depends on where one confirms the zone).
- Sells: Flat (stop loss: N/A).
GBP/USD:
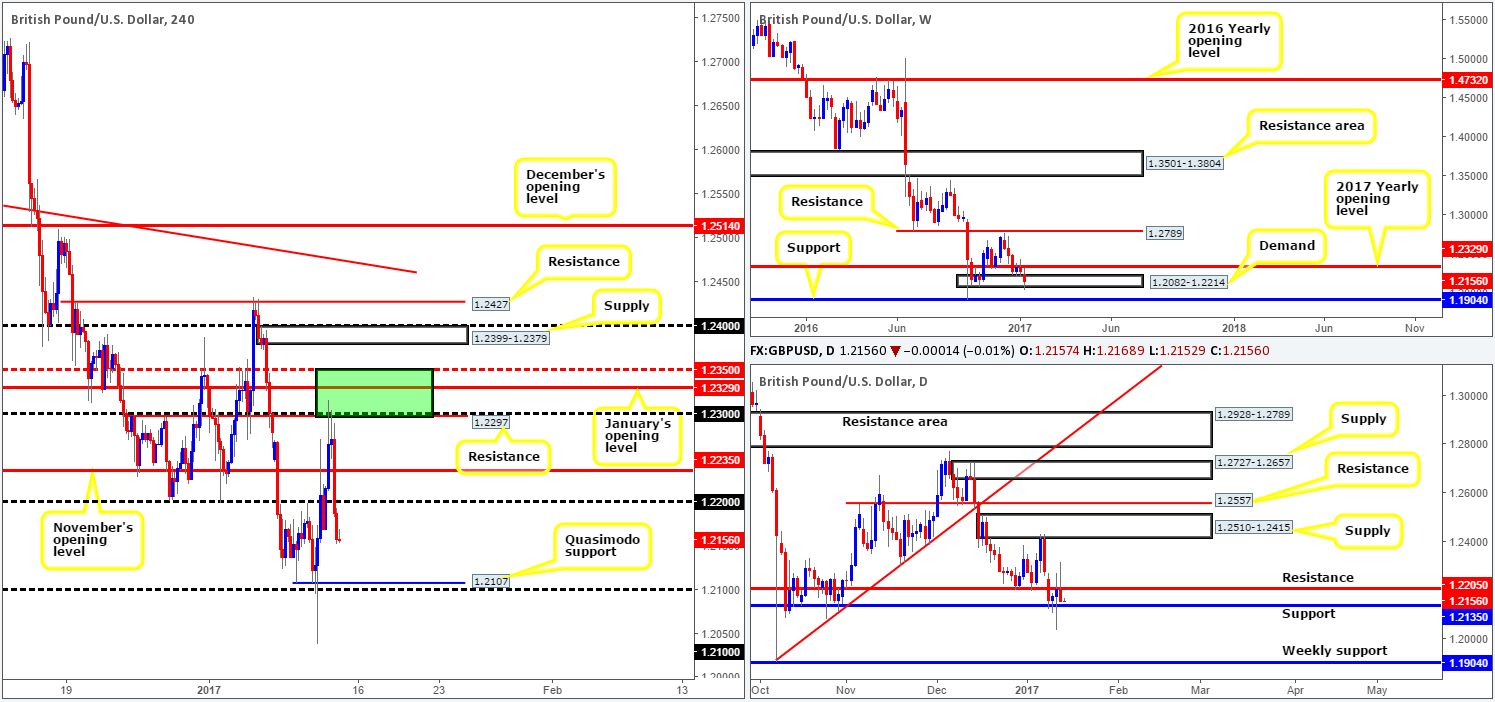
As wrote in Thursday’s report, we believed that there was a good chance that price would eventually rally to shake hands with the H4 (green) sell zone (the H4 mid-way resistance 1.2350, January’s opening level at 1.2390, H4 resistance at 1.2297 and the 1.23 handle) in the near future. Evidently, we didn’t expect it to happen the following day! The response seen from this H4 area was, in our view, a thing of beauty. Well done to any of our readers who managed to jump aboard this train before it departed!
Going forward, sterling looks to be on course to visit the 1.21 hurdle today. Before this can be achieved, nevertheless, daily support at 1.2135 will need to be consumed. Furthermore, let’s also remember that weekly action currently occupies a weekly demand base seen at 1.2082-1.2214.
Our suggestions: Personally, the only area that really stands out this morning is the H4 Quasimodo support at 1.2107, which, as you can see, is shadowed closely by the psychological band 1.21. Although the 1.21 region is positioned within the above said weekly demand, this weekly area was recently breached so it could very well be vulnerable right now. For that reason, a long at market from 1.21 is out of the question. Waiting for either a reasonably sized H4 bull candle to form or a lower-timeframe buy setup (see the top of this report) is, in our opinion, a much safer approach.
Data points to consider: MPC member Saunders speaks at 9.30am. Fed Chair Janet Yellen speaks at 12am, US retail sales and PPI readings scheduled for release at 1.30pm, FOMC member Harker speaks at 2.30pm, US consumer sentiment data at 3pm GMT.
Levels to watch/live orders:
- Buys: 1.21 region ([confirmation is required here before a trade can be executed] stop loss: depends on where one confirms the zone).
- Sells: Flat (stop loss: N/A).
AUD/USD:
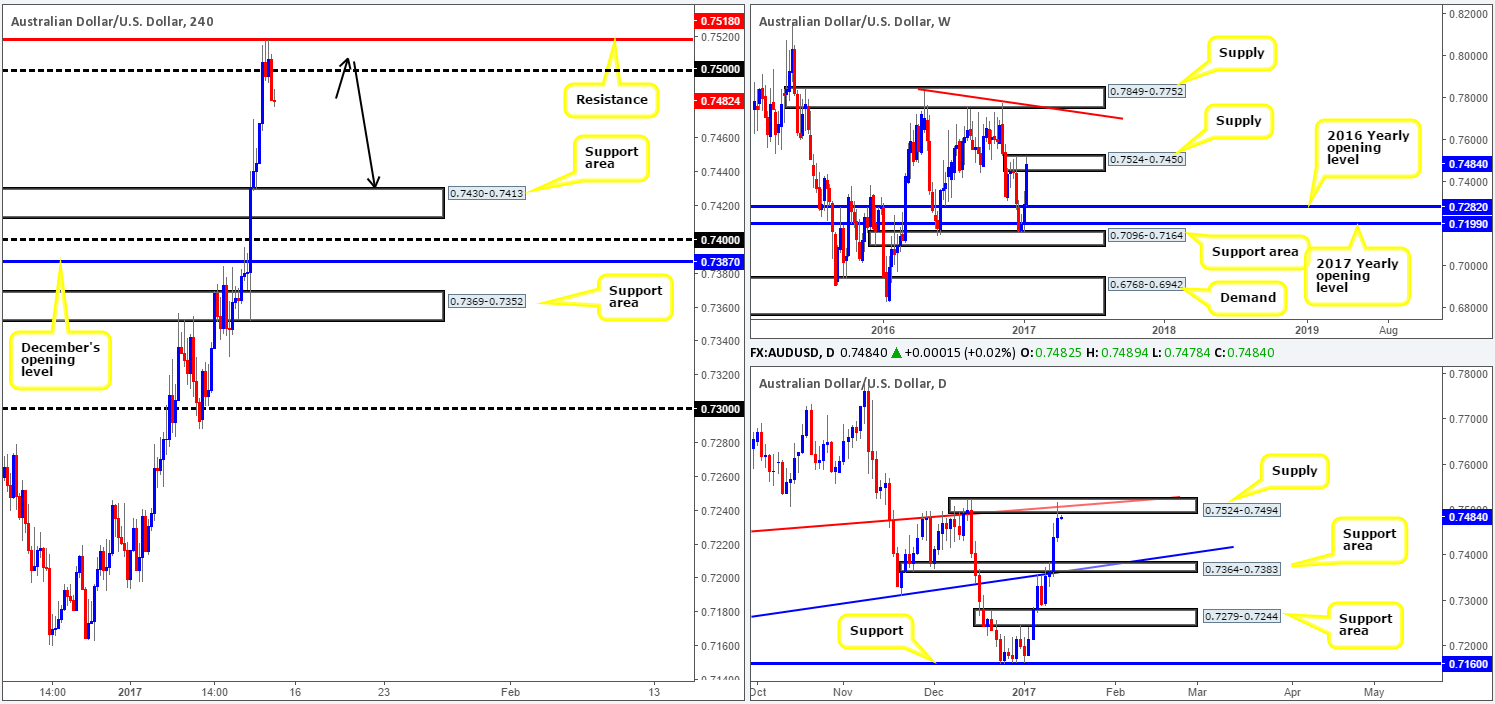
Following Wednesday’s close above H4 supply at 0.7430-0.7413, yesterday’s Asia segment saw the unit retest the top edge of this area as support and register bullish intent (seen clearer on the H1). Fueled by strong commodity prices, the Aussie aggressively rallied against its US counterpart, consequently surpassing the 0.75 handle and touching gloves with H4 resistance coming in at 0.7518.
The response seen from this H4 resistance level should not really come as much of a surprise to technicians who subscribe to multi-timeframe analysis. Not only does the H4 hurdle inhabit the upper extremes of a weekly supply area at 0.7524-0.7450, it also coincides well with daily supply at 0.7524-0.7494 that fuses with a daily trendline resistance taken from the low 0.7407.
Our suggestion: Based on the current structure of this market, the path of least resistance is south. As a result, what our team has their beady little eye on today is a pullback to 0.7518/0.75 for a possible sell trade (as per the black arrows). Ultimately, before we look to short we’d want to see evidence of seller interest in the form of a reasonably sized H4 bearish candle.
Data points to consider: Chinese trade balance (tentative release time). Fed Chair Janet Yellen speaks at 12am, US retail sales and PPI readings scheduled for release at 1.30pm, FOMC member Harker speaks at 2.30pm, US consumer sentiment data at 3pm GMT.
Levels to watch/live orders:
- Buys: Flat (stop loss: N/A).
- Sells: 0.7518/0.75 ([reasonably sized H4 bearish candle will need to form off this zone before a trade can be executed] stop loss: ideally beyond the trigger candle).
USD/JPY:
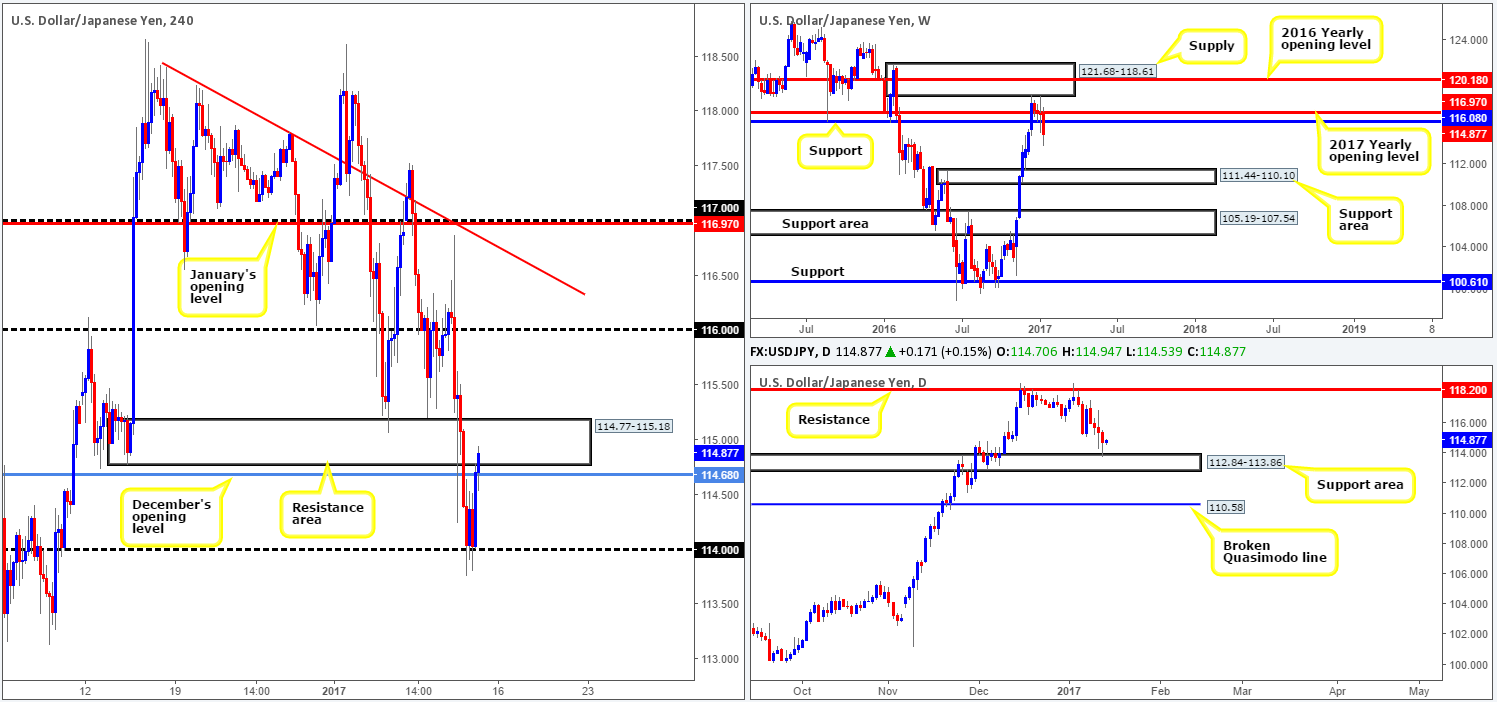
The USD/JPY, as you can see, dropped lower for a fourth consecutive day yesterday. Despite this, the pair managed to find a floor of support around the 114 handle and trim more than half of the day’s losses going into the closing bell. H4 candle action is, at this time, currently seen testing the underside of a recently broken H4 demand base at 114.77-115.18 (now a resistance area). Purely from a technical standpoint, we would not be surprised to see this area hold firm today. The logic behind our thinking comes from seeing the current weekly candle edge below weekly support at 116.08 in recent days, and right now looks to be on course to register a rather dominant bearish close for the week. Should a weekly close come into view, this could set the stage for a fairly substantial move down to the weekly support area coming in at 111.44-110.10. On the other side of the fence, nevertheless, we need to take into consideration that daily movement has recently checked in with a daily support area coming in at 112.84-113.86.
Our suggestions: While daily action is signaling to be wary of shorts at the moment, we favor lower prices in this market given what’s noted on the weekly and H4 charts. Should a H4 bearish close form out of the current H4 resistance area which also pushes below December’s opening level at 114.68, we would look to short with an initial take-profit target set at 114.
Data points to consider: Fed Chair Janet Yellen speaks at 12am, US retail sales and PPI readings scheduled for release at 1.30pm, FOMC member Harker speaks at 2.30pm, US consumer sentiment data at 3pm GMT.
Levels to watch/live orders:
- Buys: Flat (stop loss: N/A).
- Sells: Watch for a H4 close to form beyond December’s opening level at 114.68 before pulling the sell trigger (stop loss: ideally beyond the trigger candle).
USD/CAD:
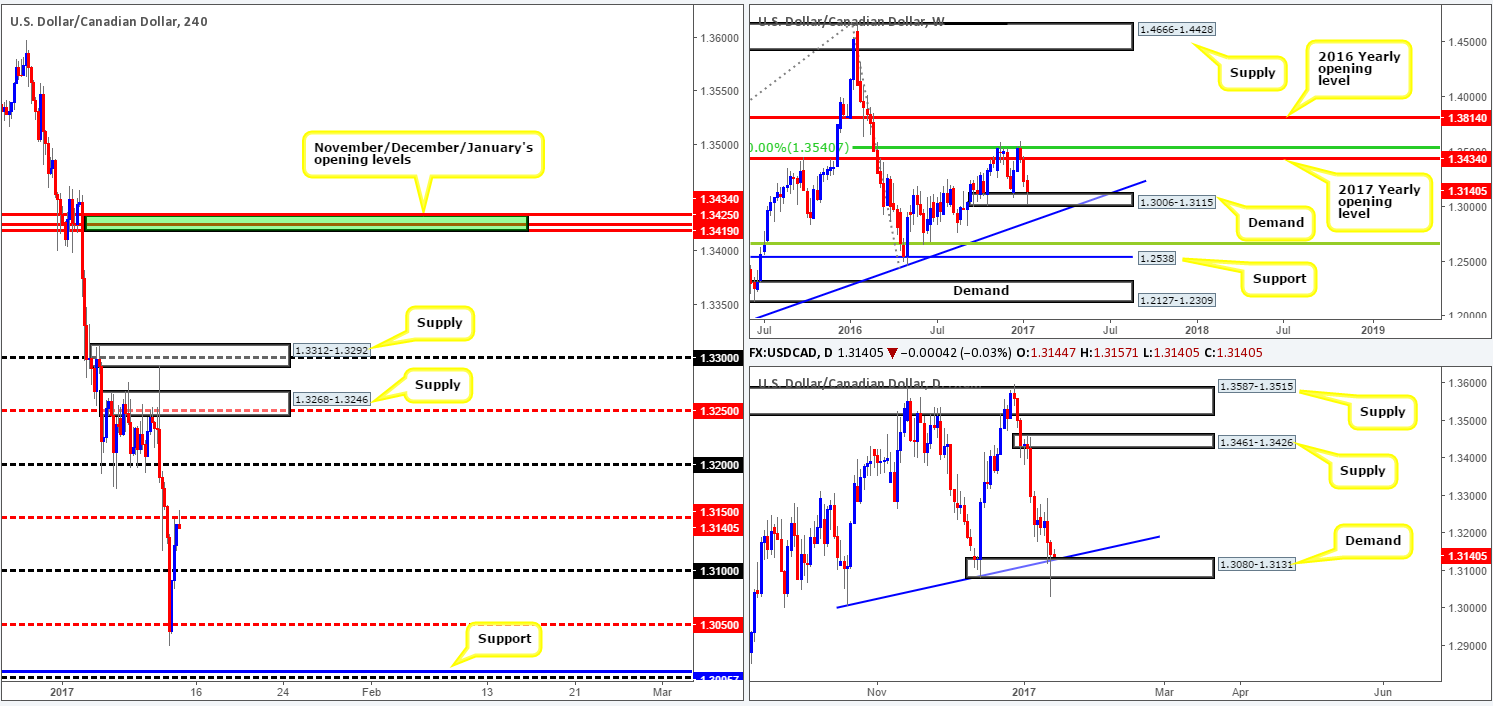
Kicking off this morning’s report with a quick look at the weekly chart shows that the buyers are beginning to establish support from within weekly demand marked at 1.3006-1.3115. A rally from this angle could lead to price retesting the 2017 yearly opening level at 1.3434. Sliding down to the daily chart, yesterday’s movement chalked up a rather dominant bullish pin bar candle that whipsawed through both a daily demand at 1.3080-1.3131 and a trendline support taken from the low 1.3006. Collectively, both timeframes exhibit bullish intentions. However, building a case for entry is challenging when H4 candle action is seen respecting the underside of a H4 mid-way resistance at 1.3150. Ultimately, for our desk to consider becoming buyers in this market a H4 close beyond this barrier will need to be seen.
Our suggestions: Put simply, a H4 close above 1.3150, followed by a retest of this number as support as well as a lower-timeframe confirming buy signal (see the top of this report), would be sufficient enough to place a buy order, targeting the 1.32 handle as an initial take-profit target.
Data points to consider: Fed Chair Janet Yellen speaks at 12am, US retail sales and PPI readings scheduled for release at 1.30pm, FOMC member Harker speaks at 2.30pm, US consumer sentiment data at 3pm GMT.
Levels to watch/live orders:
- Buys: Watch for a H4 close to form above 1.3150 and then look to trade any retest seen thereafter ([lower-timeframe confirmation is required following the retest before a trade can be executed] stop loss: depends on where one confirms the zone).
- Sells: Flat (stop loss: N/A).
USD/CHF:
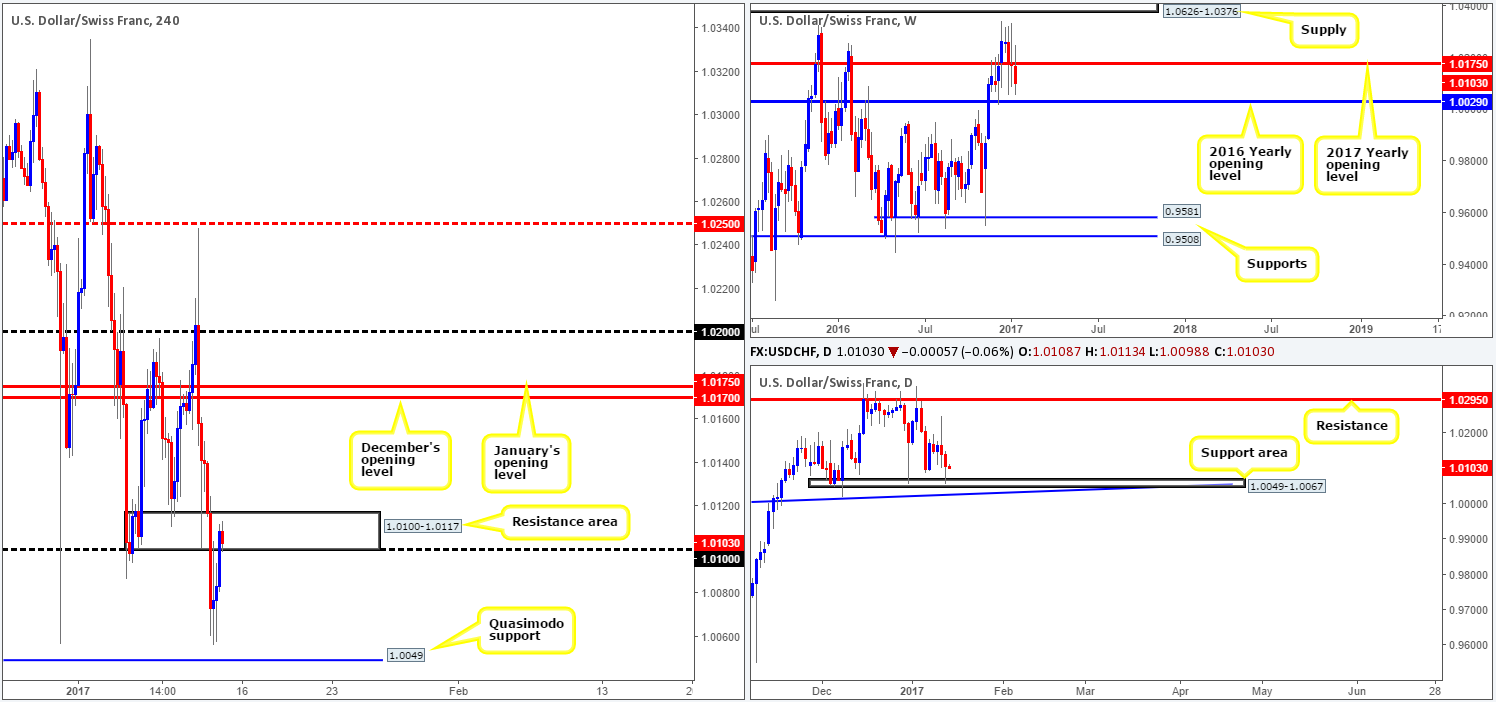
As Europe’s doors opened for business yesterday, the Swissy plummeted lower. The move broke through H4 demand at 1.0100-1.0117 and found support 15 or so pips ahead of the H4 Quasimodo support at 1.0049, shaped by three beautiful-looking buying tails. A large part of the day’s losses were trimmed following this which forced the pair to retest the H4 demand as a resistance area. According to weekly structure, price suggests that there’s space in this market left the unit to drive lower to the 2016 yearly opening level at 1.0029. Yet, in spite of this, the daily candles recently bounced off a small daily support area drawn from 1.0049-1.0067!
Our suggestions: In the event that a H4 bearish candle prints out of the current H4 resistance area and closes below the 1.01 mark, our team would, dependent on the time of day, sell this market with an initial target objective set at 1.0049: the H4 Quasimodo support mentioned above.
Data points to consider: Fed Chair Janet Yellen speaks at 12am, US retail sales and PPI readings scheduled for release at 1.30pm, FOMC member Harker speaks at 2.30pm, US consumer sentiment data at 3pm GMT.
Levels to watch/live orders:
- Buys: Flat (stop loss: N/A).
- Sells: Watch for a H4 close to form below the 1.01 handle before executing a short trade] stop loss: ideally beyond the trigger candle).
DOW 30:
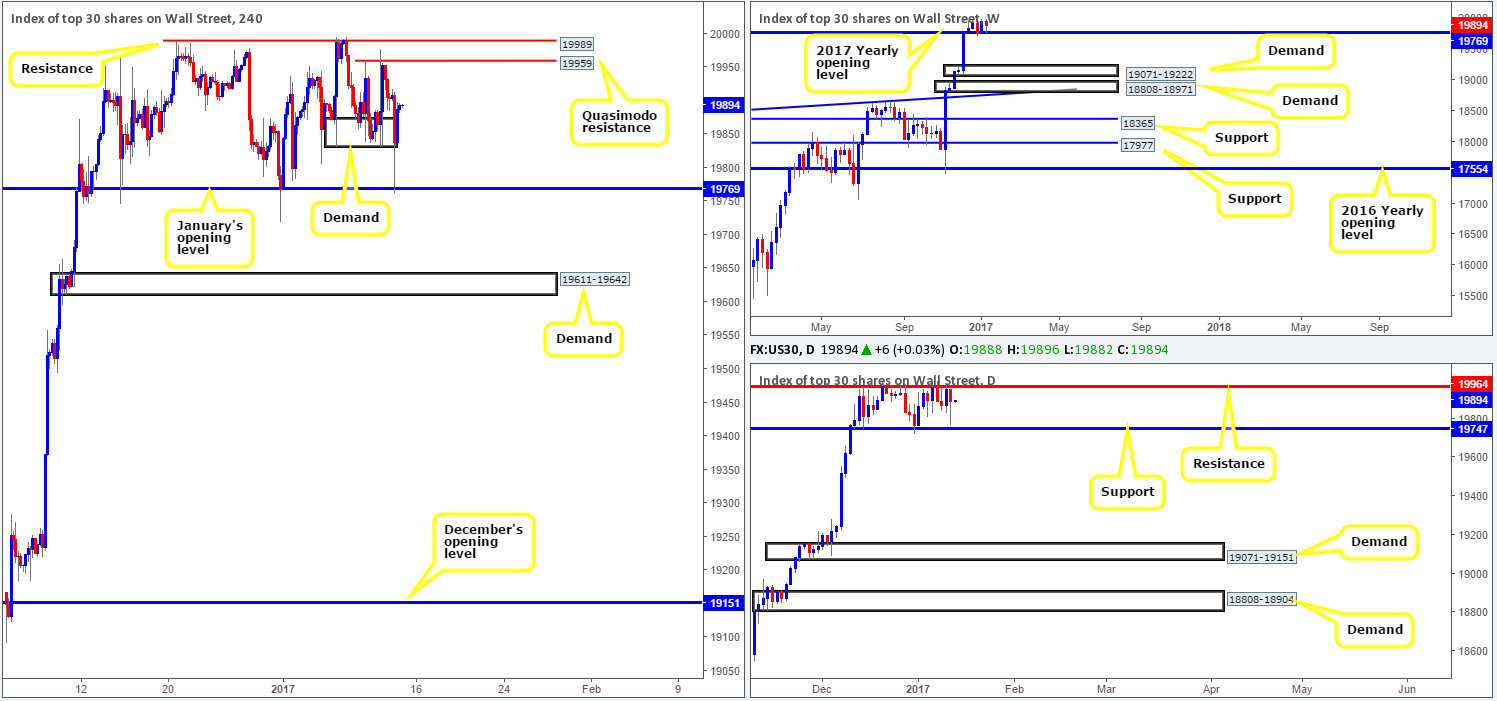
For those who read our previous report on the DOW you may recall that we mentioned H4 action could very well engulf the current H4 demand at 19831-19873 and tap bids around January’s opening level at 19769. As you can see, in this instance we were spot-on with our analysis. Bolstered by a daily support level coming in at 19747, January’s opening baseline held price almost to-the-pip! Well done to any of our readers who managed to bank this move!
Moving forward, the next upside targets seen on the H4 chart fall in around a H4 Quasimodo resistance level at 19959 and a neighboring H4 resistance at 19989. In view of this and the fact that a daily resistance level at 19964 is positioned between the two H4 zones mentioned above, a bearish response from this angle is expected. How much of a response is difficult to judge seeing as how the weekly chart shows little resistance on the horizon.
Our suggestions: Despite weekly action effectively being free to rally north, we feel the H4 sell zone: 19989/19959 is worthy of attention. However, pulling the trigger without any supporting lower-timeframe price action is not something we’d be comfortable with (see the top of this report).
Data points to consider: Fed Chair Janet Yellen speaks at 12am, US retail sales and PPI readings scheduled for release at 1.30pm, FOMC member Harker speaks at 2.30pm, US consumer sentiment data at 3pm GMT.
Levels to watch/live orders:
- Buys: Flat (stop loss: N/A).
- Sells: 19989/19959 ([lower-timeframe confirmation is required before a trade can be executed] stop loss: depends on where one confirms the zone).
GOLD:
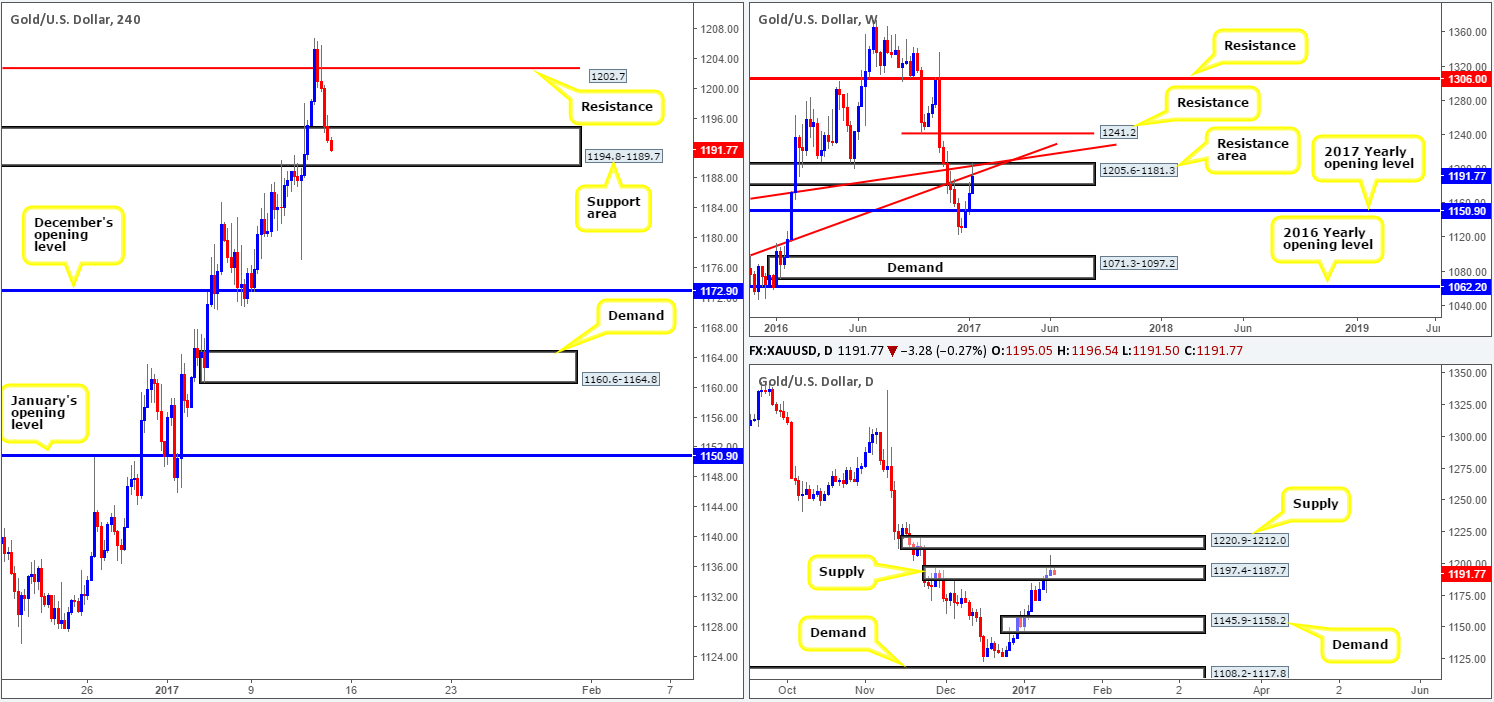
Beginning with the weekly timeframe this morning, we can see that price marginally pierced above the weekly resistance area at 1205.6-1181.3 before snapping back. Not only is this area reinforced by two weekly trendline resistances (1130.1/1071.2), but the chart also shows room for the yellow metal to drop down as far as the 2017 yearly opening level at 1150.9. What this also did was paint a nice-looking daily bearish pin-bar candle that aggressively pierced through the top edge of daily supply logged in at 1197.4-1187.7. From this angle, the next downside objective is likely to be the daily demand base coming in at 1145.9-1158.2.
Stepping across to the H4 chart, a two-candle H4 whipsaw was seen through H4 resistance at 1202.7, which followed-through with a downside move to a H4 support area at 1194.8-1189.7. Before anyone looks to short this market, we would strongly advise waiting for a H4 close to be seen beyond this zone, despite what the bigger picture is suggesting!
Our suggestions: Simply watch and wait for a H4 candle close beyond the current H4 support area and then look to play the retest (with confirmation) should it materialize.
Levels to watch/live orders:
- Buys: Flat (stop loss: N/A).
- Sells: Watch for a H4 close to form below 1194.8-1189.7and then look to trade any retest seen thereafter ([a reasonably sized H4 bearish candle close is required following the retest before a trade can be executed] stop loss: ideally beyond the trigger candle).


