Key risk events:
EU Economic Forecasts; US CPI m/m and Core CPI m/m.
(Previous analysis as well as outside sources – italics).
EUR/USD:
Wednesday had the US dollar index pare Tuesday’s losses, resuming its upward trajectory through 99.00. For the record, Federal Reserve Chairman Jerome Powell aired little regarding the US economy.
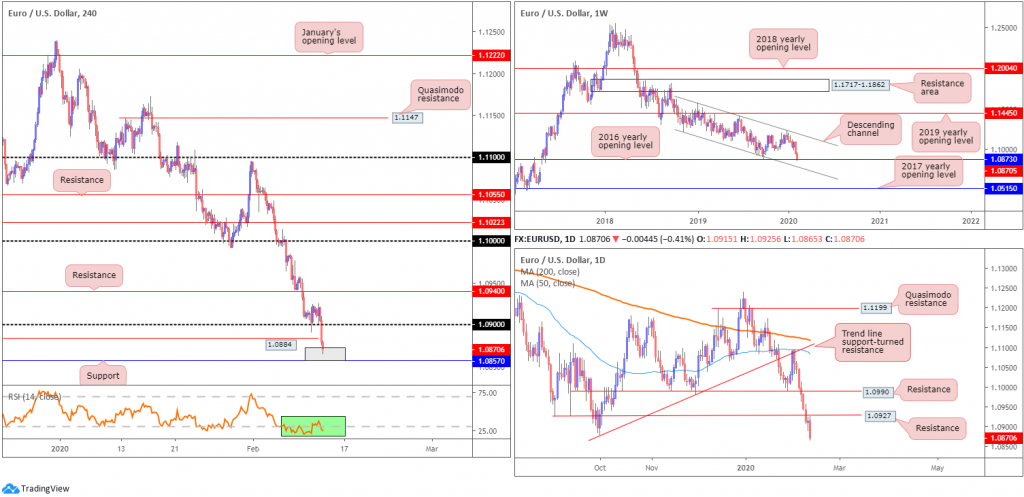
Developments on the technical side watched EUR/USD’s weekly movement shake hands with familiar long-term support at 1.0873, the 2016 yearly opening level. A break of this level would expose channel support, drawn from a low at 1.1109.
A closer reading of price action on the daily timeframe shows the unit nudging through the 1.0879 October 1st low, likely tripping a number of sell stops from those long this market and sellers attempting the breakout.
Across the page on the H4 timeframe, support at 1.0884 was taken out in recent hours, consequently revealing support pencilled in at 1.0857. Indicator-based traders might also be interested to note the relative strength index (RSI) has remained within oversold waters since February 6th.
Areas of consideration:
The combination of weekly support at 1.0873, H4 support coming in at 1.0857 (grey H4 zone) and sell-stop liquidity south of the 1.0879 October 1st low (daily timeframe), is likely enough to induce a recovery today, with the possibility of reclaiming 1.09+ status and running for daily resistance at 1.0927.
Conservative traders will likely watch for signs of buyer intent on the H4 timeframe before committing to a position. This could be something as simple as a hammer candlestick pattern (considered a bullish signal at troughs). Not only does this help identify buyer intent, it also provides entry and risk levels to work with.
GBP/USD:
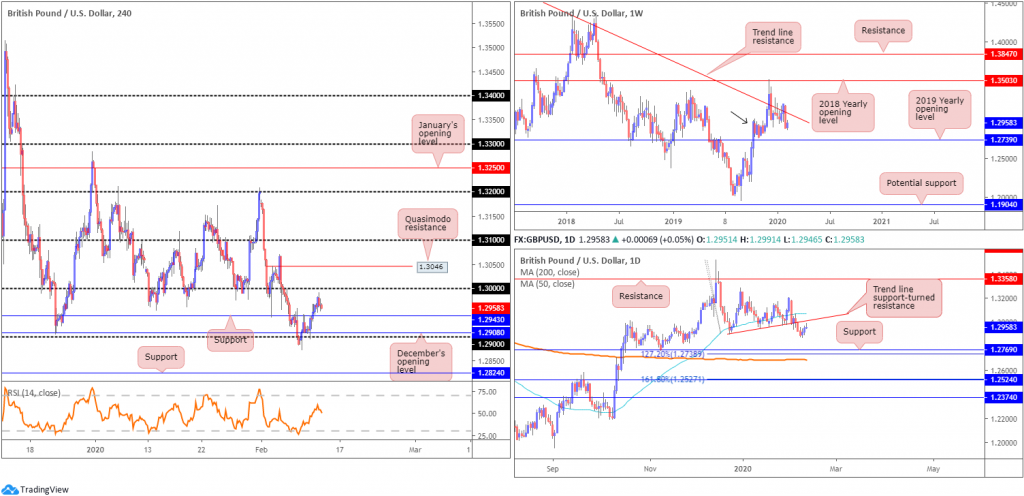
After regrouping north of the 1.29 handle, reinforced by December’s opening level at 1.2908, GBP/USD H4 movement came within a whisker of testing the widely watched 1.30 figure Wednesday. Clocking a session high of 1.2991, the pair dipped to 1.2960s into the close, threatening to revisit nearby support at 1.2943.
From the weekly timeframe, price action trades beneath long-standing trend line resistance, pencilled in from the high 1.5930, though demand around the 1.2939 region is also still in motion (black arrow). Continued downside may imply a break of the said demand, tripping sell stops and testing the 2019 yearly opening level at 1.2739.
From the daily timeframe, trend line support-turned resistance, taken from the low 1.2904, is next in the firing range in the event of further sterling upside. This is closely followed by the 50-day SMA (blue – 1.3070). A reversal to the downside, on the other hand, sets the stage for a run to support fixed at 1.2769, a 127.2% Fibonacci extension at 1.2738 and the 200-day SMA (orange – 1.2688). Note the said SMA has been flattening since mid-October 2019.
Areas of consideration:
A retest at local H4 support from 1.2943 may develop today, targeting 1.30 and possibly the daily trend line resistance. Traders looking for shorts off 1.30 must contend with the threat of a fakeout to H4 Quasimodo resistance at 1.3046. Therefore, waiting for additional candlestick confirmation might be an option before committing funds to a position.
The accuracy, completeness and timeliness of the information contained on this site cannot be guaranteed. IC Markets does not warranty, guarantee or make any representations, or assume any liability regarding financial results based on the use of the information in the site.
News, views, opinions, recommendations and other information obtained from sources outside of www.icmarkets.com.au, used in this site are believed to be reliable, but we cannot guarantee their accuracy or completeness. All such information is subject to change at any time without notice. IC Markets assumes no responsibility for the content of any linked site.
The fact that such links may exist does not indicate approval or endorsement of any material contained on any linked site. IC Markets is not liable for any harm caused by the transmission, through accessing the services or information on this site, of a computer virus, or other computer code or programming device that might be used to access, delete, damage, disable, disrupt or otherwise impede in any manner, the operation of the site or of any user’s software, hardware, data or property.


