Release time: Friday at 13.30pm GMT/08.30am EST.
- US employment figures provide an irreplaceable insight into the condition of the world’s largest economy. It’s considered a leading indicator of consumer spending, which drives the economy.
- The combination of the indicator’s importance and swift reporting generally makes for sizable market moves.
- Stronger-than-expected figures, values that surprise, typically favour a dollar bid. Conversely, weak numbers tend to favour downside in the dollar.
The US Bureau of Labour Statistics, or BLS, expects to announce an additional 160,000 non-farm payrolls to the US economy in January.
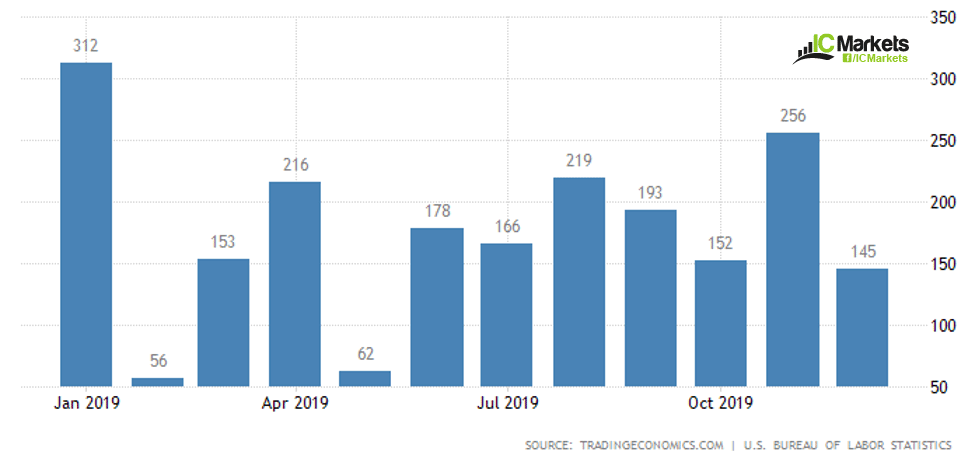
Non-farm payrolls reported an addition of 145,000 in December 2019, following a downwardly revised 256,000 (from 266,000) rise in the previous month and below market expectations of 162,000. The 3-month average stands at 184k, running beneath the 6-month value at 189k, though both remain above the 12-month average at 176k.
The US unemployment rate held steady at 3.5 percent in December 2019, remaining at the lowest level since 1969 and in line with market expectations. Consensus expects the jobless rate to remain at 3.5%, a rate which the Fed’s January projections pencilled in for the end of 2020.
In December, average hourly earnings for all employees on private nonfarm payrolls rose by 3 cents to $28.32. Over the last 12 months, average hourly earnings have increased by 2.9 percent. Consensus has a pick-up to 0.3% month-over-month in January from a pace of 0.1% in December. This is the earliest data related to labour inflation.
Indicators pre-release:
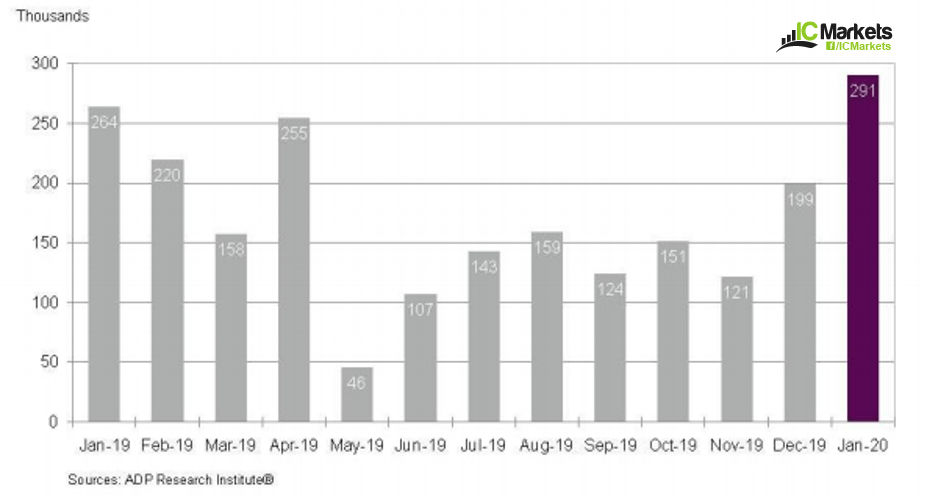
Automatic Data Processing (ADP): Private sector employment increased by 291,000 jobs from December to January according to the January ADP National Employment Report.
ADP is considered a forerunner for Friday’s non-farm payrolls release.
Initial jobless claims:
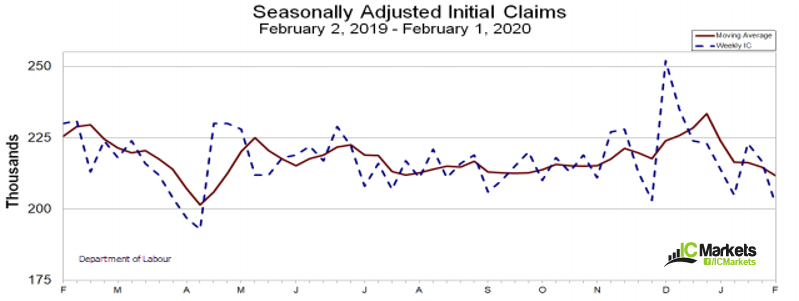
Department of Labour noted: In the week ending February 1, the advance figure for seasonally adjusted initial claims was 202,000, a decrease of 15,000 from the previous week’s revised level. The previous week’s level was revised up by 1,000 from 216,000 to 217,000. The 4-week moving average was 211,750, a decrease of 3,000 from the previous week’s revised average. The previous week’s average was revised up by 250 from 214,500 to 214,750.
Job Openings and Labour Turnover Survey (JOLTS):
Job openings notably decreased in November from 7.36M to 6.8M, the fifth disappointment in the last seven releases.
The US Bureau of Labour Statistics: The number of job openings fell to 6.8 million (-561,000) on the last business day of November. Over the month, hires and separations were little changed at 5.8 million and 5.6 million, respectively.
University of Michigan (UoM) Consumer Sentiment:
Surveys of Consumers chief economist, Richard Curtin:
Consumer sentiment remained at very positive levels, with the January reading of 99.8 insignificantly below the cyclical peak of 101.4. The maintenance of consumer sentiment near cyclical peak levels is surprising given the overall slow pace of economic growth, which was accompanied in January by renewed military engagements in the Mideast, an impeachment trial in the Senate, and a fast spreading coronavirus.
CB consumer survey:
The Conference Board Consumer Confidence Index increased in January, following a moderate increase in December. The Index now stands at 131.6 (1985=100), up from 128.2 (an upward revision) in December. The Present Situation Index – based on consumers’ assessment of current business and labour market conditions – increased from 170.5 to 175.3. The Expectations Index – based on consumers’ short-term outlook for income, business and labour market conditions – increased from 100.0 last month to 102.5 this month.
IC Market’s Technical View:
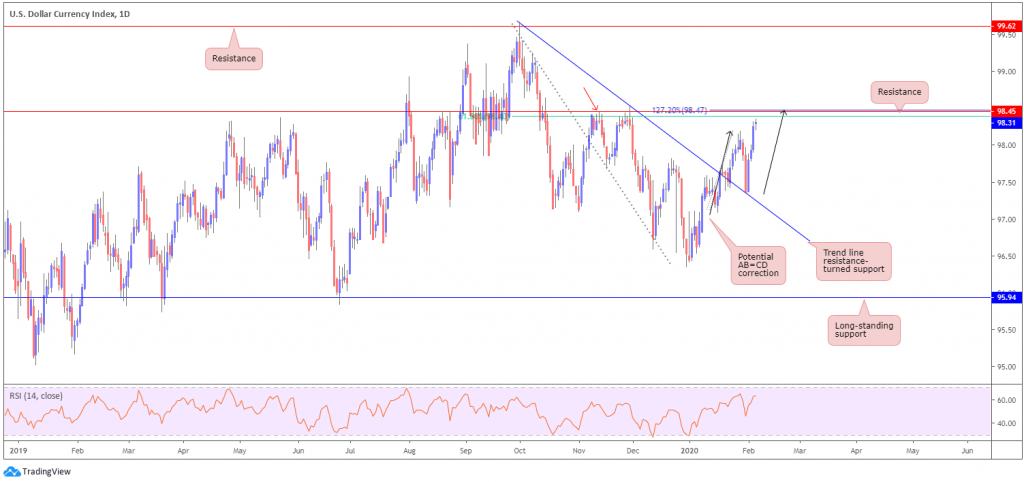
Following a stronger-than-expected rebound off daily trend line resistance-turned support, extended from the high 99.67, the US dollar index, or DXY, has retained a strong bid.
Although on track to register its fourth successive gain Thursday, the index nears notable daily resistance at 98.45. The level also draws in a potential 127.2% AB=CD bearish correction (black arrows) pattern at 98.47, a 61.8% Fibonacci retracement value at 98.40 along with the relative strength index (RSI) nearing overbought. Another aspect worthy of note is the aforementioned daily resistance level represents a Quasimodo resistance (see red arrow which marks the left shoulder).
As a result, active sellers likely reside around the 98.45ish neighbourhood.
Notes:
https://tradingeconomics.com/united-states/non-farm-payrolls
https://www.bls.gov/news.release/empsit.nr0.htm
https://www.dol.gov/sites/dolgov/files/OPA/newsreleases/ui-claims/20200216.pdf
https://www.bls.gov/news.release/jolts.htm
https://www.conference-board.org/data/consumerconfidence.cfm


