Born in 1932, Bill Williams is a US-based trader and the author of a number of books on trading, and also the gentleman behind the Awesome oscillator indicator (AO). In addition to this, Williams is the creator of other well-known technical indicators, such as the Accelerator oscillator, Alligator, Fractals, Gator oscillator and the Market Facilitation Index.
Williams also boasts an impressive 52 years of experience as a stock and commodities trader, and more than 25 years of teaching experience as a trading educator.
The Awesome oscillator, in its simplest form, is a trading indicator calculated to measure market momentum. Comparable to the MACD indicator, the AO is a histogram (by default the histogram forms red and green colours, shown in an additional window on the price chart) designed to gauge market direction by comparing recent market momentum with momentum over a wider frame of reference.
The calculation
Despite its eye-catching name, the AO indicator’s calculation is straightforward:
Calculate the difference between a 34-Period and 5-Period simple moving average, or SMA. Instead of using closing prices, though, the simple moving averages use the midpoints of the bars – midpoint = (H + L)/2.
Applying the Awesome oscillator on MT4
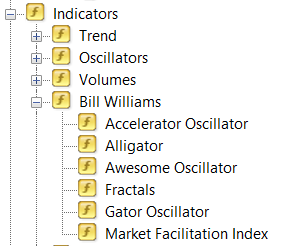
To begin with, traders should select the indicator folder from within their Navigator tab, by which you’ll be presented with four sub-folders: Trend, Oscillators, Volumes and Bill Williams. Yes, Williams has his own folder! As you can see from the snapshot below, all of Williams’ indicators are easily accessible:
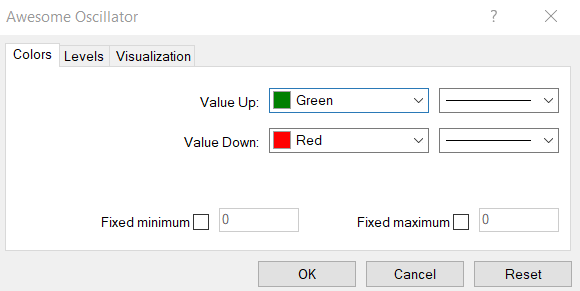
Upon selecting the Awesome Oscillator tab, you’re presented with an additional box. There’s not really much you can amend, though, other than visuals, such as histogram colouring and timeframe visualisation:
Making use of the indicator: trading strategies
The Awesome oscillator produces a number of trading signals, typically pooled together with other converging signals to form a basis for a trading idea.
Zero Line Crossover:
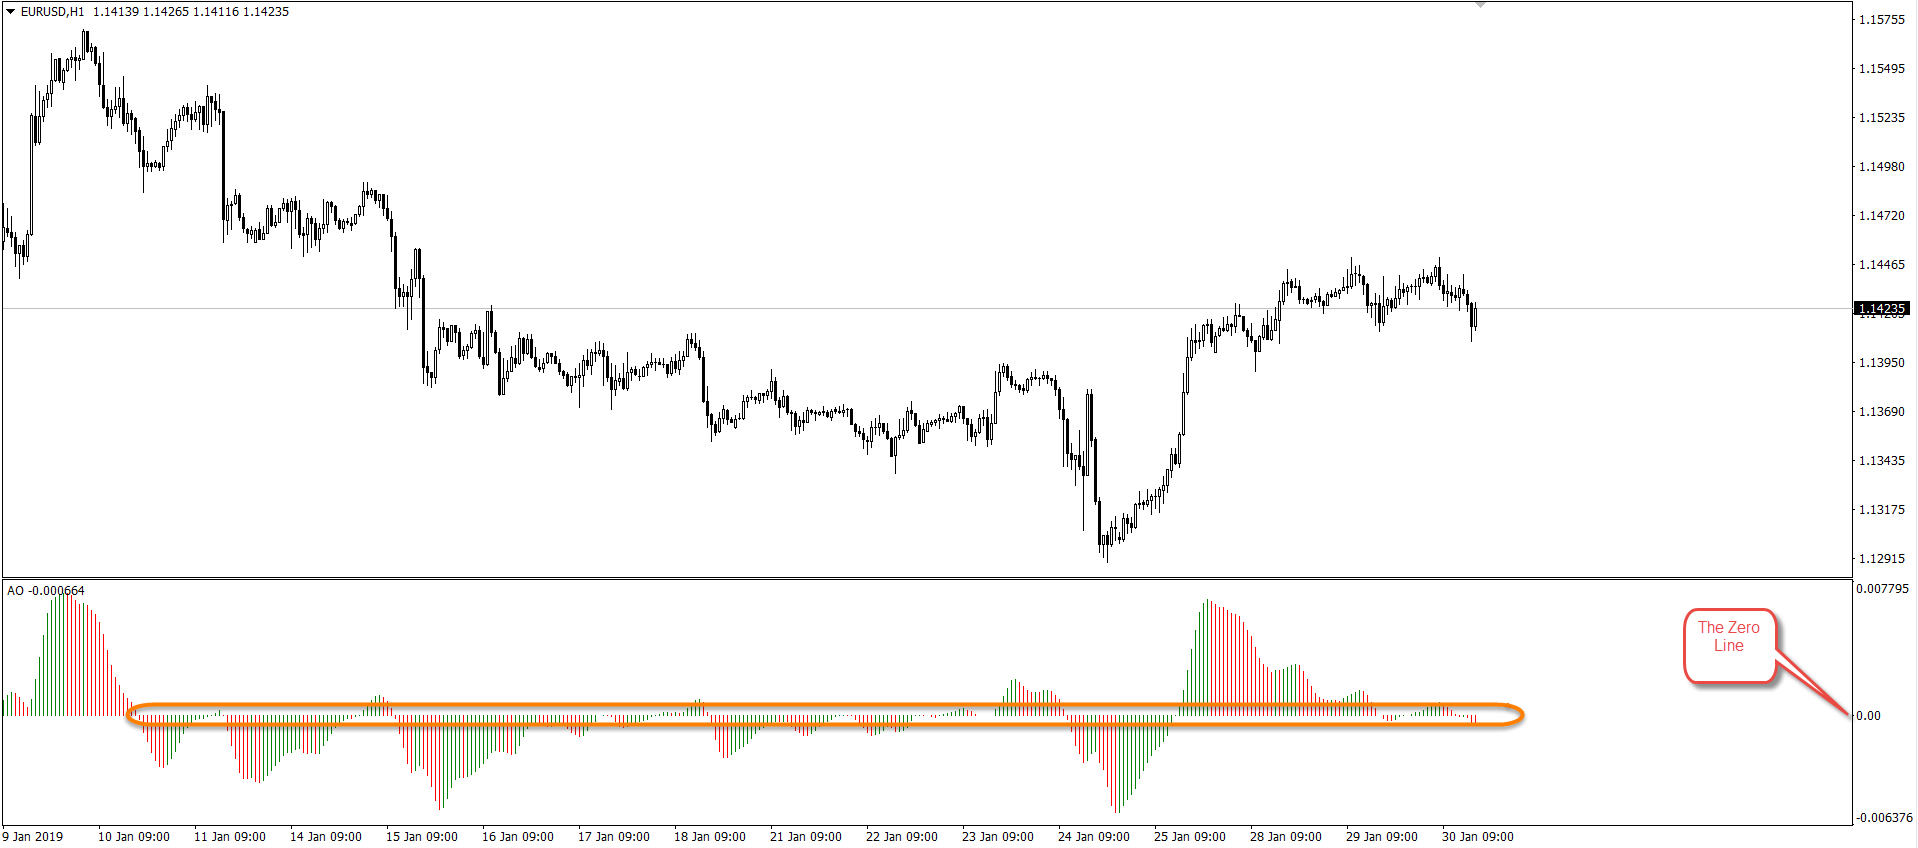
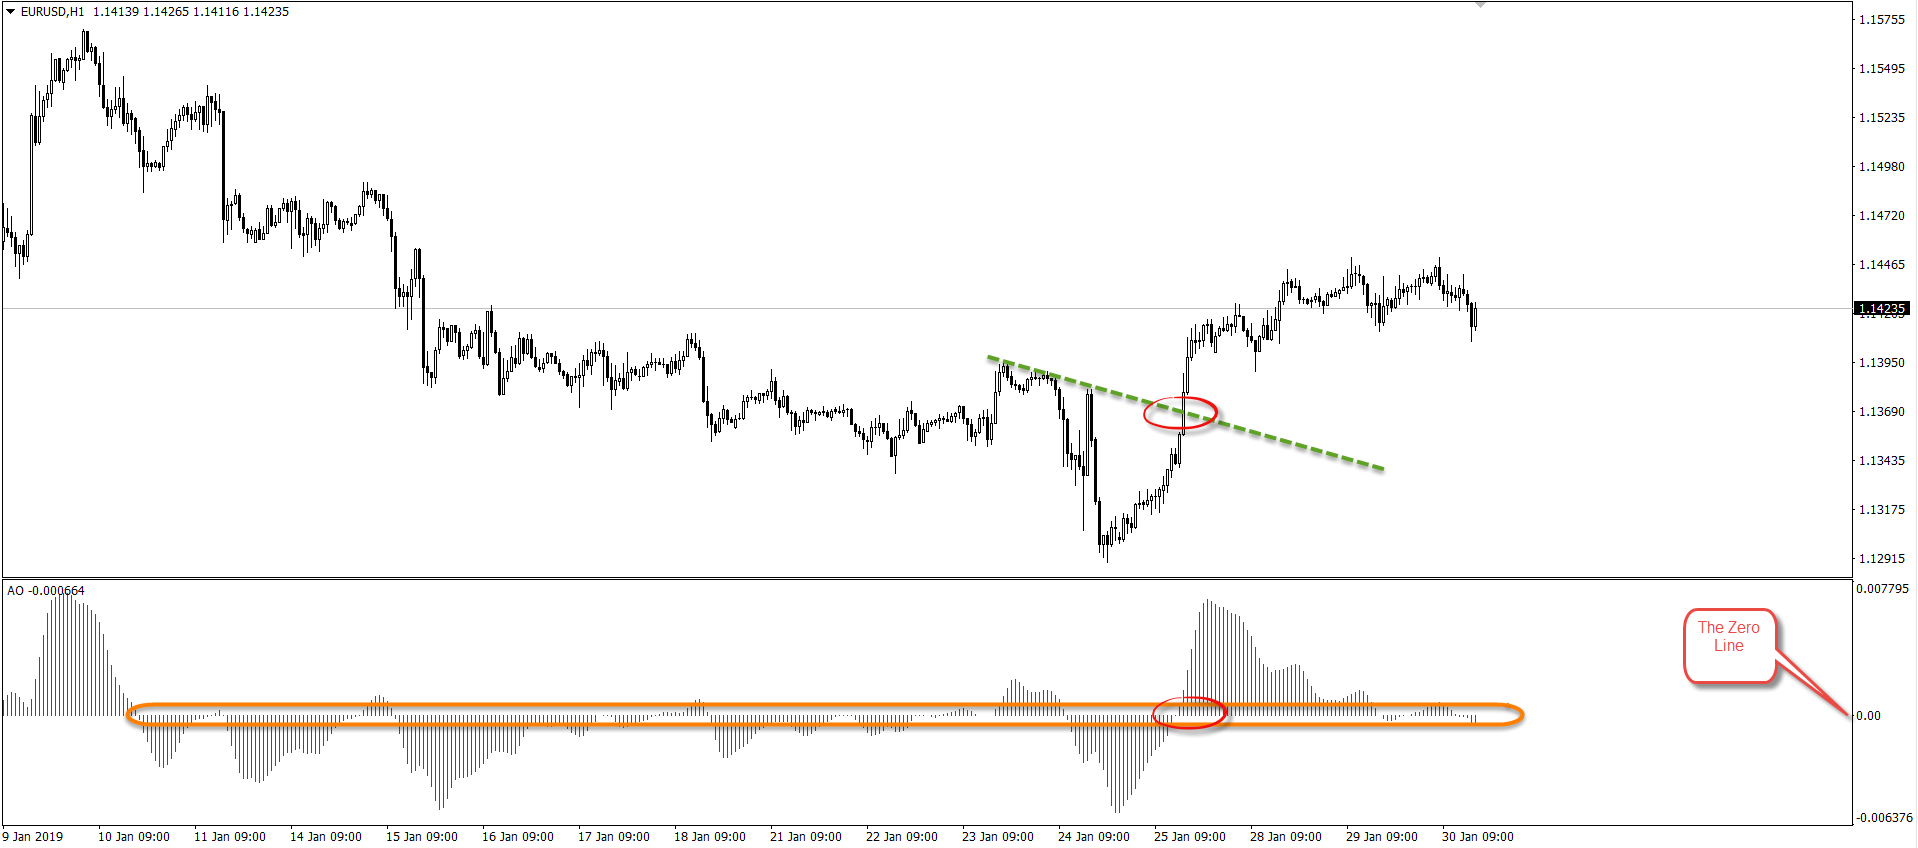
A straightforward signal traders employ to gauge momentum is a ‘crossover’ beyond the zero line. Once the AO crosses above its zero point, this is a bullish signal designed to demonstrate buyer intent. By the same token, an AO crossover beneath the zero line is a bearish signal, showing potential seller intent.
As is evident from the price movement depicted below, relying solely on this method to trade harvests a number of false signals that’d chew up your account in a couple of months should each signal be traded:
Twin Peaks Formation:
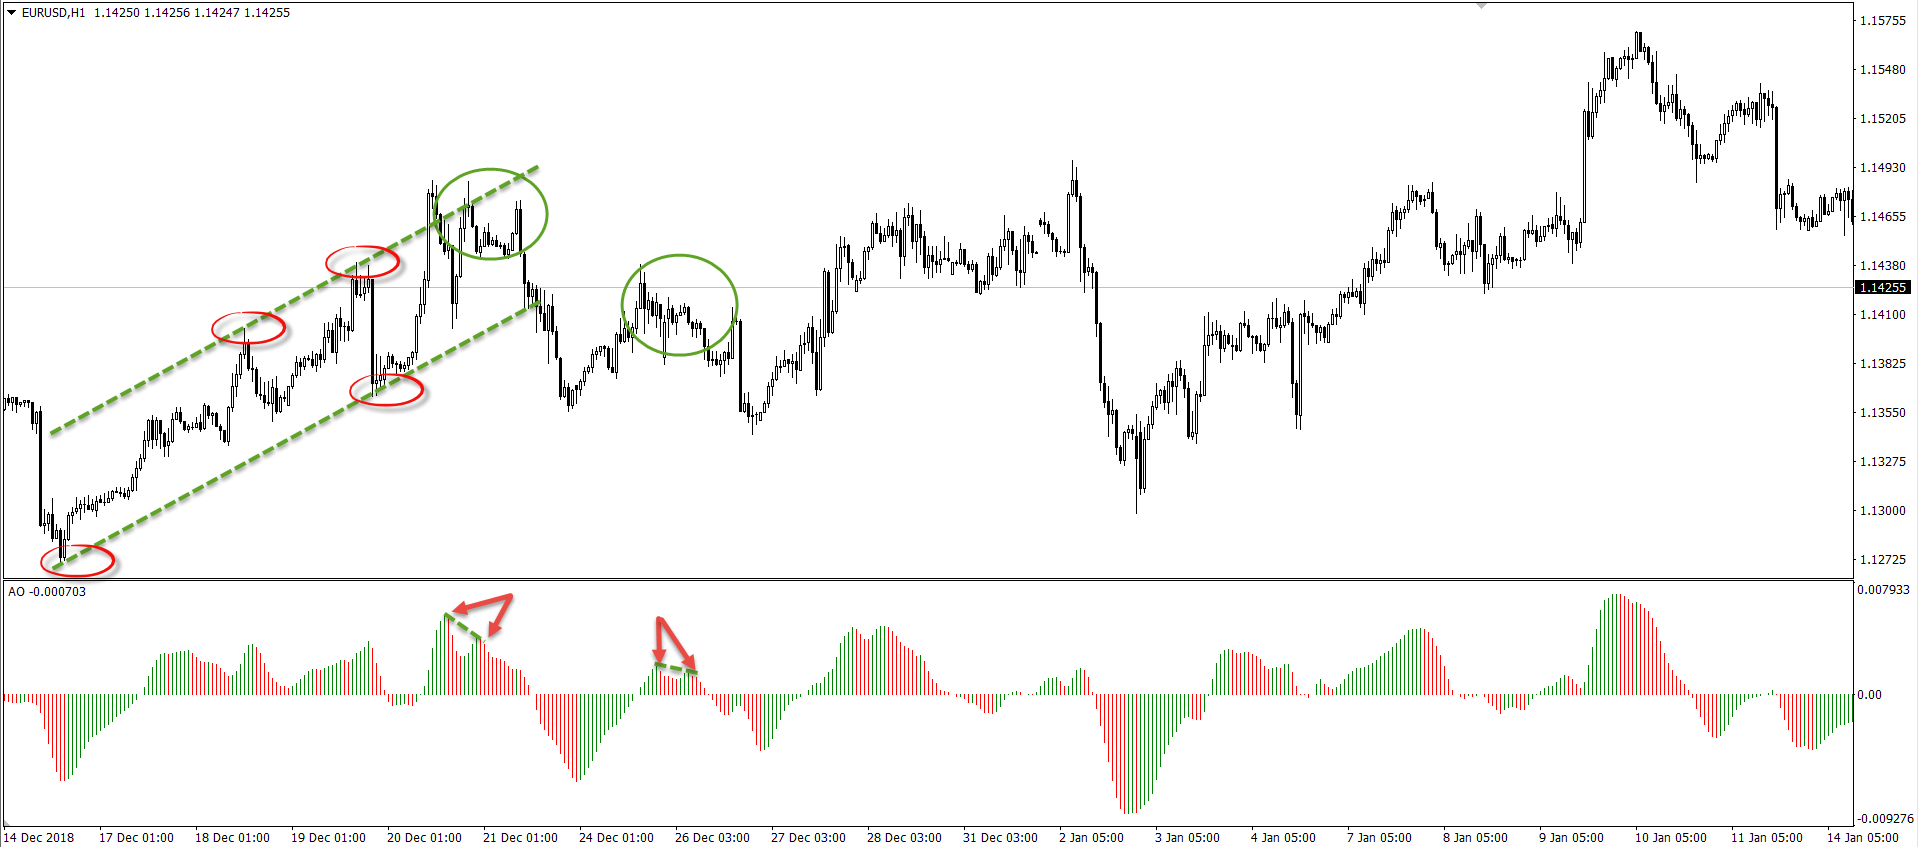
Progressing from a zero-line crossover, some traders work a strategy labelled ‘twin peaks’. This method involves identifying two peak points ABOVE the zero line for a bearish signal, and two bottoms (often termed peaks as well) BELOW the zero line for a bullish signal.
Concerning a sell, traders need to ensure the second peak is lower than the first. Likewise, for a buy, the second bottom needs to remain above its initial point for a valid pattern.
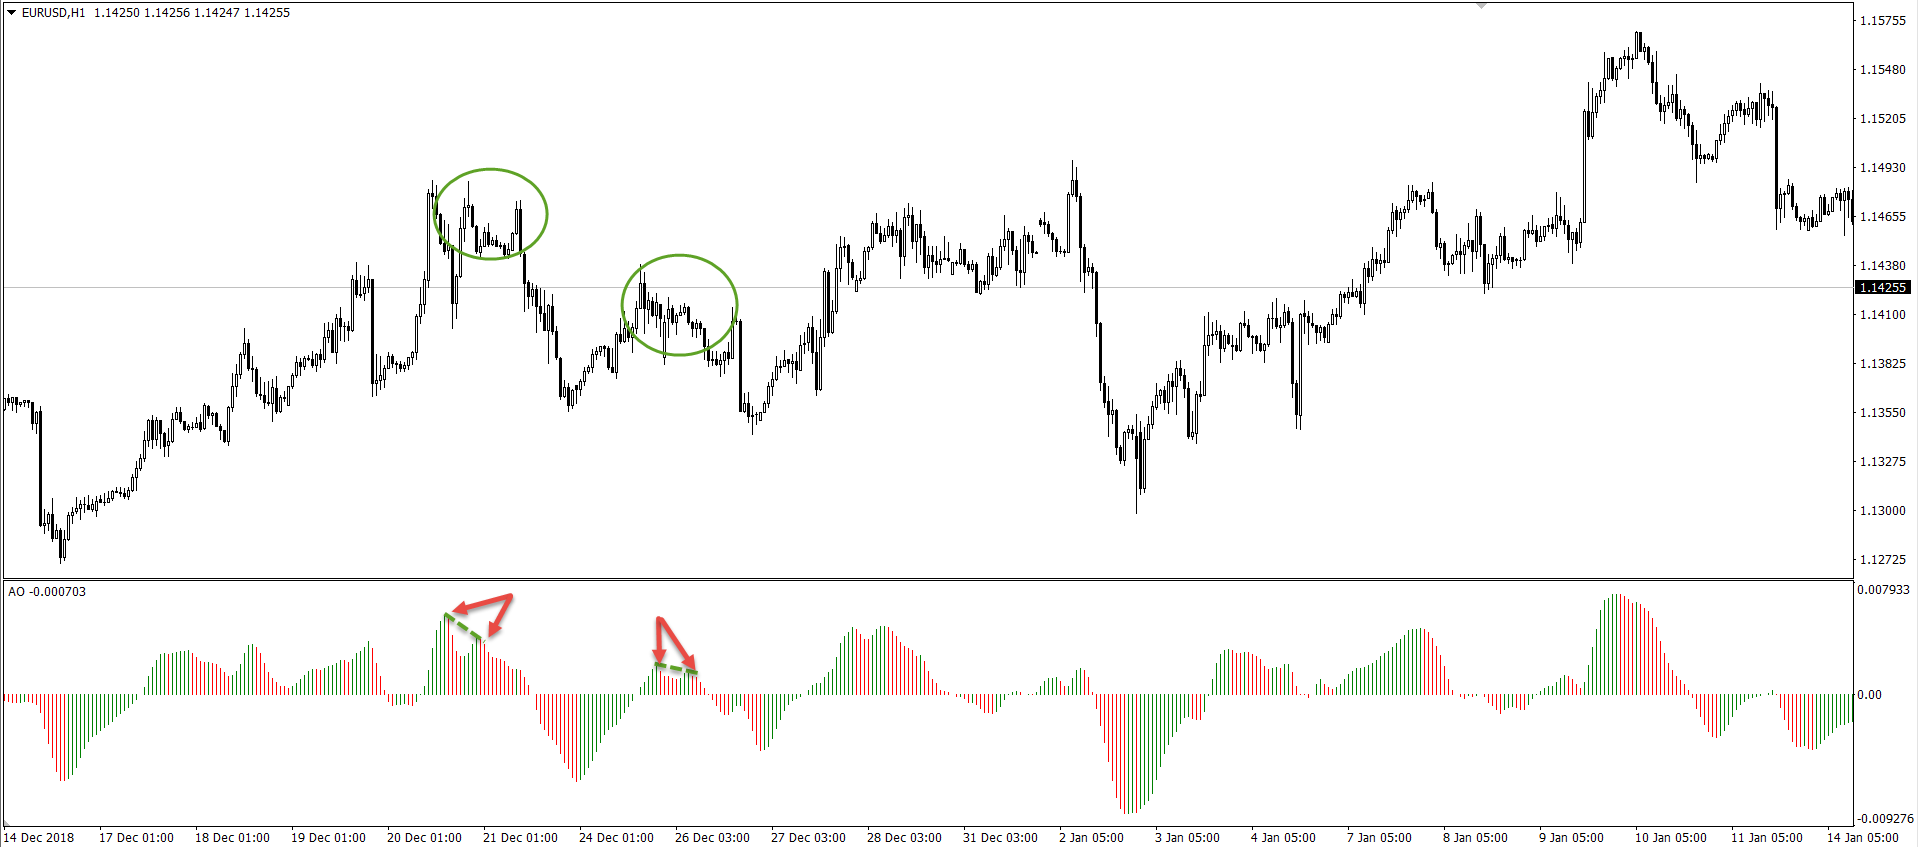
Below is an example of two bearish twin peak formations that both produced gains:
Saucers:
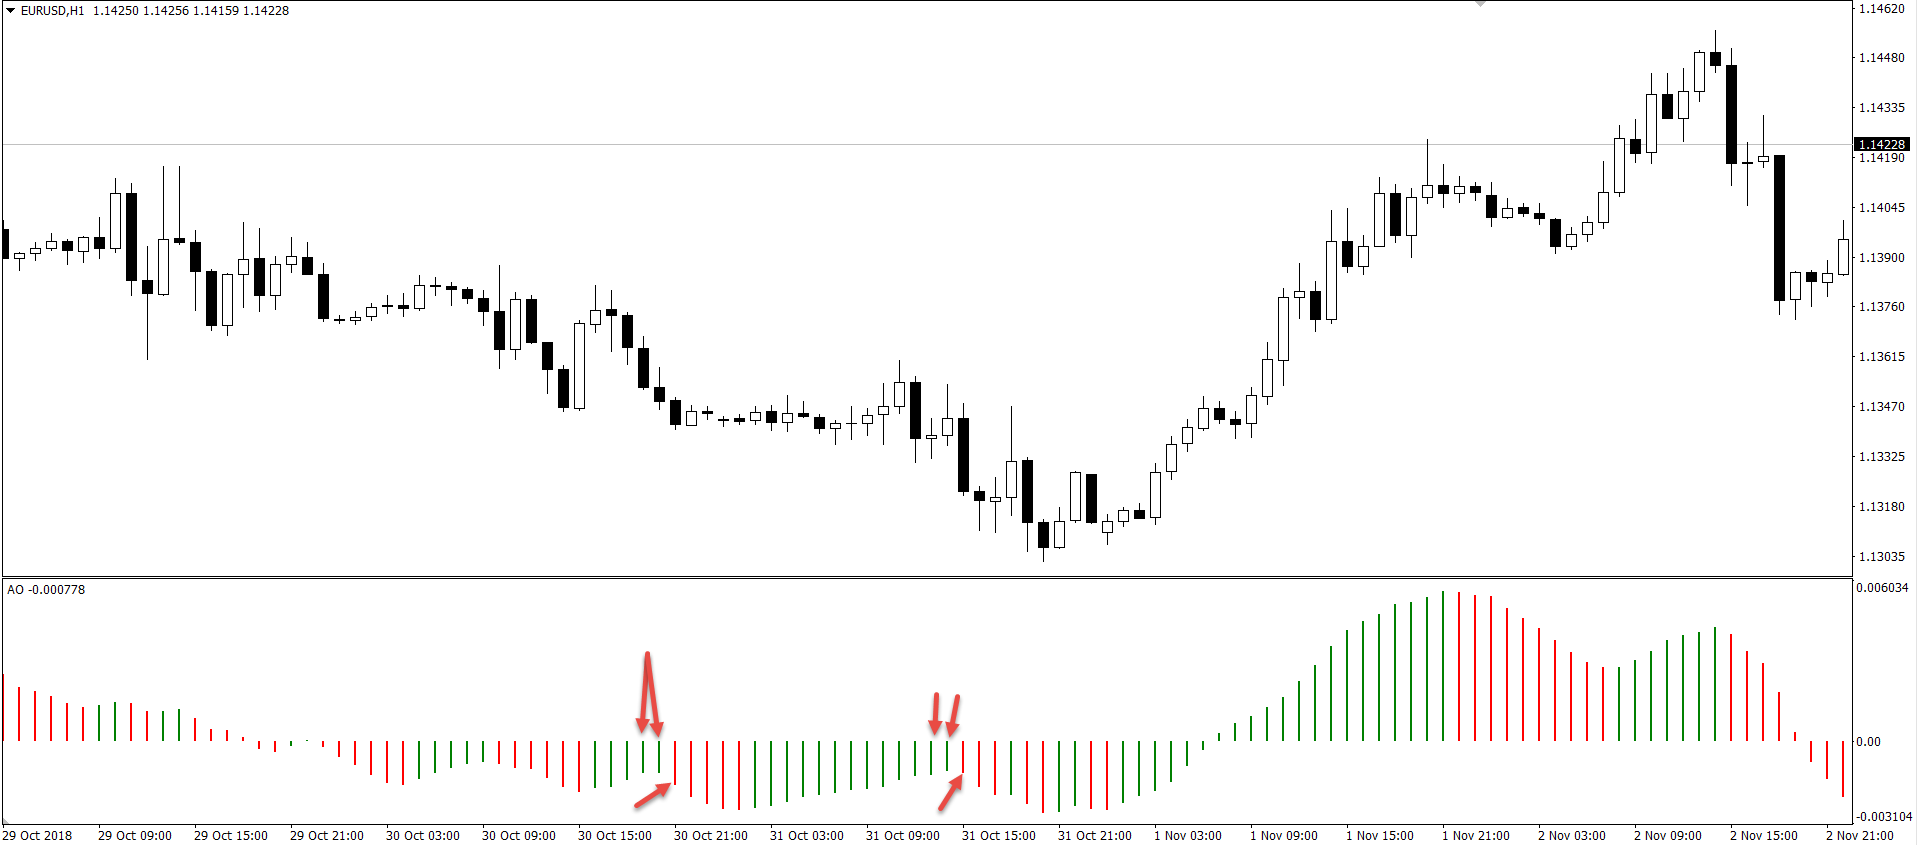
A saucer setup aims to identify rapid changes in momentum in the shape of three consecutive AO bars.
All on the same side of the zero line, a bullish strategy requires three bars to form above the zero line by way of a red bar, shadowed by an additional red bar, though smaller in size, followed by a green bar. A bearish strategy is the same, only inverse. Below the zero line, traders look for an initial green bar, tailed by another green bar, though again smaller in size, followed by a red bar.
Below is an example of two saucer sell signals. As demonstrated on the chart, the initial setup worked, albeit following a period of drawdown, though the second setup failed to produce much in terms of downside movement:
Trading in isolation
Relying on the AO (or any indicator for that matter) in isolation is challenging. An alternative approach is confirming AO action with additional technical tools.
By way of an example, price action traders may employ the use of channels. Simple channels are incredibly effective, helping frame an uptrend or downtrend along with offering traders potential trading opportunities at channel tops and bottoms. The chart below shows price action compressing within an ascending channel. Note, however, the twin peaks formation took shape as the candlesticks tested channel resistance. This is reasonably attractive confluence traders should act on.
Although not the most notable of trend line resistances, the break above the applied level posted on the chart below is another example of price action supporting an AO signal (in this case an AO crossover). For those new to trading, it might be worth noting it takes at least two tops or bottoms to draw a valid trend line.
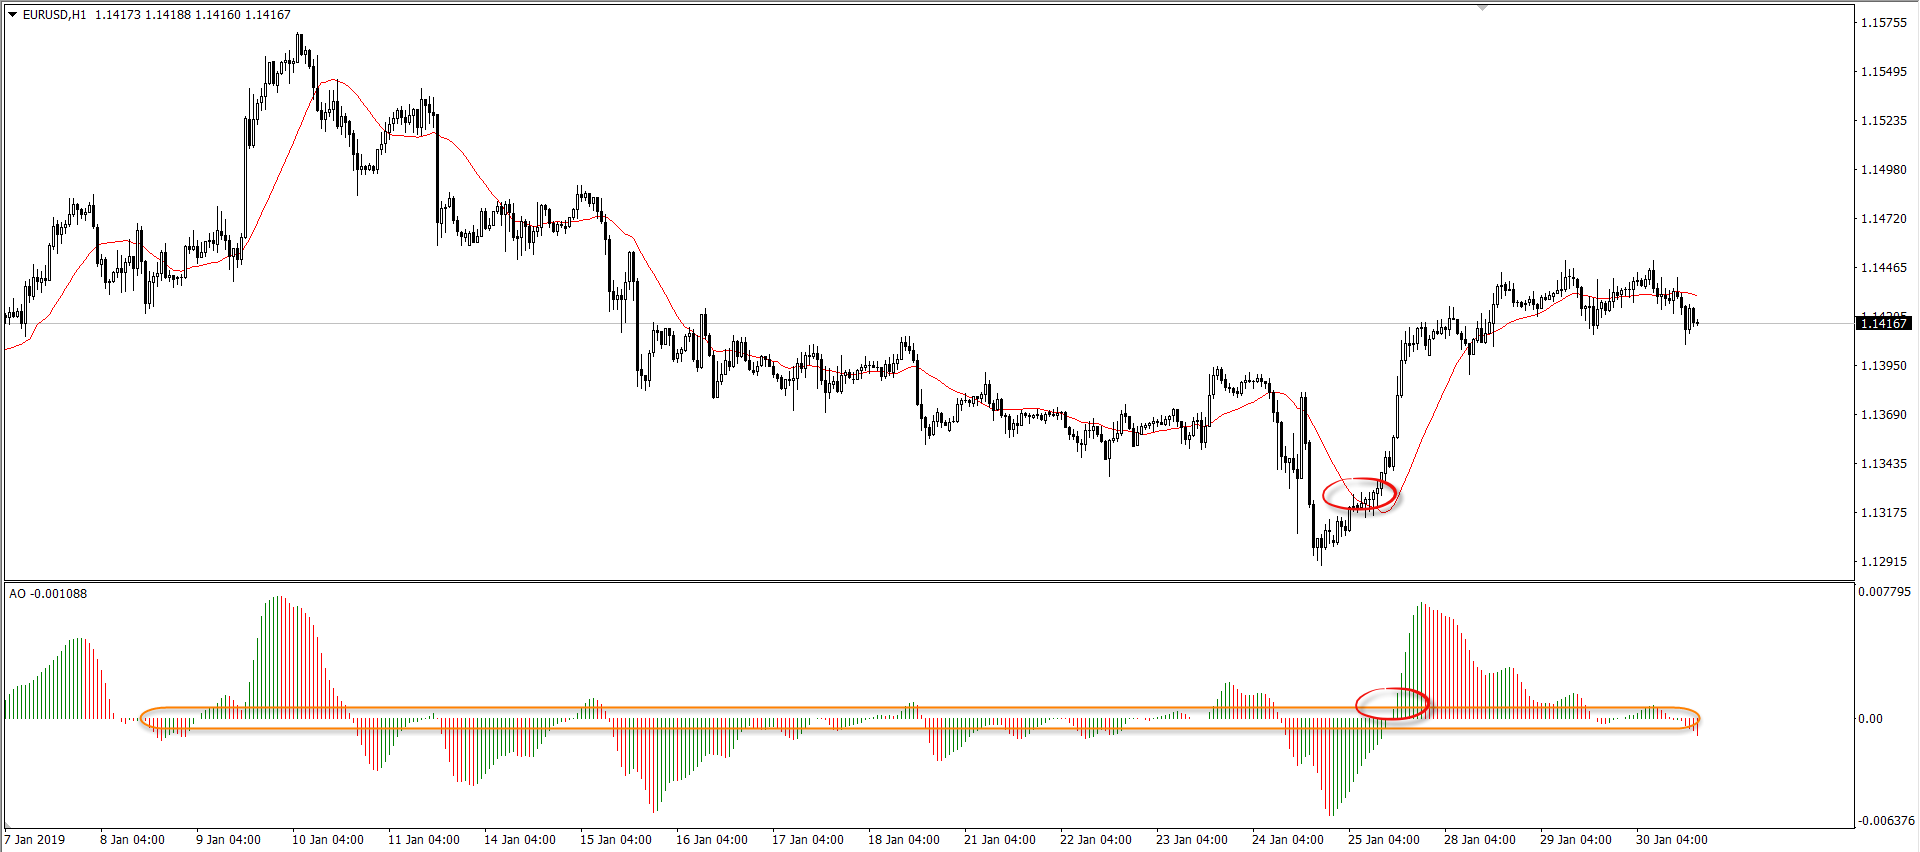
Traders who prefer indicators as additional forms of confirmation might use something as basic as a simple moving average (SMA). In the case of the example below, the SMA crossover confirmed the upside signal generated from the AO crossover.
Trading with confidence
If used correctly, the AO provides traders an additional edge to apply to the markets.
If used in isolation, the indicator is likely to produce a number of false signals which could be avoided by using other tools to confirm the AO’s movement.
Some traders use the indicator as a means of confirming an initial configuration, such as a price-based approach or a collection of other indicators producing a signal, while other traders take signals from the AO and search for additional forms of confirmation thereafter. This decision, of course, is trader dependent.


