EUR/USD:
Weekly Gain/Loss: +0.39%
Weekly Closing price: 1.1655
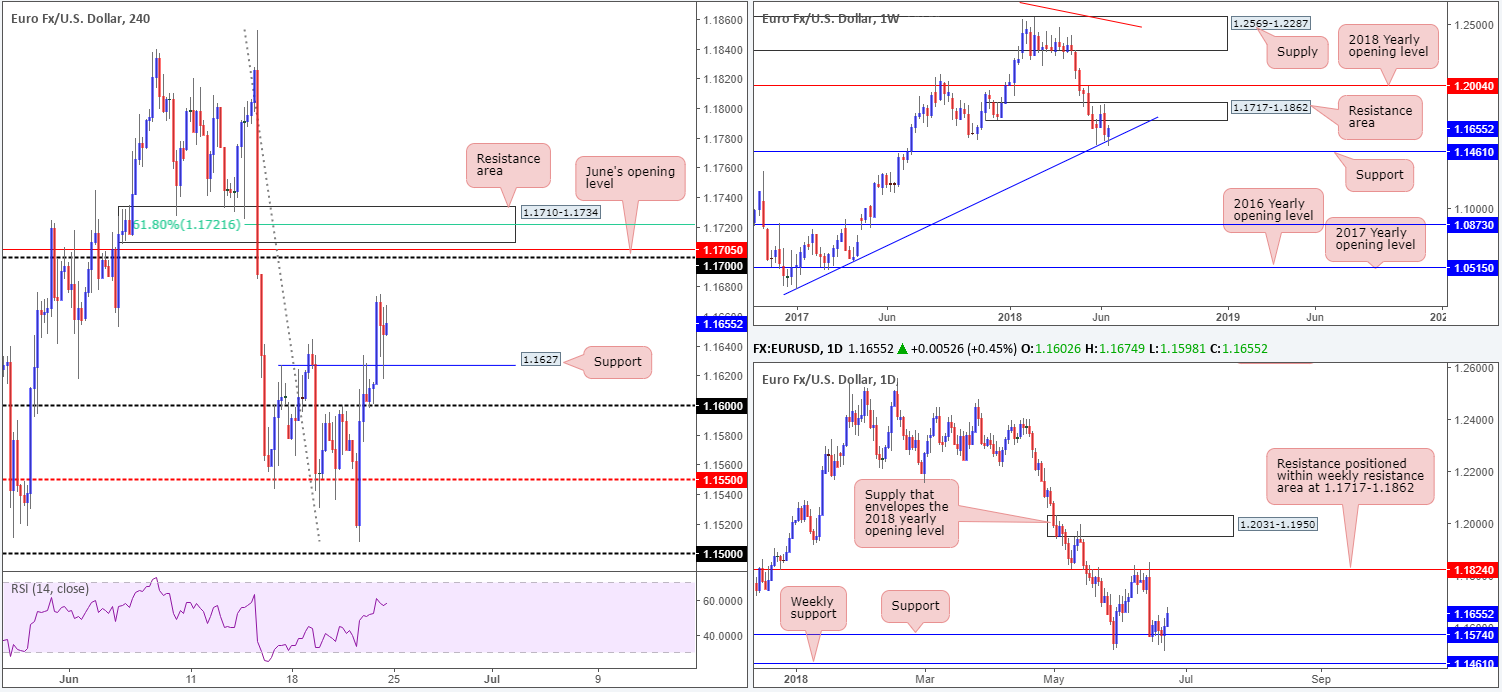
As can be observed on the weekly timeframe, buyers and sellers remain battling for position between a long-term weekly trend line support (taken from the low 1.0340) and a nearby weekly resistance area at 1.1717-1.1862. Both barriers carry equal weight, in our opinion, so either could suffer a breach in the near future. Areas of interest outside of these zones fall in at the 2018 yearly opening level drawn from 1.2004 and weekly support at 1.1461.
Despite suffering multiple downside attempts last week, daily support at 1.1574 managed to contain price action. What’s also interesting about this support is it blends gorgeously with the weekly trend line support mentioned above. Further upside from this point has daily resistance at 1.1824 to target, which happens to be positioned within the upper limits of the noted weekly resistance area.
Across on the H4 timeframe, the pair managed to overcome a nearby Quasimodo resistance at 1.1627 on Friday, building on Thursday’s gains to highs of 1.1675. Having seen price retest the recently broken Quasimodo as support into the close, we feel there’s scope for further upside to the 1.17 neighborhood on this timeframe.
In terms of economic data out of the Eurozone, business activity in the service sector printed upbeat numbers across the board, while manufacturing contracted. Recent euro buying largely appears to be a product of broad-based USD selling seen in the second half of the week.
Areas of consideration:
As of current price, the H4 candles are likely to attempt an approach toward 1.17 today/tomorrow. We say this not only because H4 price recently retested support at 1.1627, but also because ALL three timeframes we watch show space to move higher until at least 1.17. As such, should the market retest 1.1627 again – print a full or near-full-bodied H4 bullish candle – buying this market and targeting 1.17 may be an option.
On the other side of the spectrum, we need to also consider that 1.17 is not only an upside target for longs, it is a valid sell zone to keep eyes on. This is due to the number’s close association with nearby structure:
- June’s opening level at 1.1705.
- 61.8% H4 Fib resistance value at 1.1721.
- H4 resistance area at 1.1710-1.1734 which houses the lower edge of the weekly resistance area within at 1.1717.
Given these factors, we have a sell zone between 1.1734/1.17, and owing to its association with weekly structure it is likely strong enough for a market sell (without the need for additional candle confirmation) with stops plotted above 1.1734.
Today’s data points: German IFO business climate.
GBP/USD:
Weekly Gain/Loss: -0.16%
Weekly Closing price: 1.3258
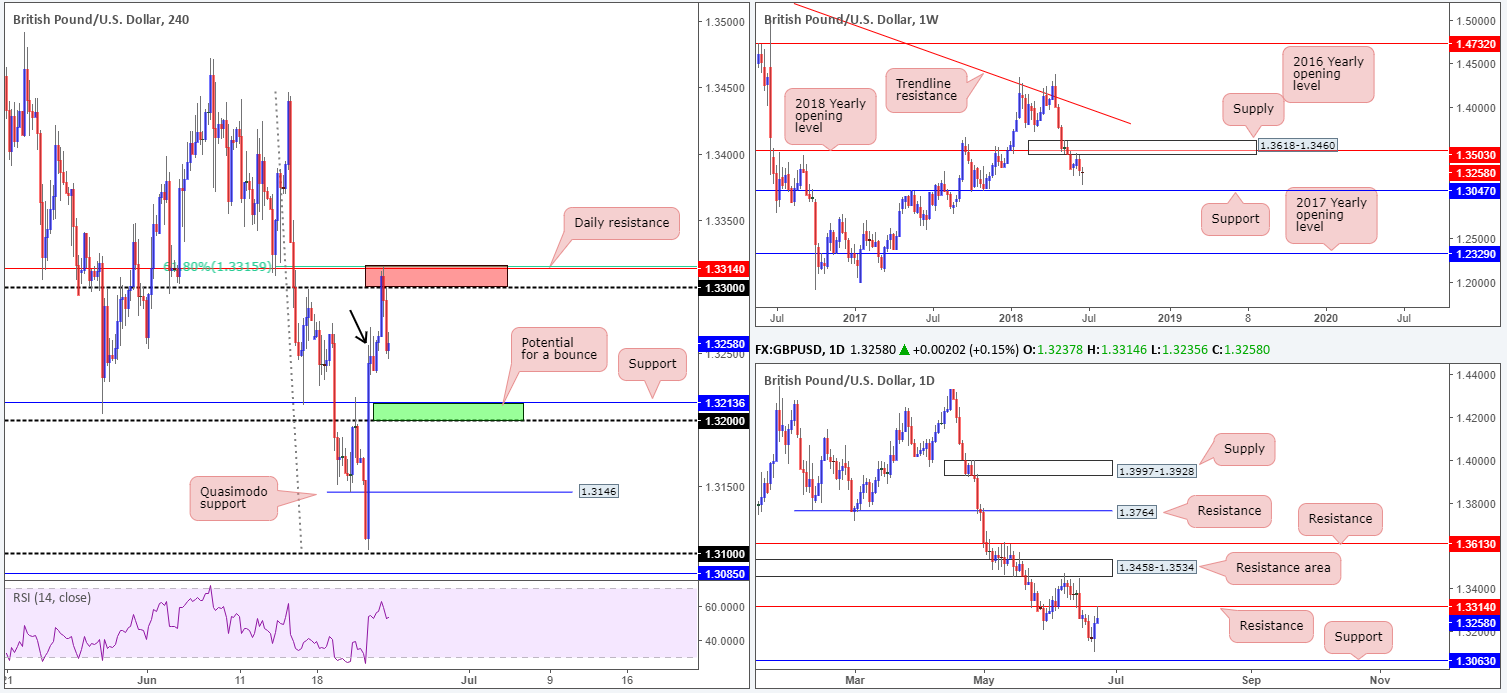
Over the course of last week’s movement, the British pound attempted to connect with weekly support seen at 1.3047 but fell short some fifty pips as price recovered. Assuming weekly buyers remain defensive, this week could see a retest of weekly supply at 1.3618-1.3460 (houses the 2018 yearly opening level within at 1.3503).
Buying this market, however, may not be such an easy feat. Daily resistance at 1.3314 was brought into the fray on Friday, which, not only held its ground to the pip, but also saw price chalk up a nice-looking daily bearish pin-bar formation. By and of itself, this is enough to attract the interest of candlestick enthusiasts and potentially pull the market down to notable support positioned at 1.3063 (sited just a few pips above the aforementioned weekly support level).
For those who read Friday’s report you may recall the team banging the drum for the 1.3315/1.33 red zone drawn on the H4 chart for possible shorting opportunities. Why this area? Well, not only is the 1.33 handle an easily visible number to all, it’s also bolstered by nearby daily resistance plotted at 1.3314 and a 61.8% H4 Fib resistance value at 1.3315. Should you have entered short at this area with stops placed 2 pips above the zone, you would have survived and ended the week in profit with favorable risk/reward. So, well done to any of our readers who managed to take advantage of this move!
Moving forward, we see H4 demand at 1.3233-1.3258 currently in play (see black arrow). This is likely to be a weak zone given where we are coming from on the daily timeframe: daily resistance at 1.3314. The next point of support, therefore, can be found at 1.3213, shadowed closely by the 1.32 handle.
Areas of consideration:
For folks who remain short from 1.3315/1.33, it may now be a good opportunity to cash in partial profit and reduce risk. Although the current H4 demand is likely fragile, there may still be enough buyers here to cause a problem – better safe than sorry!
Should price reach low 1.32s, the 1.32/1.3213 zone marked in green on the H4 timeframe may be of interest to intraday buyers for a bounce, and by extension, should also be of interest to those currently short as the next take-profit area.
Today’s data points: Limited.
AUD/USD:
Weekly Gain/Loss: +0.03%
Weekly Closing price: 0.7440
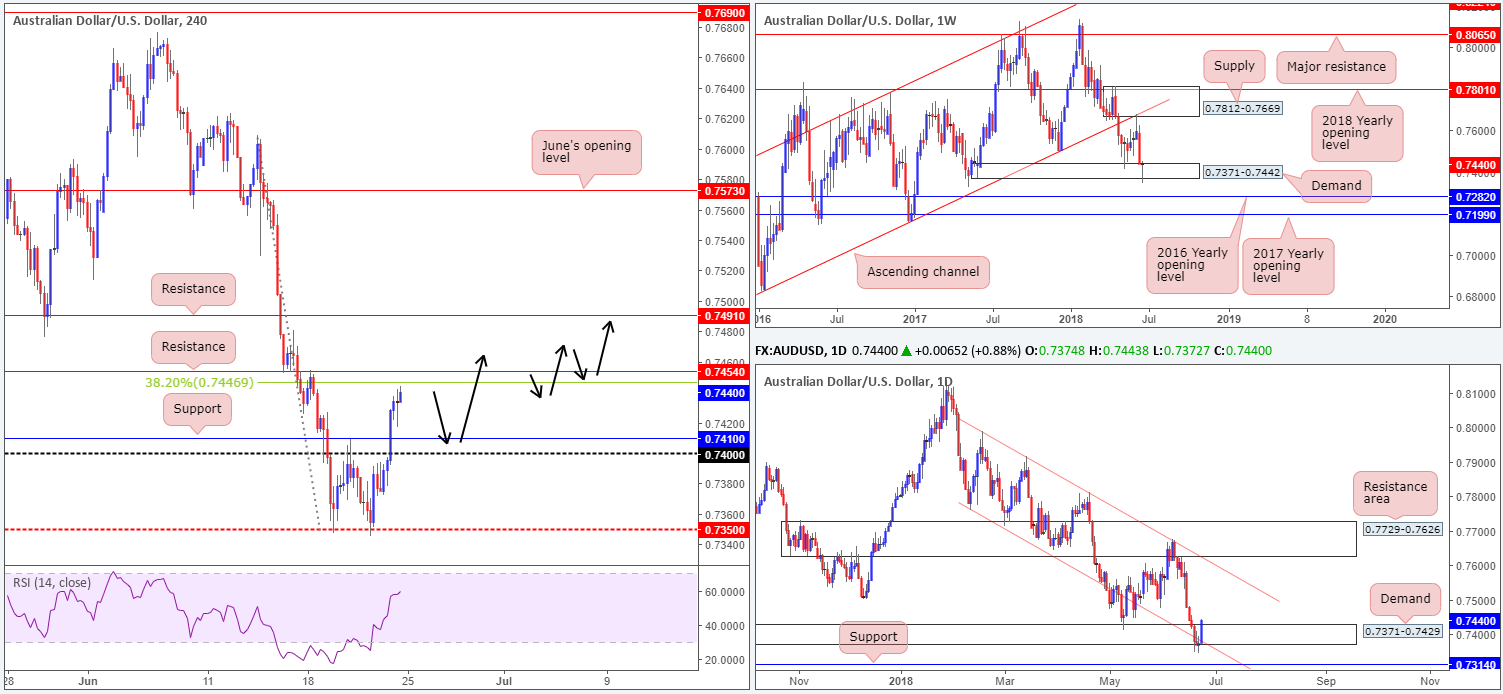
Despite the AUD/USD closing all but unchanged on the week, the couple did manage to print a range in excess of 100 pips. Weekly movement, as you can see, penetrated the lower edge of weekly demand coming in at 0.7371-0.7442, but failed to preserve downside momentum. In its place, a beautiful weekly bullish pin-bar formation formed. Additional upside from this point may eventually lead to a retest of weekly supply priced in at 0.7812-0.7669.
Daily demand at 0.7371-0.7429, plotted within the lower limit of the aforementioned weekly demand area, held firm, despite a mid-week attempt to push lower. Note on this scale there’s additional confluence seen at this zone in the shape of a daily channel support taken from the low 0.7758. Could Friday’s strong full-bodied daily bull candle printed from here, which erased the entire week’s losses, be enough to bring buyers into the market this week and approach the daily channel resistance taken from the high 0.7988?
USD selling, coupled with crude oil advancing sharply (aiding commodity-sensitive currencies), helped lift H4 price action above the 0.74 handle and nearby H4 resistance level at 0.7410 (now acting support) on Friday. Upside momentum, however, may diminish today as the candles concluded the week closing within striking distance of a 38.2% H4 Fib resistance at 0.7446 and H4 resistance level carved from 0.7454.
Areas of consideration:
Without acknowledging where price action is trading on the higher timeframes, one may surmise that H4 flow is likely to react from nearby H4 resistance. Although it could very well do that, the odds of a bulky move being seen south from here are low.
With this in mind, here are two possible scenarios (as per the black arrows) to be watchful of:
- A retest of the H4 0.74/0.7410 support area, targeting a move above the H4 resistance level 0.7454, and eventually up to H4 resistance at 0.7491. Here one may want to contemplate buying 0.74/0.7410.
- A mild reaction off 0.7454, followed by a break (to the upside)/retest play of this number for possible intraday buying opportunities, targeting 0.7491.
Bear in mind, though, that due to where we are coming from on the higher timeframes, price could potentially drive much higher than the noted H4 levels.
Today’s data points: Limited.
USD/JPY:
Weekly Gain/Loss: -0.63%
Weekly Closing price: 109.97
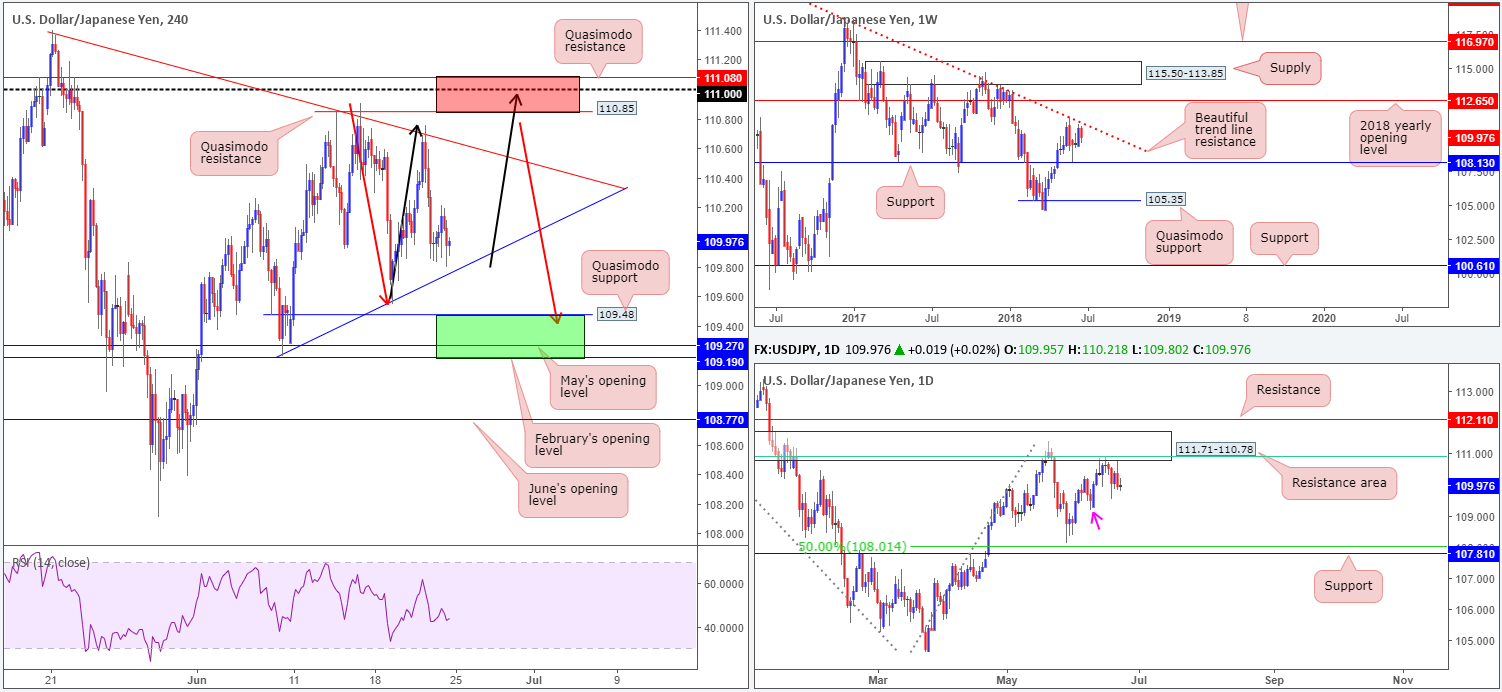
In terms of weekly price action, there has been little change in structure. The pair remains compressing between a weekly trend line resistance taken from the high 123.67, and a weekly support level pencilled in at 108.13. Outside of these areas, traders likely have their crosshairs fixed on the 2018 yearly opening level at 112.65 and a weekly Quasimodo support priced in at 105.35.
Meanwhile, down on the daily timeframe, the 61.8% daily Fib resistance value at 110.91 (green line) is proving a difficult barrier to overcome. This could be due to the level being housed within the limits of a daily resistance area coming in at 111.71-110.78, which has significant history dating back to early August 2017. It may also pay to pencil in the daily resistance level parked just above this area at 112.11, should the buyers regain control. The next downside target on this scale, on the other hand, can be seen at June 8 lows drawn from 109.19 (pink arrow).
Areas of consideration:
Since June 13, H4 movement has been seen constricting between two converging H4 trend lines (111.39/109.19) – some technicians would label this as a H4 bullish pennant formation. Also prominent on this timeframe are two possible H4 ABCD patterns (see black and red arrows). These formations help highlight two potentially tradable zones this week:
- The 111.08/110.85 region marked in red – comprised of two H4 Quasimodo resistance levels and a round number. Also worth noting here is the converging aforementioned weekly trend line resistance and daily resistance area. As for stop-loss placement, above the red zone by two pips should be sufficient.
- The second area of interest marked in green falls in at 109.19/109.48 – consisting of February and May’s opening levels and a H4 Quasimodo support. Note that the next downside target on the daily scale: June 8 low at 109.19 joins with the lower edge of the green H4 zone. In this case, it may be prudent to wait for additional H4 confirmation in the form of a full or near-full-bodied bull candle before pulling the trigger, helping avoid a possible whipsaw/fakeout to 109.
Today’s data points: Limited.
USD/CAD:
Weekly Gain/Loss: +0.50%
Weekly Closing price: 1.3260
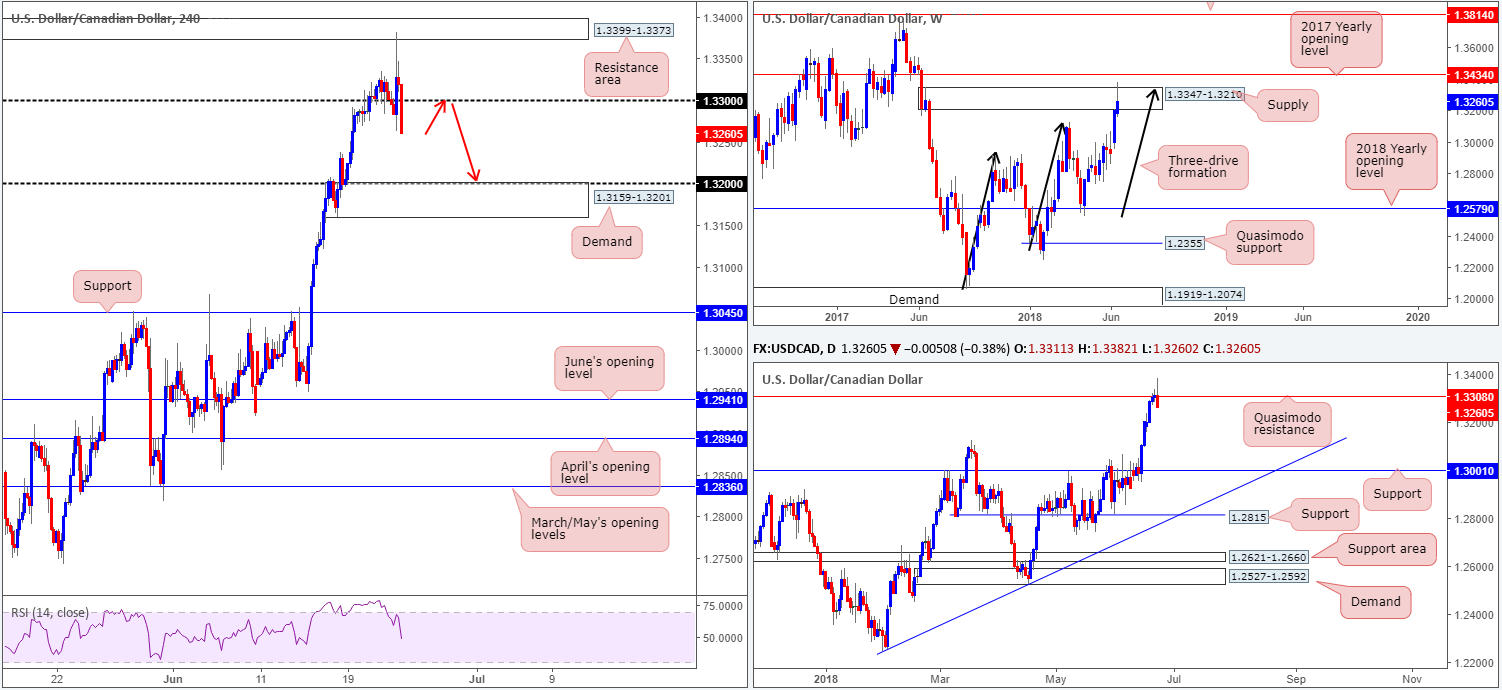
In recent trading, the USD/CAD edged out its second consecutive weekly gain, clocking highs of 1.3382. As of weekly price, we can see the unit whipsawed through the top edge of a weekly supply area at 1.3347-1.3210, and, in all probability, completed a three-drive approach (see black arrows). By and of itself, this could guide the pair lower this week.
Bolstering current weekly structure is also a daily Quasimodo resistance level priced in at 1.3308. Although the level endured a rather savage whipsaw to weekly highs, the barrier remains intact. In the case that the market continues to probe lower this week, we do not expect much buying interest to be seen until reaching daily support plastered in at 1.3001.
A brief recap of price action on the H4 timeframe reveals that the loonie aggressively spiked north on dismal CPI and retails sales data out of Canada on Friday, consequently bringing in a H4 resistance area seen at 1.3399-1.3373 (taken from August 18, 2017). However, higher oil prices amid OPEC headlines supported the CAD, thereby forcing the USD/CAD beneath the 1.33 handle into the close.
Areas of consideration:
All three timeframes we watch show signs of selling strength. As a result of this, a retest to the underside of 1.33 today/early this week that’s followed up with an adequate H4 bearish close would, according to the technicals, be a high-probability short, targeting H4 demand at 1.3159-1.3201 as an initial take-profit zone.
Today’s data points: Limited.
USD/CHF:
Weekly Gain/Loss: -0.97%
Weekly Closing price: 0.9872
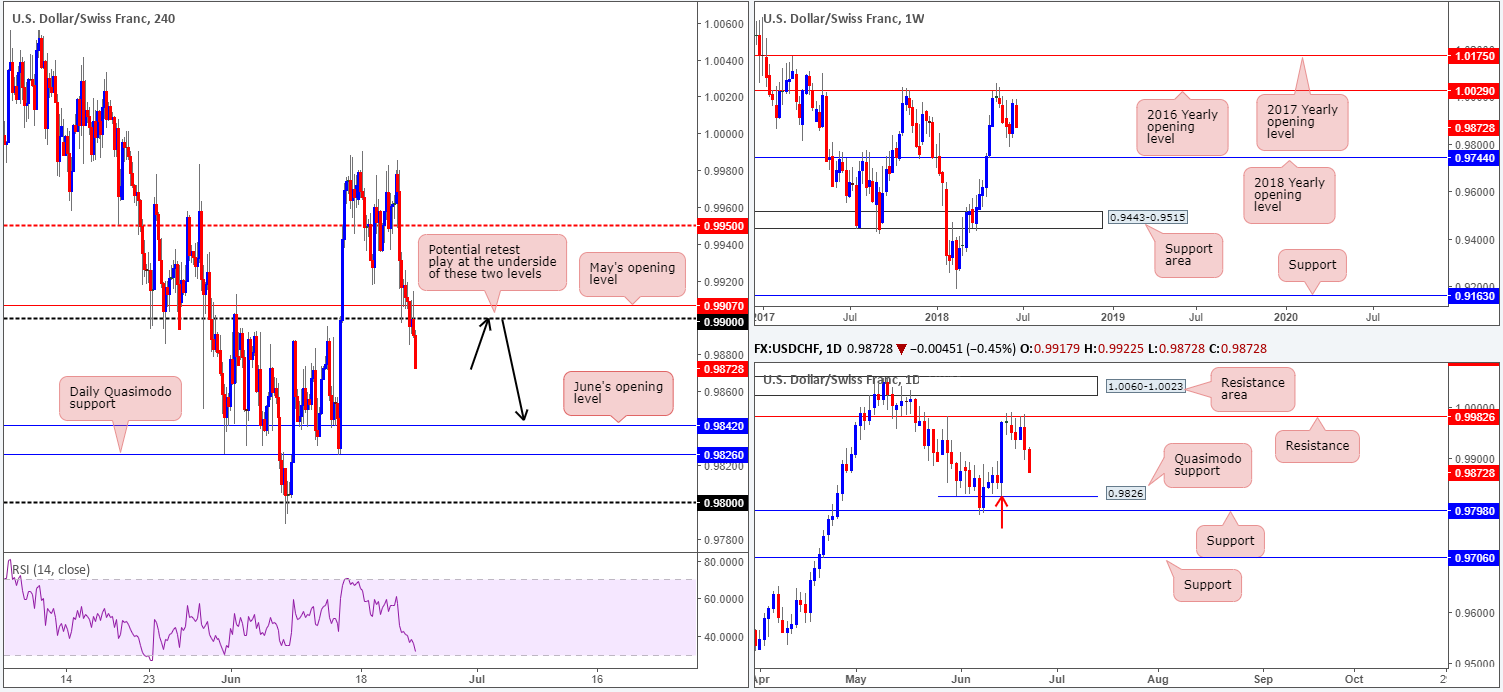
Leaving the 2016 yearly opening level at 1.0029 unchallenged, weekly flows erased the majority of the prior week’s gains last week and closed in the shape of a near-full-bodied weekly bearish candle. Assuming we have some continuation to the downside this week, the next objective can be seen at 0.9744: the 2018 yearly opening level.
Elsewhere, daily movement established strong resistance off the 0.9982 barrier during last week’s sessions, printing strong selling candles on Thursday and Friday. From this point, we see possible buying interest forming off a nearby Quasimodo support at 0.9826, shadowed closely by daily support coming in at 0.9798. To our way of seeing things, we feel the latter area is the more likely zone to receive a response from the buyers, due to the Quasimodo support already being tested on departure (marked with a red arrow).
Despite an earnest attempt from H4 buyers, the 0.99 handle failed to hold ground and was eventually consumed amid US trade on Friday. With this number out of the picture as support, the canvas appears reasonably clear for a run down to June’s opening level at 0.9842, which is followed closely by the daily Quasimodo support level mentioned above at 0.9826.
Areas of consideration:
According to all three timeframes, each is suggesting that the sellers are in control of things at the moment. And as such, the team has noted to keep an eyeball on the underside of the 0.99 handle, and its closely associated resistance in the form of May’s opening level at 0.9907, for a possible retest play. A retest to the underside of 0.9907/0.99, followed up with a H4 full or near-full bodied bearish candle is, in our humble opinion, enough to begin considering a sell in this market, targeting 0.9842/0.9826 and ultimately the daily support highlighted above at 0.9798, which essentially denotes the 0.98 handle on the H4 scale.
Today’s data points: Limited.
Dow Jones Industrial Average:
Weekly Gain/Loss: -2.04%
Weekly Closing price: 24566
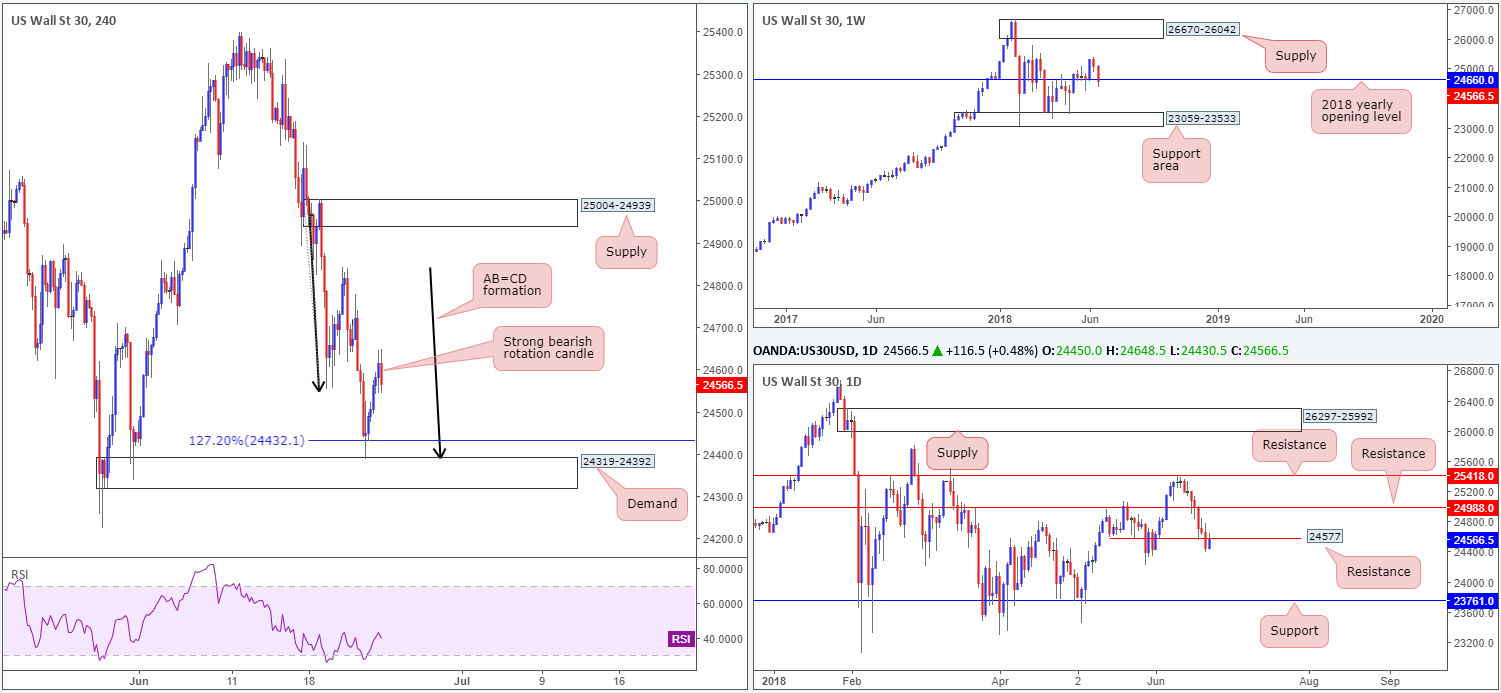
After a considerable move to the upside off the 2018 yearly opening level seen on the weekly timeframe at 24660 a couple of weeks back, price was clearly unable to build on these gains. Topping at a weekly high of 25399, the index, over the span of two weeks, pared gains and pulled price marginally back beneath the 24660 region. In the event that this triggers further selling, pencilling in the weekly support area at 23059-23533 may be an idea.
Daily movement recently eclipsed daily support at 24577 in strong fashion, which, as you can see, was retested as resistance amid Friday’s sessions. Apart from the May 29 low at 24224, there’s not much support seen stopping the index from reaching the 23761 mark.
Over on the H4 timeframe, we witnessed price action extend Thursday’s bounce off the top edge of H4 demand at 24319-24392, which happened to be bolstered by a H4 AB=CD completion (black arrows) to the downside (the 127.2% H4 Fib ext. point at 24432). Buyers, however, struggled to preserve upside momentum after President Trump threatened the EU by suggesting a possible 20% tariff on European car imports, as well as daily price connecting with the underside of the daily resistance at 24577.
Areas of consideration:
In Friday’s report, we noted that should one observe H4 price action reject the current daily resistance level and form a full or near-full-bodied bearish formation, this would (given weekly price is also trading beneath 2018 yearly opening level) likely be sufficient enough to warrant shorts. As is evident from the H4 chart this occurred. For those looking to short the open, the initial downside target will, of course, be the current H4 demand base. Beyond here, though, eyes will likely be on the May 29 low at 24224 mentioned above on the daily scale.
Today’s data points: Limited.
XAU/USD (Gold)
Weekly Gain/Loss: -0.80%
Weekly Closing price: 1269.2
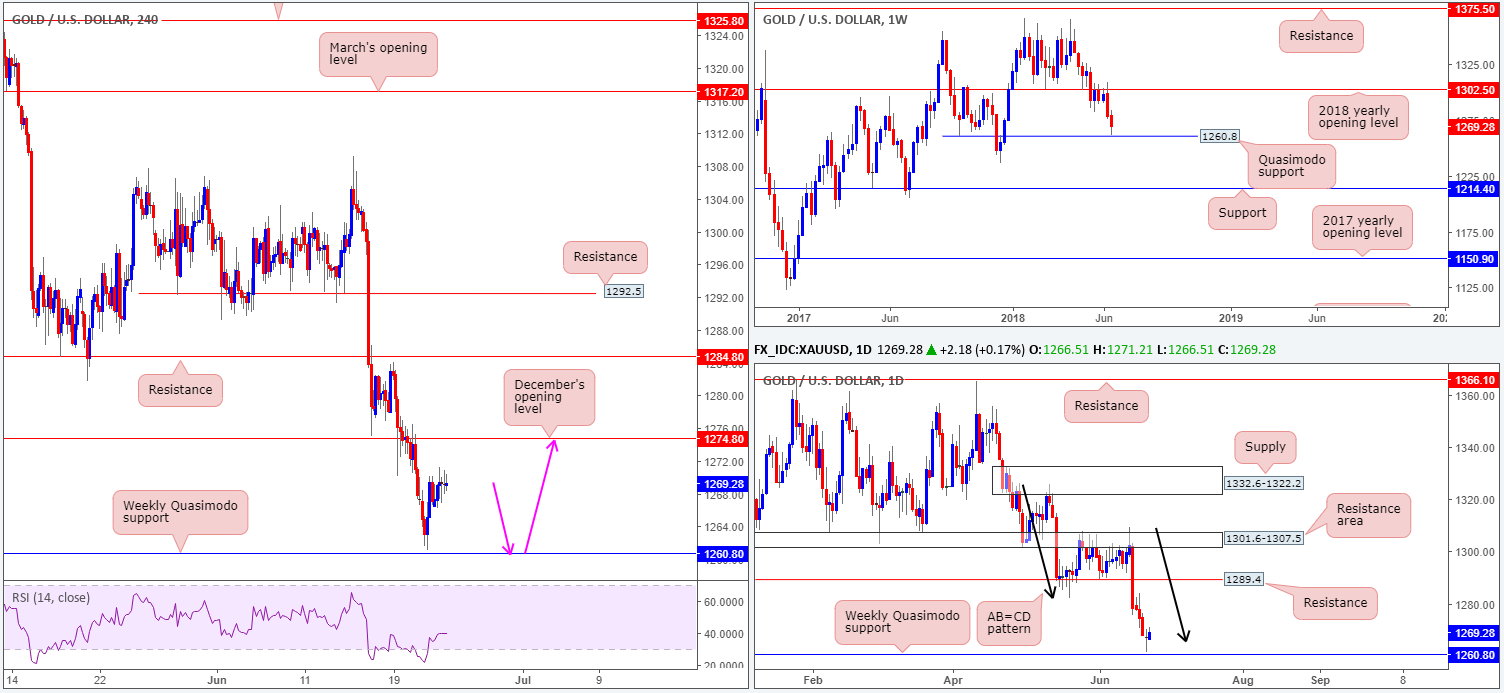
The yellow metal sustained further losses over the course of last week’s trading. This follows a decisive move from the underside of the 2018 yearly opening level at 1302.5. In consequence, this brought weekly price action down to within shouting distance of a notable weekly Quasimodo support plotted at 1260.8.
A closer look at price action on the daily timeframe shows the daily candles finding support off of a recently completed AB=CD formation (black arrows) at 1265.6, planted just ahead of the aforementioned weekly Quasimodo barrier.
A brief look at recent dealings on the H4 timeframe, however, reveal that Friday’s movement was somewhat lackluster. Note the clear back-to-back H4 indecision candles printed amid US trading hours. As such, we still have little to shout about in terms of market structure on this timeframe as focus remains on the weekly Quasimodo support at the moment. What we do see, nevertheless, is December’s opening level at 1274.8 as a viable upside target, which, as you can see, was respected as resistance on a retest play on Wednesday.
Areas of consideration:
Ultimately, what we’re looking to see happen in this market is a test of the noted weekly Quasimodo support (pink arrows) that’s bolstered with H4 price action: a full or near-full-bodied bull candle. This – coupled with the daily AB=CD formation in play – would, in our view, be considered a high-probability trade long, targeting December’s opening level mentioned above at 1274.8 as the initial take-profit zone.
The use of the site is agreement that the site is for informational and educational purposes only and does not constitute advice in any form in the furtherance of any trade or trading decisions.
The accuracy, completeness and timeliness of the information contained on this site cannot be guaranteed. IC Markets does not warranty, guarantee or make any representations, or assume any liability with regard to financial results based on the use of the information in the site.
News, views, opinions, recommendations and other information obtained from sources outside of www.icmarkets.com.au, used in this site are believed to be reliable, but we cannot guarantee their accuracy or completeness. All such information is subject to change at any time without notice. IC Markets assumes no responsibility for the content of any linked site. The fact that such links may exist does not indicate approval or endorsement of any material contained on any linked site.
IC Markets is not liable for any harm caused by the transmission, through accessing the services or information on this site, of a computer virus, or other computer code or programming device that might be used to access, delete, damage, disable, disrupt or otherwise impede in any manner, the operation of the site or of any user’s software, hardware, data or property.


