EUR/USD:
Thanks to a disappointing ZEW survey out of Germany, the euro was soft across the board on Tuesday. Dollar gains further accelerated the decline, with the DXY seen reclaiming the 90.00 mark in strong fashion.
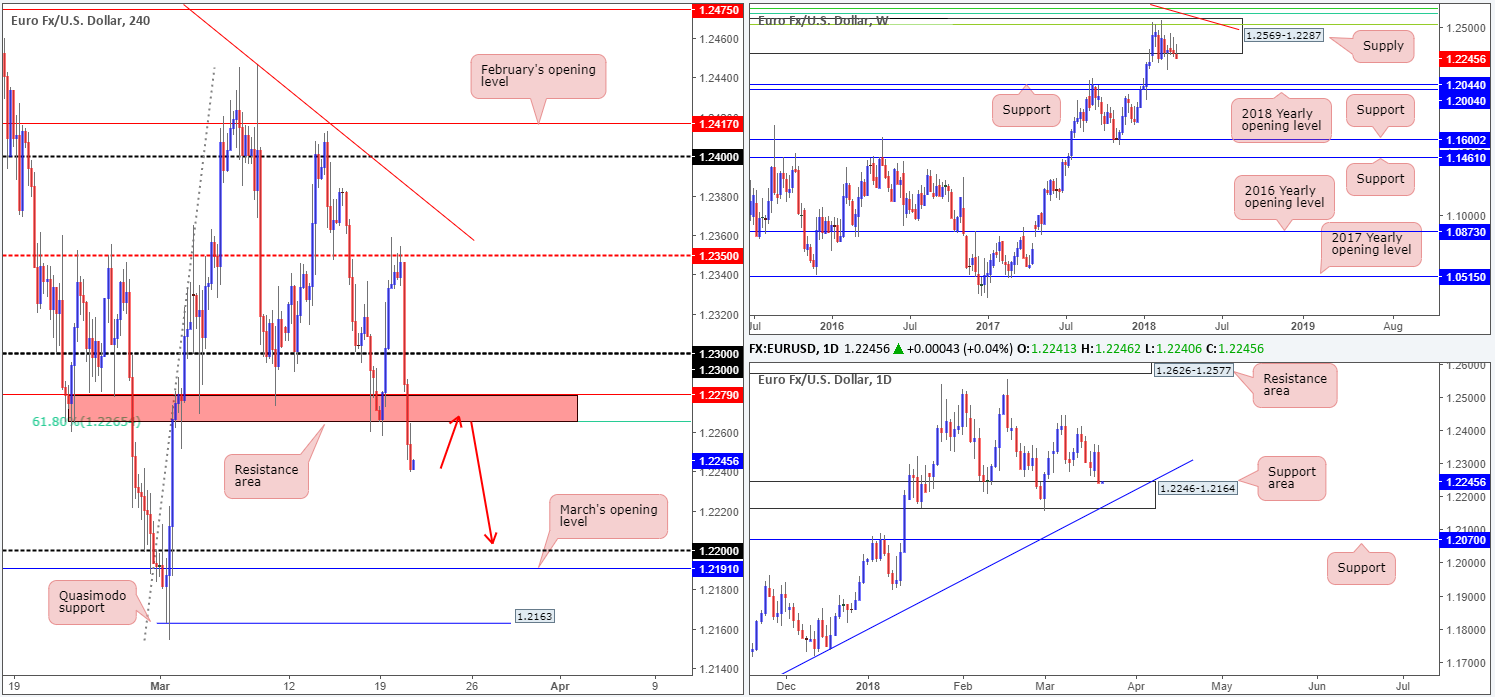
After chewing through a H4 support area at 1.2265/1.2279 on the EUR/USD (61.8% H4 support/H4 support level), further downside on the H4 scale to the 1.22 region, followed closely by March’s opening level at 1.2191, could be on the cards.
Weekly price remains trading around a major-league weekly supply zone coming in at 1.2569-1.2287. Should sellers eventually crank it up a gear, price could shake hands with the weekly support at 1.2044, and quite possibly the 2018 yearly opening level seen nearby at 1.2004. Daily price, on the other hand, recently reclaimed all of Monday’s gains and slam dunked itself into a notable daily support area at 1.2246-1.2164.
Potential trading zones:
As traders jostle for position ahead of the Fed’s widely anticipated rate hike later on today, the technicals are somewhat mixed.
Weekly price indicates lower prices, as does H4 structure, while the daily timeframe shows a possible move higher could be in store. Under these circumstances, one could look to short the underside of the recently broken H4 support area at 1.2265/1.2279 (as per red arrows), targeting 1.22. As you would effectively be selling into daily support here, though, we would strongly recommend waiting for at least a H4 full or near-full-bodied bearish candle to print before pulling the trigger. This will not guarantee a winning trade, but what it will do is show seller intent.
Data points to consider: US current account at 12.30pm; FOMC economic projections, statement and funds rate decision at 6pm; FOMC press conference at 6.30pm GMT.
Areas worthy of attention:
Supports: 1.22; 1.2191; 1.2246-1.2164; 1.2004/1.2044.
Resistances: 1.2265/1.2279; 1.2569-1.2287.
GBP/USD:
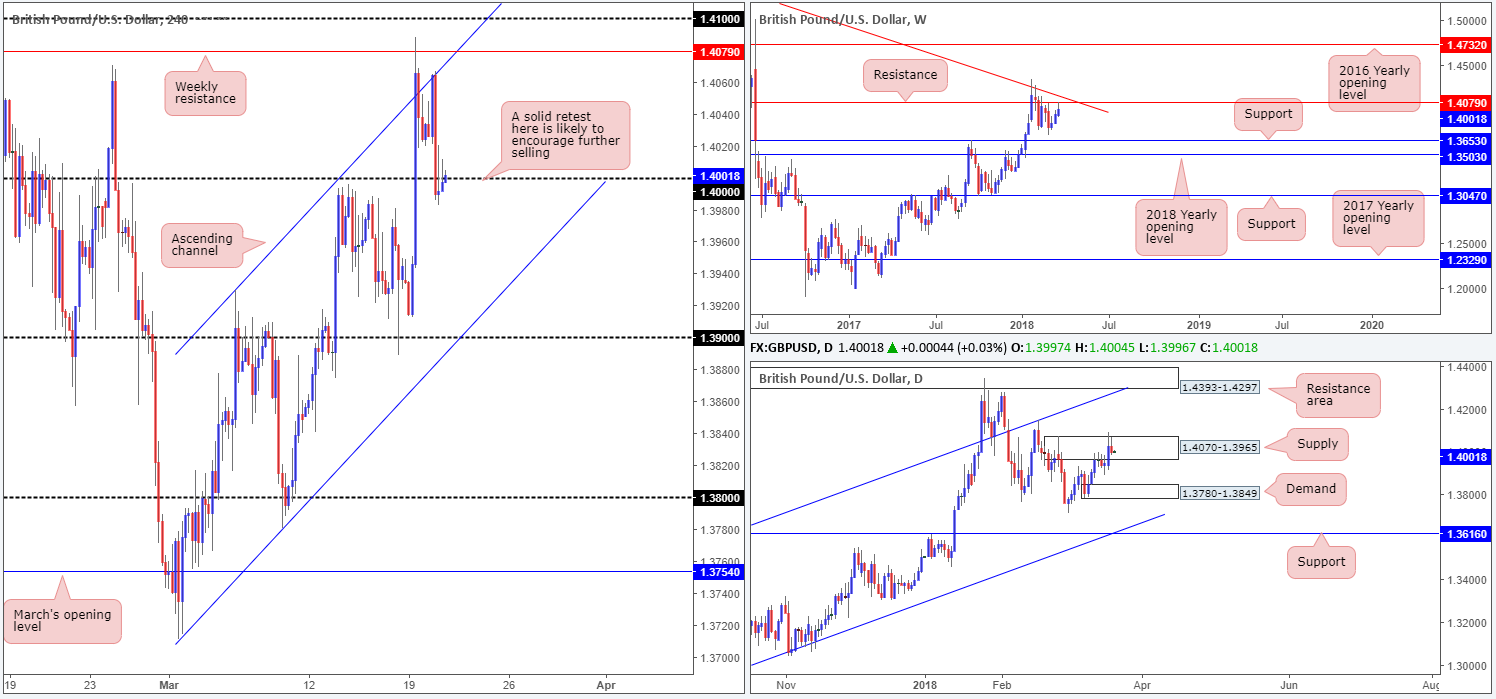
The GBP/USD, as you can see, experienced a bout of profit taking on Tuesday following a retest of a H4 ascending channel resistance line (taken from the high 1.3929) and a miss on UK inflation. This dragged H4 price sub 1.40, where the unit remained throughout the US segment.
The latest move lower could also have something to do with the fact that weekly sellers were brought into the fray after a touch of weekly resistance at 1.4079 on Monday. In addition to this, we also see daily supply at 1.4070-1.3965 still in play, despite suffering a marginal topside breach.
Potential trading zones:
As noted in Tuesday’s report, the team did not expect much more than a bounce to materialize from 1.40 given overhead pressure from the bigger picture.
On account of recent movement, traders likely now have their crosshairs fixed on lower prices: the H4 ascending channel support (taken from the low 1.3711), and the 1.39 handle. Therefore, should H4 price establish a position beneath 1.40 in the shape of a full or near-full-bodied H4 bearish candle today, this could be a cue to begin thinking about shorting this market and targeting the aforementioned H4 supports.
Data points to consider: UK job’s data at 9.30am; US current account at 12.30pm; FOMC economic projections, statement and funds rate decision at 6pm; FOMC press conference at 6.30pm GMT.
Areas worthy of attention:
Supports: 1.40; H4 channel support; 1.39.
Resistances: 1.4070-1.3965; 1.4079.
AUD/USD:
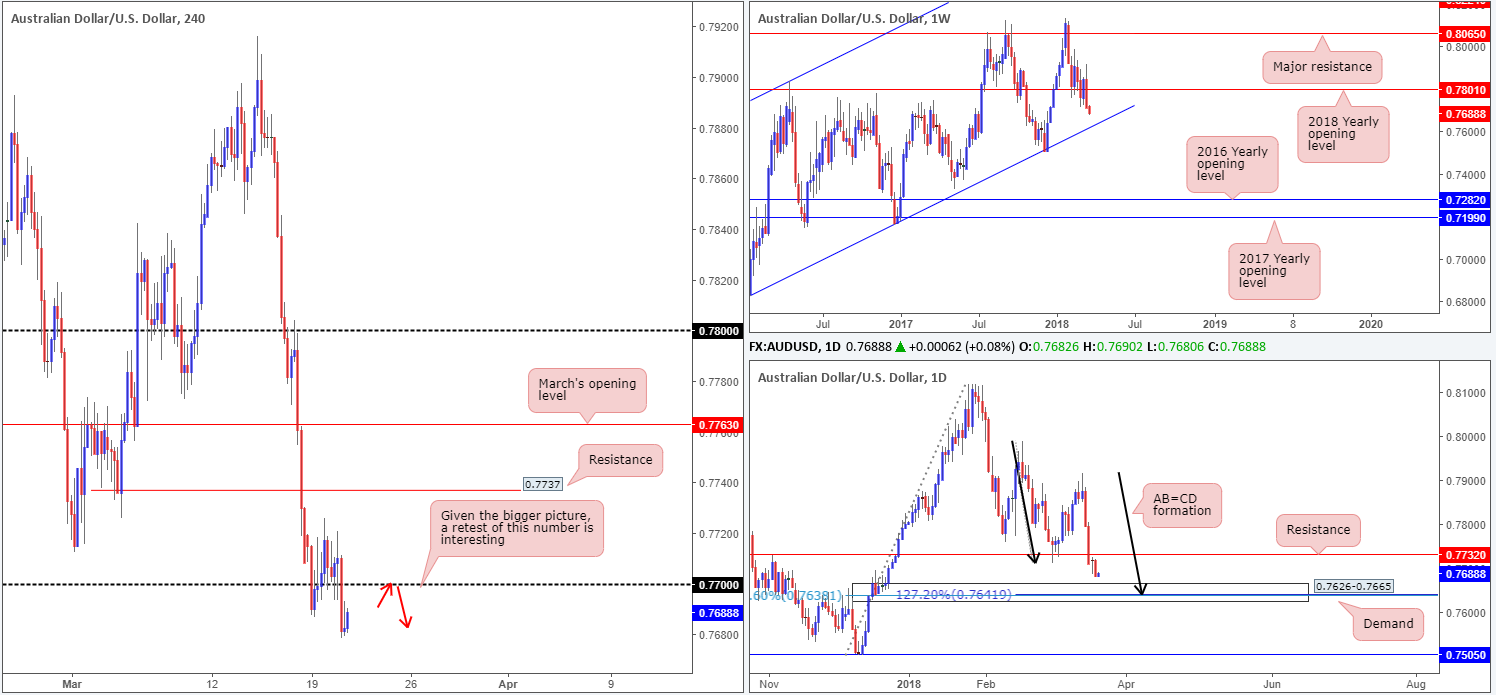
Despite showing promise around the 0.77 band on the H4 timeframe, AUD/USD bulls couldn’t muster enough strength to hold ground on Tuesday, and eventually pressed south as the US dollar advanced ahead of FOMC today. The next port of call beyond 0.77 on the H4 scale appears to be set at the H4 mid-way point 0.7650.
Daily price, on the other hand, shows that we could witness supportive buying enter the market around a daily demand base plotted at 0.7626-0.7665. Traders may have also noticed that this daily area of demand houses a 78.6% daily Fib retracement value at 0.7638 and a daily AB=CD (see black arrows) 127.2% Fib ext. point at 0.7641. Though this area is plotted just north of a major weekly channel support (extended from the low 0.6827), which could effectively drag price action through this daily zone, a bounce from this angle is expected.
Potential trading zones:
With both weekly and daily price showing room for the market to drive lower, an intraday short from the underside of 0.77 could be something to consider today. Downside targets from this angle, as highlighted above, can be seen around the top edge of the daily demand at 0.7665, shadowed closely by the H4 mid-way point at 0.7650.
Data points to consider: US current account at 12.30pm; FOMC economic projections, statement and funds rate decision at 6pm; FOMC press conference at 6.30pm GMT.
Areas worthy of attention:
Supports: 0.7626-0.7665; weekly channel support; 0.7650.
Resistances: 0.77.
USD/JPY:
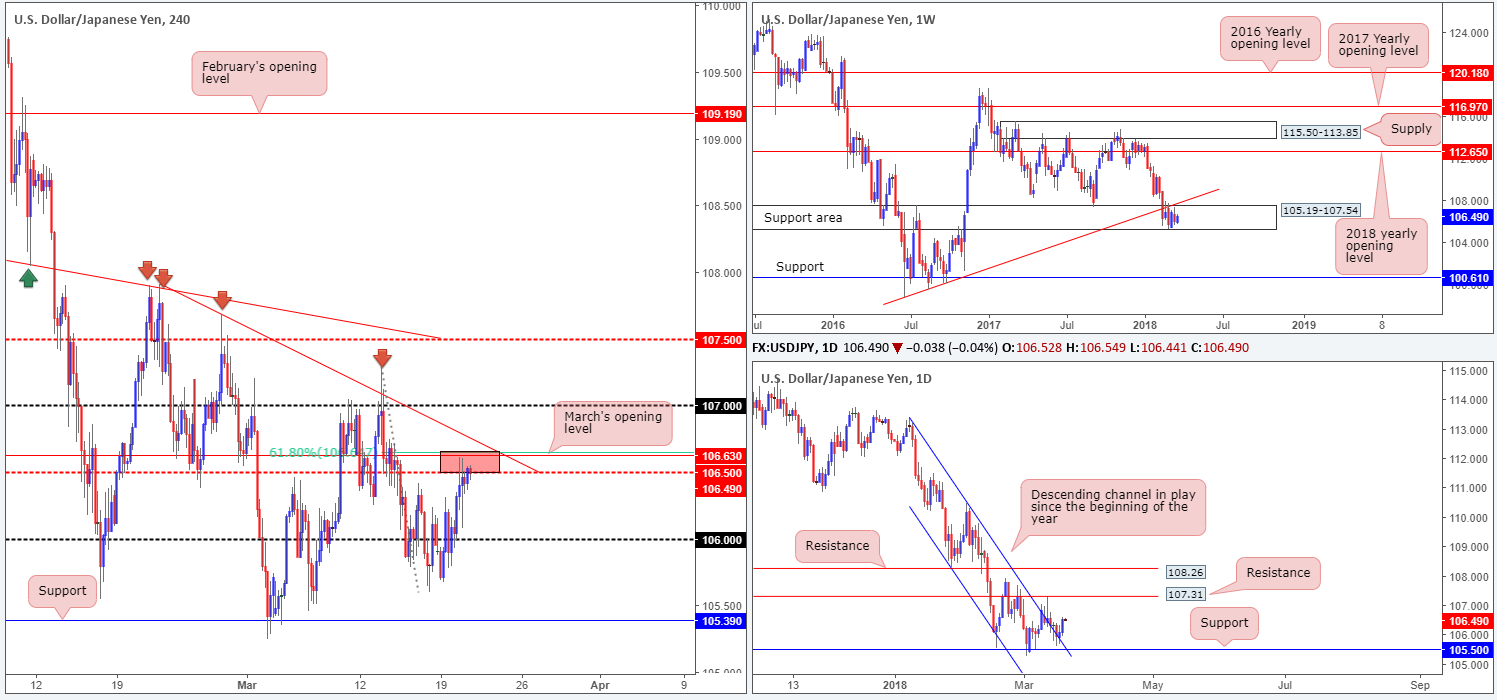
Underpinned by rising US Treasury yields, the USD/JPY managed to print a near-full-bodied daily bull candle yesterday that firmly broke the daily channel resistance line taken from the high 113.38. The next upside target on this scale can be seen at a daily resistance level drawn from 107.31.
While daily price shows promise to the upside, H4 action is currently capped by 106.64/106.50 (comprised of a 61.8% H4 Fib resistance at 106.64, March’s opening level at 106.63 and a H4 mid-level resistance at 106.50), followed closely by a descending H4 trendline taken from the high 107.90. On the weekly chart, however, weekly price remains confined between a weekly support area pegged at 105.19-107.54, and a nearby weekly trendline support-turned resistance etched from the low 98.78.
Potential trading zones:
Neither a long nor short seems attractive at the moment.
Irrespective of whether you decide to buy/sell, opposition is clearly seen at both ends of the spectrum this morning, be it from the current H4 resistance zone or daily directional flow. Therefore, opting to remain on the sidelines, at least until post FOMC, could be the better route to take this morning.
Data points to consider: US current account at 12.30pm; FOMC economic projections, statement and funds rate decision at 6pm; FOMC press conference at 6.30pm GMT.
Areas worthy of attention:
Supports: 105.19-107.54; 106.
Resistances: 106.64/106.50; H4 trendline resistance; 107.31; weekly trendline resistance.
USD/CAD:
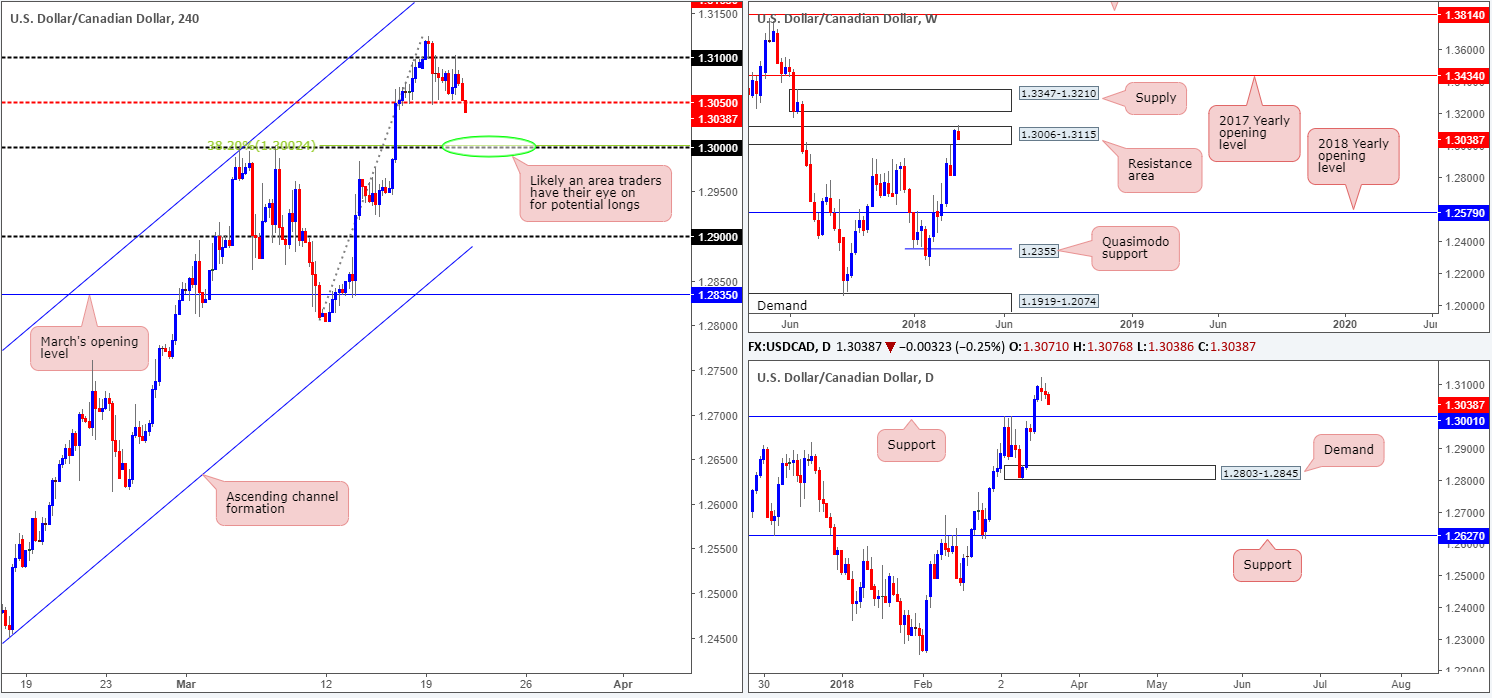
Since topping a few pips above the 1.31 milestone on Monday, the USD/CAD has taken on a more subdued tone so far, despite oil prices climbing higher. As you can see from the H4 timeframe this morning, candle action is somewhat confined between the H4 mid-way support at 1.3050 and the 1.31 handle. A violation to the downside here could open the path south for a challenge of the key level 1.30.
Weekly action continues to loiter around the upper limit of a weekly resistance area coming in at 1.3006-1.3115. Further buying from here could eventually see the unit test weekly supply drawn from 1.3347-1.3210. Looking down to the daily timeframe, however, the team has noted that upside is relatively free to approach a daily resistance level at 1.3207 this week (positioned just ahead of the weekly supply area mentioned above at 1.3347-1.3210).
Potential trading zones:
A decisive break of 1.3050, as mentioned above, could lead to an approach down to the 1.30 handle. This number, given its relationship with daily support at 1.3001 and a 38.2% H4 Fib support, is likely in the firing range for potential longs for many traders this morning.
The ultimate target from 1.30 would be the daily resistance mentioned above at 1.3207. This would, however, entail weekly sellers giving up the current weekly resistance area! Therefore, trailing the position using H4 support/resistances is, we believe, the best approach here.
Data points to consider: US current account at 12.30pm; FOMC economic projections, statement and funds rate decision at 6pm; FOMC press conference at 6.30pm; Crude oil inventories at 2.30pm GMT.
Areas worthy of attention:
Supports: 1.30; 1.3001.
Resistances: 1.3006-1.3115; 1.3207; 1.3347-1.3210; 1.31 handle.
USD/CHF:
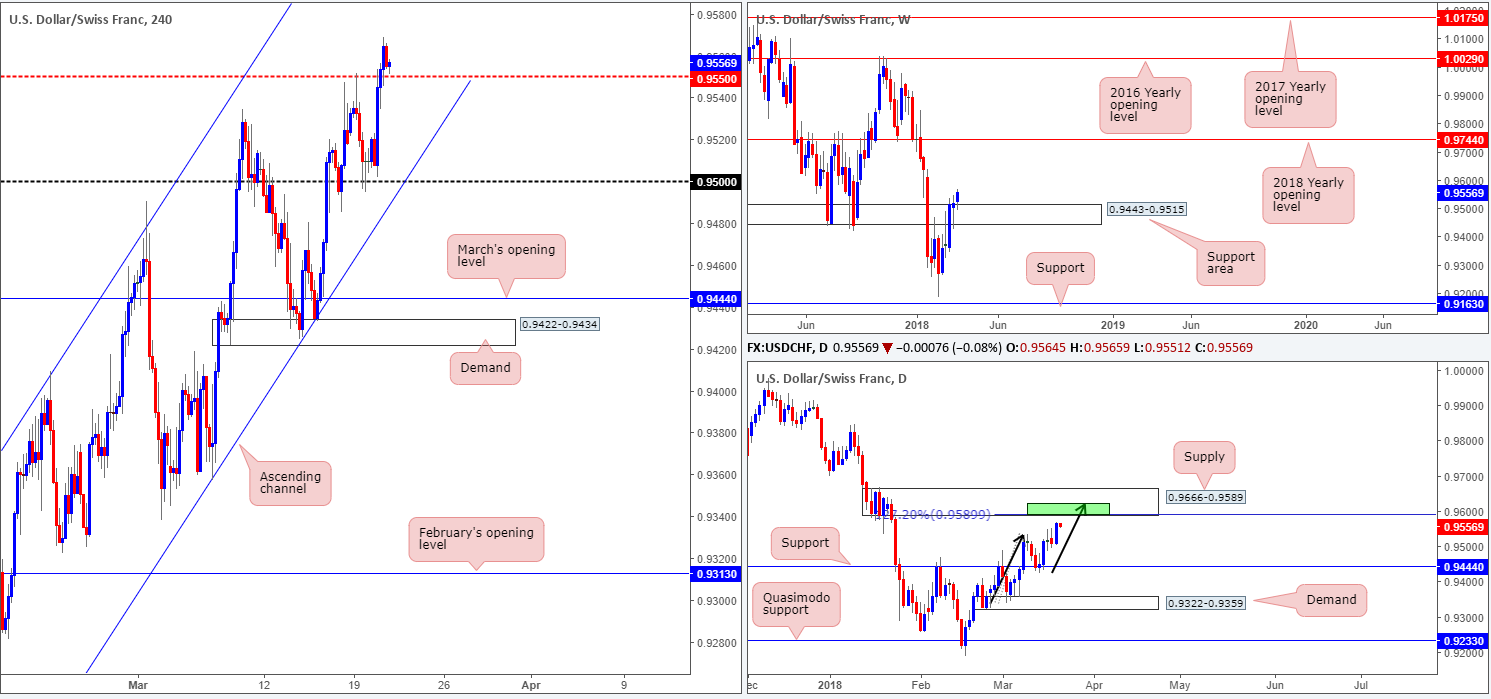
Growing USD demand, alongside rising US Treasury yields, helped bolster the USD/CHF during the course of Tuesday’s sessions. Ahead of the key FOMC decision today, we can see that H4 price is trading just north of the recently broken H4 mid-level resistance at 0.9550, with upside relatively clear to challenge the 0.96 handle.
Weekly price, thanks to yesterday’s advance, is seen establishing a position above the weekly support area coming in at 0.9443-0.9515. The next upside target from this angle does not come onto the radar until we reach the 2018 yearly opening level pegged at 0.9744. According to the daily timeframe, though, the unit is trading within striking distance of a nice-looking daily supply area drawn in at 0.9666-0.9589. Also notable from a technical perspective is the AB=CD (see black arrows and green zone) 127.2% daily Fib ext. point which coincides with the lower edge of the aforesaid daily supply (green area).
Potential trading zones:
Well done to those who caught yesterday’s move north. The H4 buying tails formed from 0.95 were a clear indication of buyer intent!
Going forward, longs from 0.9550 may interest intraday buyers this morning, targeting the lower edge of the noted daily supply at 0.9589, followed closely by the 0.96 handle. Before pressing the buy button, however, waiting for a reasonably sized H4 full or near-full-bodied bull candle to form is, in our technical view, necessary to avoid being taken out on a fakeout.
Data points to consider: US current account at 12.30pm; FOMC economic projections, statement and funds rate decision at 6pm; FOMC press conference at 6.30pm GMT.
Areas worthy of attention:
Supports: 0.95; 0.9550; 0.9443-0.9515.
Resistances: 0.9666-0.9589; 0.96; 0.9744.
DOW 30:
US stocks wrapped up Tuesday’s session in the green, led by energy shares. The sector traded up nearly 1% on the day due to rising oil prices.
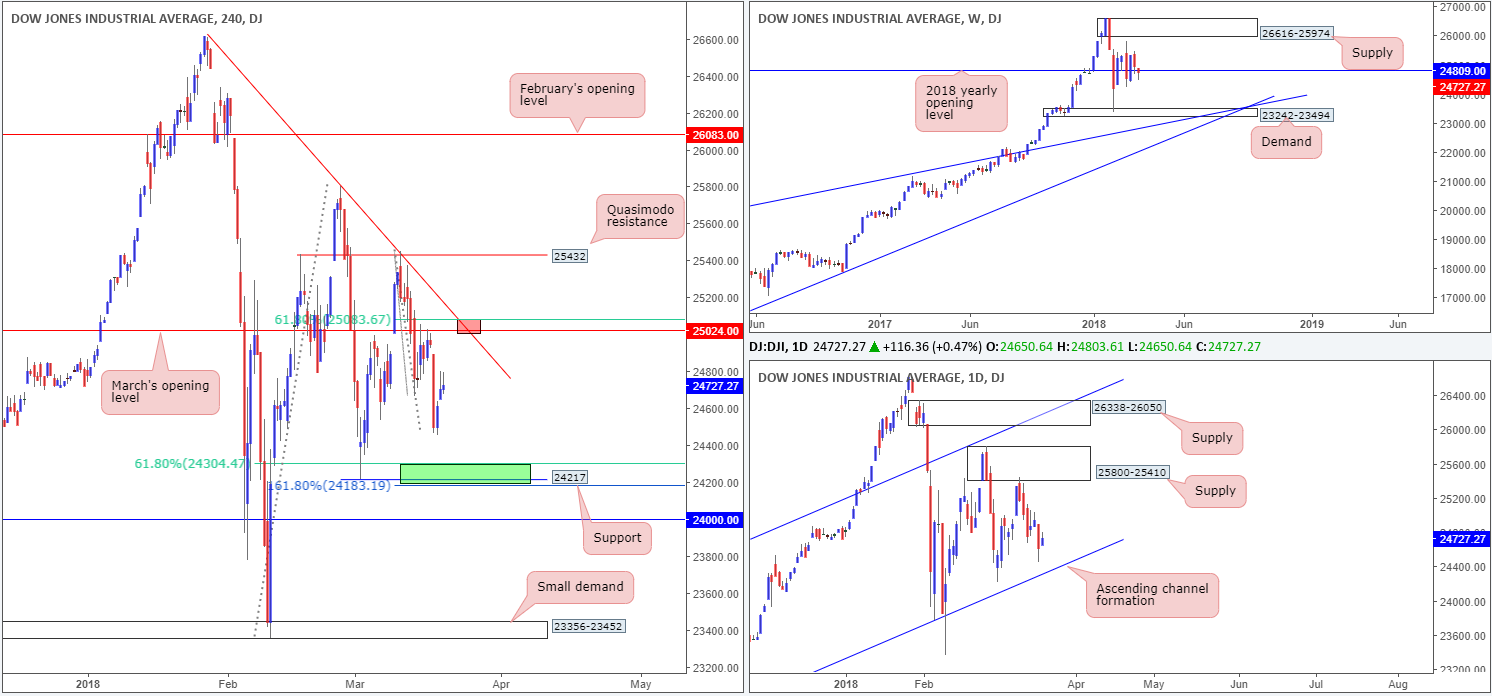
In view of the recent advance, weekly price is seen trading a few points beneath the 2018 yearly opening level seen on the weekly timeframe at 24809. The story on the daily timeframe, however, shows daily price remains hovering just north of a daily channel support extended from the low 17883.
Potential trading zones:
As of current prices, there’s equal opportunity to trade both long and short in this market.
- The H4 area shaded in green at 24183/24304 (comprised of a161.8% Fib ext. at 24183, a swing H4 support at 24217 and a 61.8% Fib support at 24304), which, as far as we can see, intersects with the aforementioned daily channel support line. Longs from here, therefore, could be a consideration.
- March’s opening level at 25024, which happens to unit with a H4 trendline resistance extended from the high 26608, and is positioned nearby a 61.8% H4 Fib resistance at 25083. This area, shaded in red, is likely to bounce price should the index test where the monthly level and trendline intersect.
Data points to consider: US current account at 12.30pm; FOMC economic projections, statement and funds rate decision at 6pm; FOMC press conference at 6.30pm GMT.
Areas worthy of attention:
Supports: 24183/24304; daily channel support.
Resistances: 25083/25024; H4 trendline resistance.
GOLD:
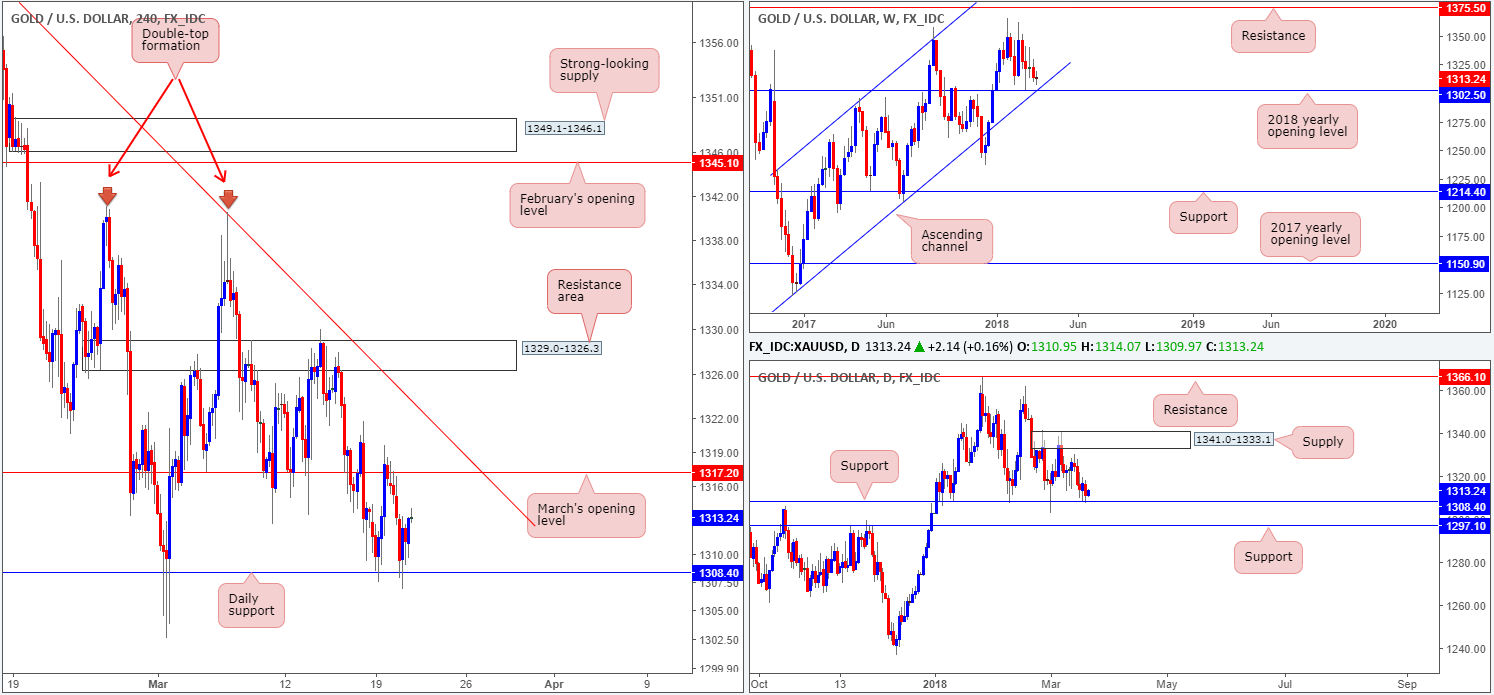
During the course of Tuesday’s session, the price of gold deteriorated from March’s opening level seen on the H4 timeframe at 1317.2. On the back of dollar bids, bullion marginally surpassed Monday’s low at 1307.5 and mildly pared losses into the closing bell from the daily support level at 1308.4.
Daily price, as you can see, remains trading just north of daily support at 1308.4. A violation of this level will likely see daily support at 1297.1 brought into the fray. Weekly movement is seen inching its way closer to the 2018 yearly opening level at 1302.5, which unites beautifully with a long-term weekly channel support etched from the low 1122.8.
Potential trading zones:
Overall, we still believe that XAU/USD bulls have a slight edge, given both the aforementioned daily supports and 2018 yearly opening line with weekly channel support. However, we will not be ‘fully’ convinced until a touch of the 2018 yearly level has been seen.
As for trading setups, eyes will, once again, likely be on March’s opening level for shorts and the current daily support band at 1308.4 for longs. We do not expect the unit to breach this zone ahead of today’s FOMC.
Areas worthy of attention:
Supports: 1308.4; 1302.5; weekly channel support.
Resistances: 1317.2.
This site has been designed for informational and educational purposes only and does not constitute an offer to sell nor a solicitation of an offer to buy any products which may be referenced upon the site. The services and information provided through this site are for personal, non-commercial, educational use and display. IC Markets does not provide personal trading advice through this site and does not represent that the products or services discussed are suitable for any trader. Traders are advised not to rely on any information contained in the site in the process of making a fully informed decision.
This site may include market analysis. All ideas, opinions, and/or forecasts, expressed or implied herein, information, charts or examples contained in the lessons, are for informational and educational purposes only and should not be construed as a recommendation to invest, trade, and/or speculate in the markets. Any trades, and/or speculations made in light of the ideas, opinions, and/or forecasts, expressed or implied herein, are committed at your own risk, financial or otherwise.
The use of the site is agreement that the site is for informational and educational purposes only and does not constitute advice in any form in the furtherance of any trade or trading decisions.
The accuracy, completeness and timeliness of the information contained on this site cannot be guaranteed. IC Markets does not warranty, guarantee or make any representations, or assume any liability with regard to financial results based on the use of the information in the site.
News, views, opinions, recommendations and other information obtained from sources outside of www.icmarkets.com.au, used in this site are believed to be reliable, but we cannot guarantee their accuracy or completeness. All such information is subject to change at any time without notice. IC Markets assumes no responsibility for the content of any linked site. The fact that such links may exist does not indicate approval or endorsement of any material contained on any linked site.
IC Markets is not liable for any harm caused by the transmission, through accessing the services or information on this site, of a computer virus, or other computer code or programming device that might be used to access, delete, damage, disable, disrupt or otherwise impede in any manner, the operation of the site or of any user’s software, hardware, data or property.


