Waiting for lower timeframe confirmation is our main tool to confirm strength within higher timeframe zones, and has really been the key to our trading success. It takes a little time to understand the subtle nuances, however, as each trade is never the same, but once you master the rhythm so to speak, you will be saved from countless unnecessary losing trades. The following is a list of what we look for:
- A break/retest of supply or demand dependent on which way you’re trading.
- A trendline break/retest.
- Buying/selling tails/wicks – essentially we look for a cluster of very obvious spikes off of lower timeframe support and resistance levels within the higher timeframe zone.
We typically search for lower-timeframe confirmation between the M15 and H1 timeframes, since most of our higher-timeframe areas begin with the H4. Stops are usually placed 1-3 pips beyond confirming structures.
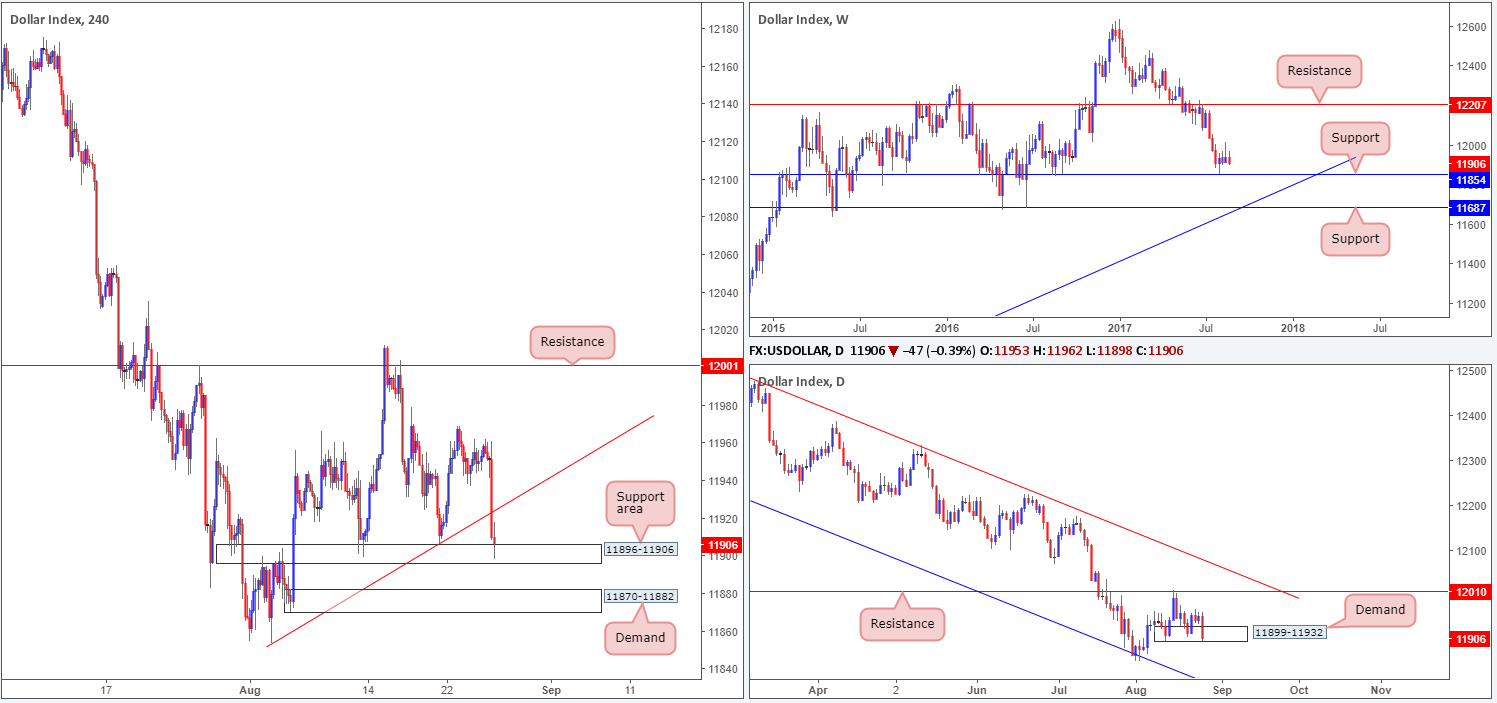
US dollar index (USDX):
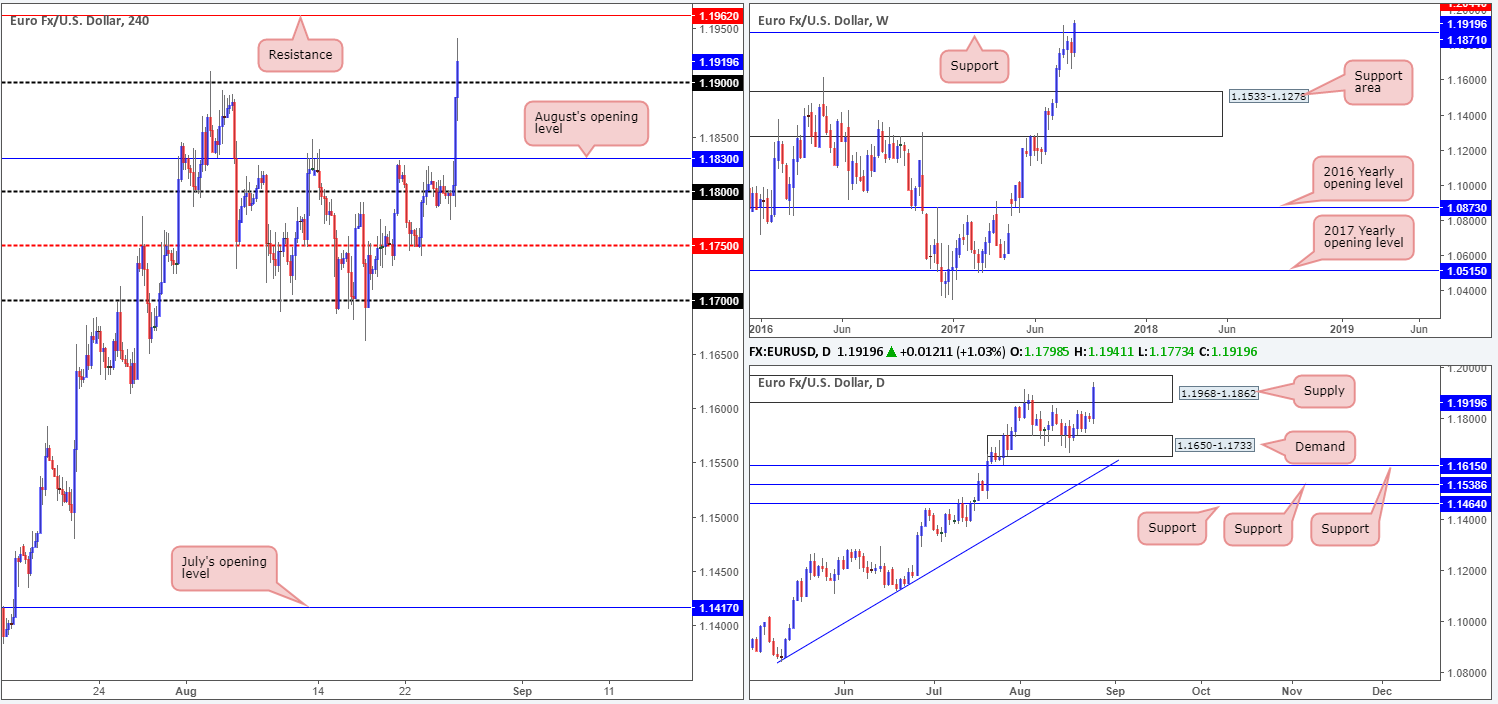
EUR/USD:
Weekly gain/loss: + 161 pips
Weekly closing price: 1.1919
The EUR was seen flexing its financial muscle last week, as weekly action crossed above resistance at 1.1871. Providing that the bulls can continue to dominate above this line, the next port of call will likely be the resistance line printed at 1.2044 (not seen on the screen). Something else that’s worth noting is the USDX failed to breach support planted at 11854, while the EUR, as we already know, managed to push above its correlating resistance. Could this signify that the recent push north lacks energy?
The story on the daily timeframe shows that the recent move north largely took place on Friday, resulting in a push up into a supply zone pegged at 1.1968-1.1862. Also worth mentioning is the daily demand on the USDX at 11899-11932, which was brought into play due to Friday’s selloff. This area held the dollar higher in the early stages of last week and therefore we could see history repeat itself. A push north from here would highly likely translate into a push lower from the daily supply currently seen on the EUR.
A quick recap of Friday’s movement on the H4 timeframe reveals that the single currency punched above August’s opening level at 1.1830, following Yellen’s speech. After a minor spell of consolidation, the pair was further bid on comments made by Draghi regarding global and European recovery, consequently ending the day above the 1.19 handle. This could, technically speaking, set the stage for price to approach resistance located at 1.1962.
Suggestions: So, let’s just run through what we have here. Weekly price suggests further buying could be on the cards. Daily price shows the unit trading around the upper edge of supply at 1.1968-1.1862. And H4 price points to a possible move up to a nearby resistance at 1.1962, which happens to be planted within the upper edge of the said daily supply.
Assuming 1.19 holds form, the noted H4 resistance will likely be bought into the picture either today or tomorrow. A long based on this is not something we’d be comfortable with given the current daily supply. A sell trade from the H4 resistance line, however, is tempting given its location within the daily supply. Though, selling into potential weekly flow above resistance and the pair’s underlying trend is also not something we’d be comfortable participating in.
With the above points in mind, we will remain flat today and look to reassess structure going into Tuesday’s open.
Data points to consider: No high-impacting news events scheduled today.
Levels to watch/live orders:
- Buys: Flat (stop loss: N/A).
- Sells: Flat (stop loss: N/A).
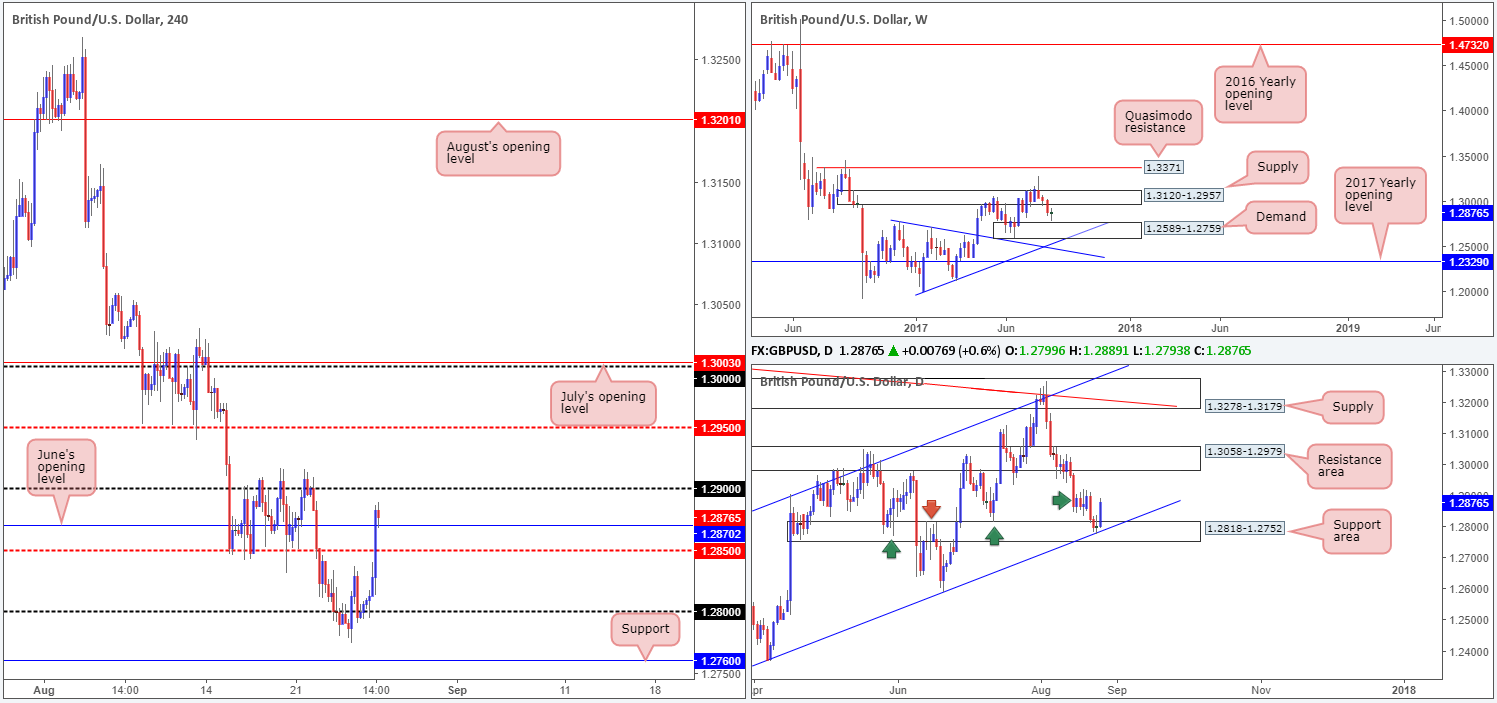
GBP/USD:
Weekly gain/loss: + 6 pips
Weekly closing price: 1.2876
GBP/USD prices are effectively unchanged this week, despite the pair ranging close to 150 pips. As a consequence, weekly movement remains loitering mid-range between demand at 1.2589-1.2759 and a supply coming in at 1.3120-1.2957.
On the daily timeframe, we can see that price bounced strongly from the support area at 1.2818-1.2752 last week, which happens to intersect with a channel support line etched from the low 1.2365. Another key thing to note here is this area is seen glued to the top edge of the aforementioned weekly demand. To the upside, however, there’s a lot of wood to chop through between 1.2913/1.2855ish (green arrow), before price can look to approach the resistance area at 1.3058-1.2979.
Following Janet Yellen’s speech on Friday, the US dollar plunged across the board and lifted the GBP above both the H4 mid-level resistance at 1.2850 and June’s opening level at 1.2870. The day ended with the unit retesting 1.2870 as support.
Suggestions: A decisive close above the 1.29 handle, followed with a retest of this number as support is, in our estimation, a strong signal that the bulls may be looking for 1.2950. Trading beyond 1.2950 is challenging, nevertheless, due to the underside of weekly supply positioned at 1.2957 and the lower edge of the daily resistance area at 1.2979.
Data points to consider: UK banks closed in observance of the Summer Bank Holiday. No high-impacting news events scheduled today.
Levels to watch/live orders:
- Buys: Watch for H4 price to close above 1.29 and then look to trade any retest seen thereafter ([waiting for a lower-timeframe buy signal to form [see the top of this report] following the retest is advised] stop loss: dependent on where one confirms the number).
- Sells: Flat (stop loss: N/A).
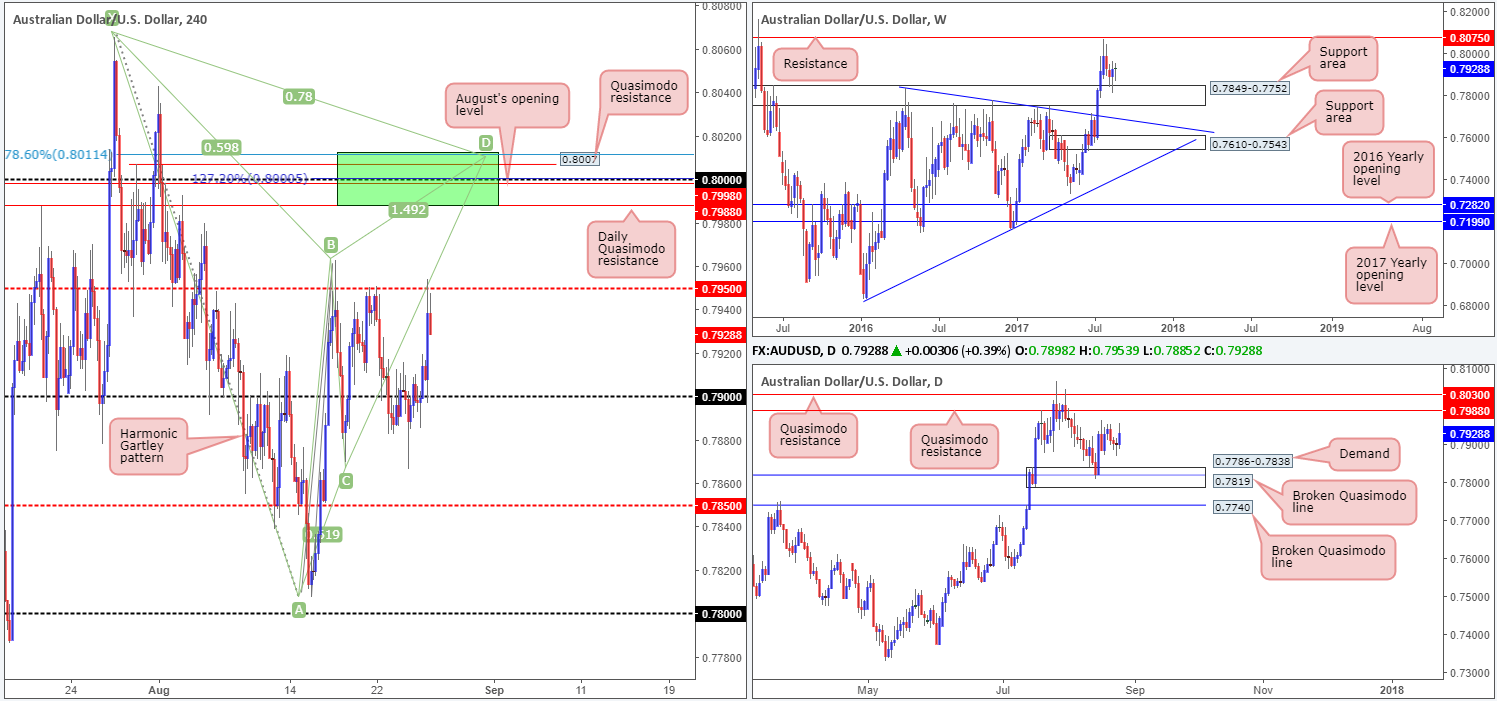
AUD/USD:
Weekly gain/loss: + 4 pips
Weekly closing price: 0.7928
Weekly bulls, as can be seen from the weekly timeframe, continued to defend the support area at 0.7849-0.7752 last week. Further buying from this vicinity could eventually see the bulls shake hands with resistance carved from 0.8075 (a resistance line that stretches as far back as 2008).
Turning over a page to the daily timeframe, the candles are seen trading 40 or so pips ahead of the Quasimodo resistance level at 0.7988. Traders may have also noticed the other Quasimodo resistance level lurking just above at 0.8030. This line was already tested at the end of July, and as you can see, held beautifully.
Looking across to the H4 candles, the 0.79 handle was reclaimed as support on Friday after the release of Janet Yellen’s speech, lifting the commodity currency up to the 0.7950 neighborhood. In previous reports you may recall our team highlighting the 0.80 level as a particularly interesting sell zone. Apart from 0.80 being a watched round number, there are several nearby structures that deserve mention:
- The daily Quasimodo resistance level at 0.7988.
- A H4 Quasimodo resistance level at 0.8007.
- A H4 127.2% Fib ext. point at 0.80 taken from the low 0.7807.
- August’s opening level at 0.7998.
- A H4 Harmonic Gartley reversal point at the 78.6% Fib resistance line drawn from 0.8011.
Suggestions: While the above structures (H4 green sell zone) boast attractive confluence, one must take into account the possibility that a fakeout may be seen up to the daily Quasimodo resistance level at 0.8030 sited just above the green zone. Traditionally, when trading the Gartley Harmonic pattern the stop-loss order should go beyond the X point (0.8065). If you were to follow this, a fakeout up to the daily Quasimodo resistance is not a concern. It is more for the aggressive traders who will likely look to position stops just beyond the green zone. Should you be one of those traders, you may want to consider waiting for the H4 candles to prove seller intent from the sell zone (in the form of either a full, or near-full-bodied bearish candle), before pulling the trigger. This will help avoid a fakeout should it occur.
Data points to consider: No high-impacting news events scheduled today.
Levels to watch/live orders:
- Buys: Flat (stop loss: N/A).
- Sells: 0.8011/0.7988 (stop loss: either wait for a H4 bearish candle to form in the shape of a full, or near-full-bodied candle, and place stops above the candle’s wick. Another option is to simply enter at 0.80 and place stops above the H4 Harmonic X point at 0.8067).
USD/JPY:
Weekly gain/loss: + 13 pips
Weekly closing price: 109.32
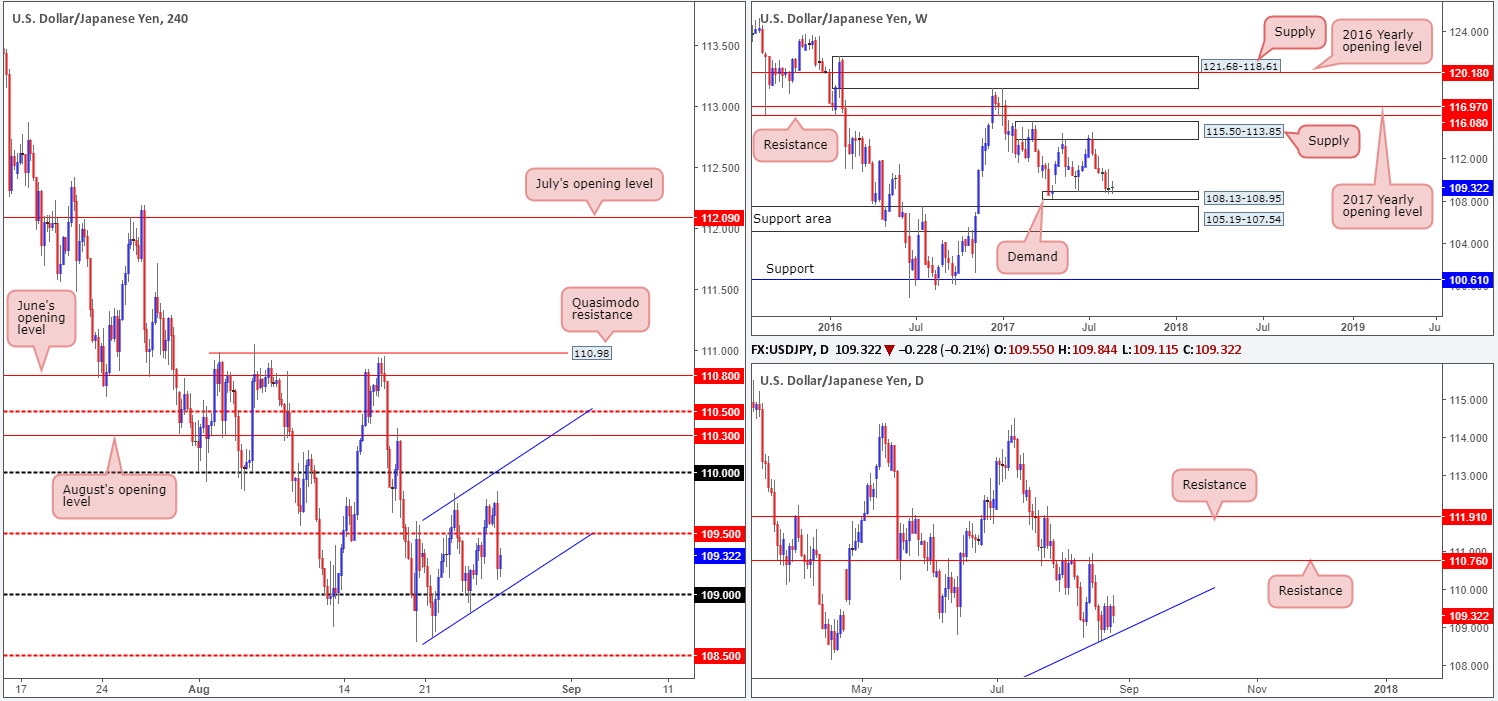
Similar to the week before, last week’s trading shows little change. The only difference this time is weekly price printed an indecision candle and not an inverted selling wick. Should the bulls remain lethargic here, this could eventually lead to the unit driving lower and challenging the large support area seen just below at 105.19-107.54.
Fusing closely with the weekly demand, however, is a daily trendline support etched from the low 100.08. Assuming that this line remains in place, this could attract fresh buyers into the market as the next upside target comes in at a resistance level marked at 110.76.
On the H4 timeframe, we can see that the candles spent the week forming an ascending channel formation (108.63/109.59). On Friday, price ran through bids at 109.50 after Janet Yellen’s speech at Jackson Hole and concluded the day closing ahead of the 109 handle.
Suggestions: Given that the 109 handle converges with the noted H4 channel support line, a test of this number would be attractive – even more so considering the current daily trendline support in play. Should this come to fruition, we’d expect the unit to reach at least 109.50.
Data points to consider: No high-impacting news events scheduled today.
Levels to watch/live orders:
- Buys: 109 region ([waiting for a lower-timeframe confirming buy signal [see the top of this report] to form before pulling the trigger is advised] stop loss: dependent on where one confirms this area).
- Sells: Flat (stop loss: N/A).
USD/CAD:
Weekly gain/loss: – 102 pips
Weekly closing price: 1.2480
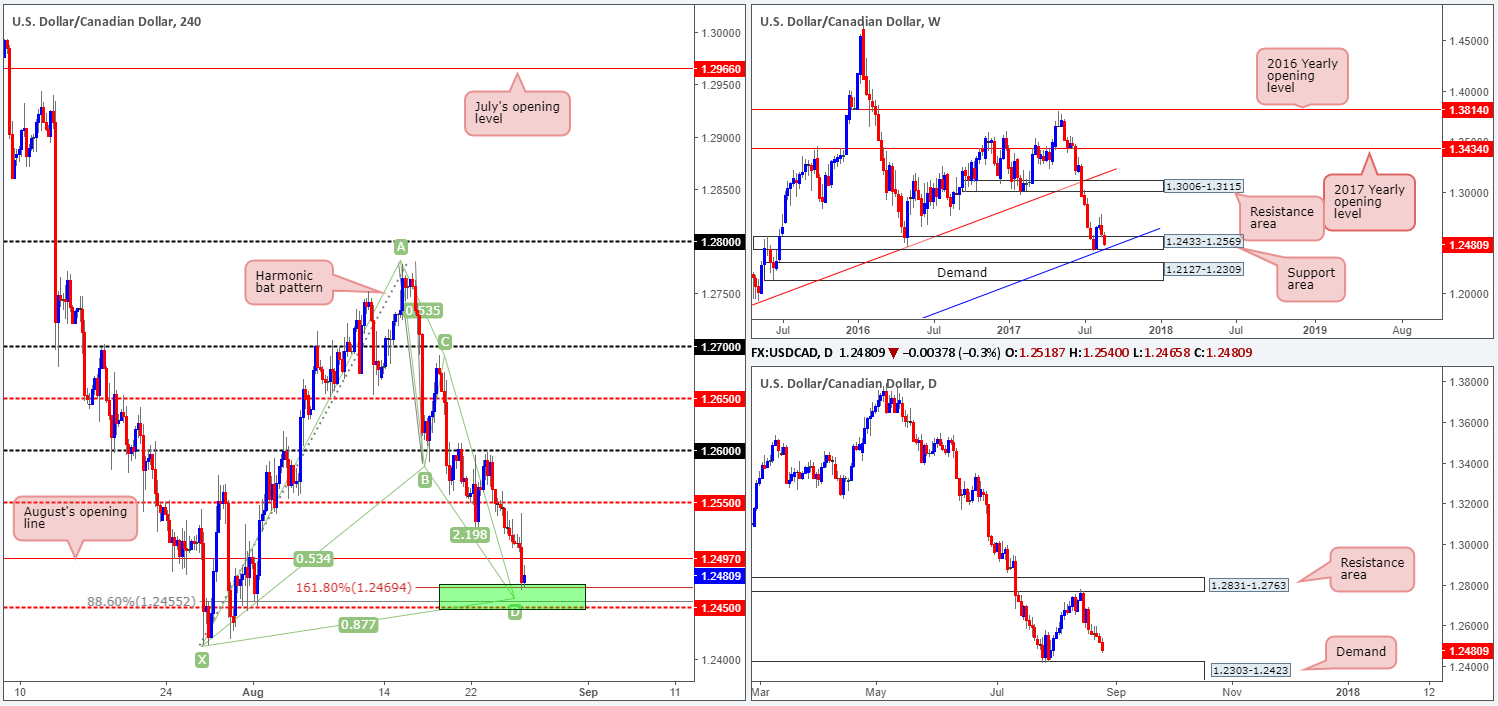
The USD/CAD sustained further losses last week, consequently pushing the weekly candles deeper into the weekly support area coming in at 1.2433-1.2569 (unites with a trendline support etched from the low 0.9633).
Since daily price struck the underside of a resistance zone drawn from 1.2831-1.2763, the pair has been trading south. Should the bears continue to dominate from here, the next area on the hit list is the nearby demand penciled in at 1.2303-1.2423 (positioned just below the aforementioned weekly support area).
Reviewing Friday’s movement on the H4 timeframe, we can see that price aggressively pushed through August’s opening level at 1.2497 (following Yellen’s comments) and ended the day testing a very interesting buy zone at 1.2450/1.2469. Comprised of a H4 mid-level support at 1.2450, a H4 AB=CD 161.8% Fib ext. point at 1.2469 and a powerful XA 88.6% Fib retracement at 1.2455 (Harmonic bat pattern), this area, along with the noted weekly support area and its converging weekly trendline support, will likely offer a buy trade today.
Suggestions: In the event that the H4 Harmonic pattern completes at 1.2455, we will be interested buyers here. Additional confirmation, in our opinion, is not required since we can comfortably place stops beyond the X point (1.2413) and still achieve adequate risk/reward.
Data points to consider: No high-impacting news events scheduled today.
Levels to watch/live orders:
- Buys: 1.2455 (stop loss: 1.2411).
- Sells: Flat (stop loss: N/A).
USD/CHF:
Weekly gain/loss: – 87 pips
Weekly closing price: 0.9559
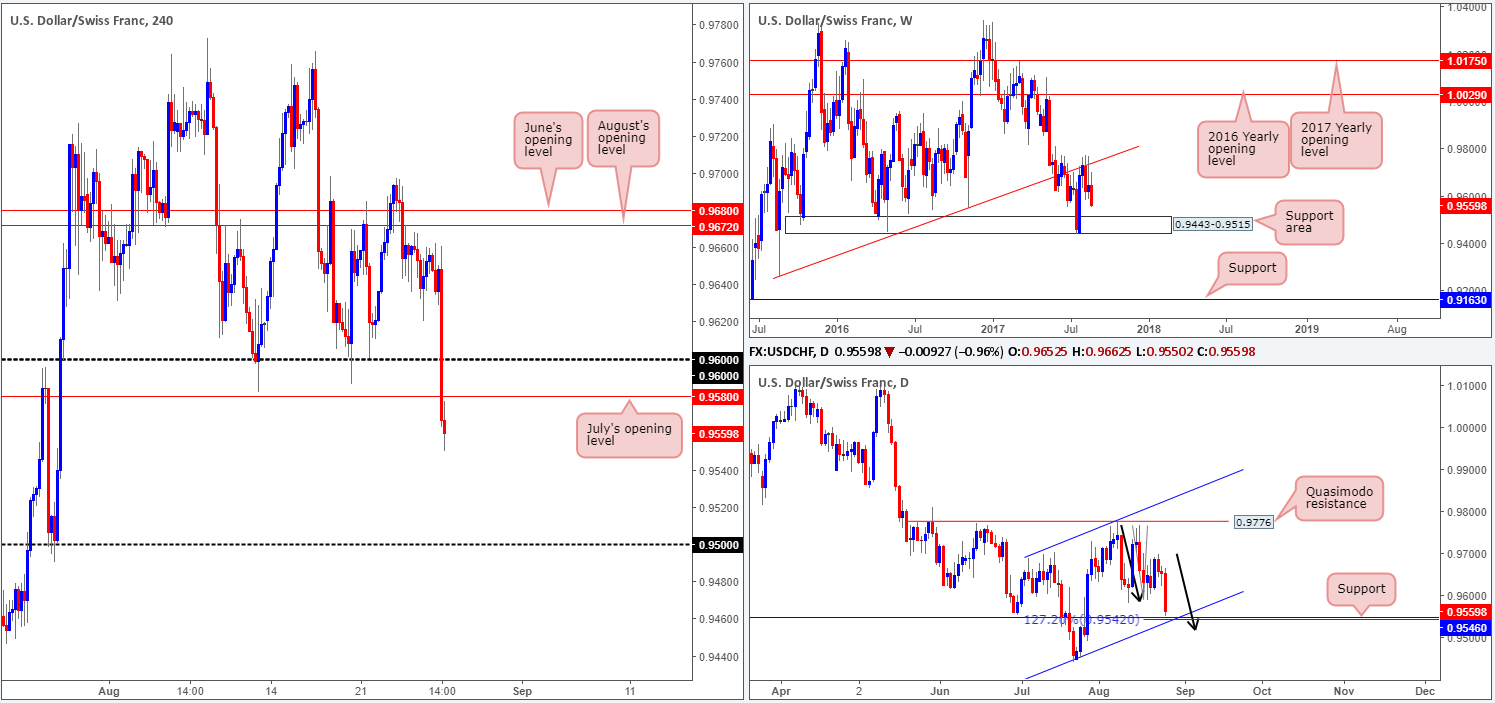
Recent action on the weekly timeframe shows the USD/CHF extended its bounce from the trendline resistance taken from the low 0.9257. This has firmly placed the support area at 0.9443-0.9515 back on the hit list.
A closer look at price action on the daily timeframe, however, actually shows that the unit is now tackling a support level coming in at 0.9546, which happens to unite with a channel support etched from the low 0.9438. What also gives this support extra credibility is the AB=CD (black arrows) 127.2% ext. point at 0.9542.
Dollar bears were the clear winner on Friday after Fed Chair Janet Yellen offered little insight on monetary policy. The move took out the 0.96 handle and July’s opening level at 0.9580, potentially clearing the path south down to the 0.95 handle.
With the above taken on board, we feel we may be in a little bit of a tricky situation. Weekly suggests further selling could be on the cards. Daily shows price trading from a confluent support and H4 price indicates a move down to the 0.95 handle could be on the horizon. To that end, whatever direction one selects, you’re going to be up against either possible daily buying or weekly selling.
Suggestions: A short from between 0.96/0.9580 is attractive given weekly flow, but this would, as explained above, entail selling into a potential move from daily support. Personally, we feel the best path to take here is to remain on the sidelines and reassess structure going into tomorrow’s open.
Data points to consider: No high-impacting news events scheduled today.
Levels to watch/live orders:
- Buys: Flat (stop loss: N/A).
- Sells: Flat (stop loss: N/A).
DOW 30:
Weekly gain/loss: + 124 points
Weekly closing price: 21818
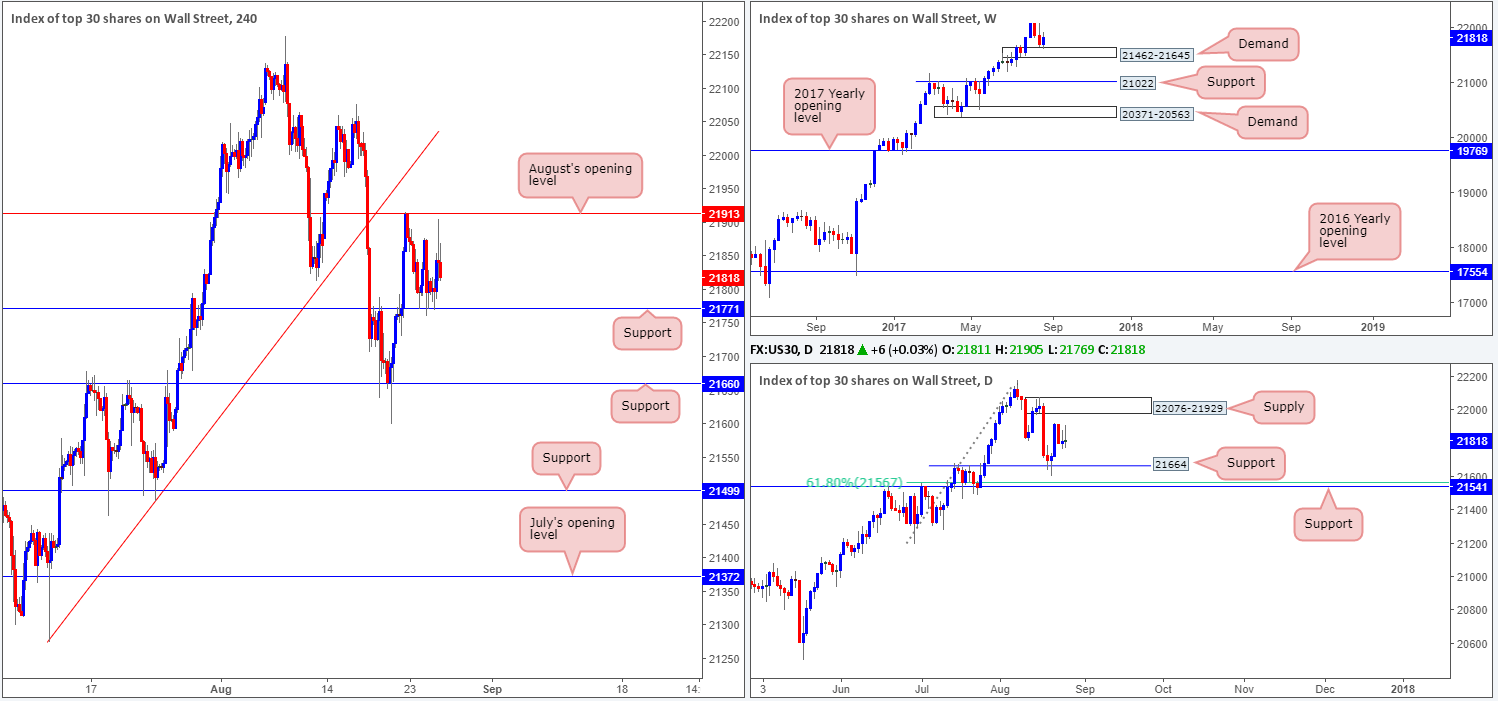
Breaking a two-week bearish phase, the bulls recovered nicely from a weekly demand base last week at 21462-21645. With little overhead resistance to contend with on the weekly timeframe, further buying could be seen in the weeks to come.
Daily price on the other hand is currently sandwiched between support at 21664 and a supply base drawn from 22076-21929. Therefore, it may be a good idea to wait for price to engulf the current daily supply before looking to buy this market and join, what seems to be, a never-ending trend.
Since Tuesday, the H4 candles have been consolidating between support at 21771 and August’s opening level pegged at 21913. Our initial thought was to look to buy above 21913, but this would have us entering long into the underside of the current daily supply area. Not the best of trading ideas!
Our suggestions: Another option could be a buy from the current support level. With additional confirmation in the form of a H4 bullish candle (preferably a full, or near-full-bodied candle), we feel a buy from here may be viable, targeting 21913, followed closely by 21929: the underside of the daily supply.
Data points to consider: No high-impacting news events scheduled today.
Levels to watch/live orders:
- Buys: 21771 region ([waiting for a reasonably sized H4 bullish candle to form – preferably a full, or near-full-bodied candle – is advised] stop loss: ideally beyond the candle’s tail).
- Sells: Flat (stop loss: N/A).
GOLD:
Weekly gain/loss: + $7.7
Weekly closing price: 1291.2
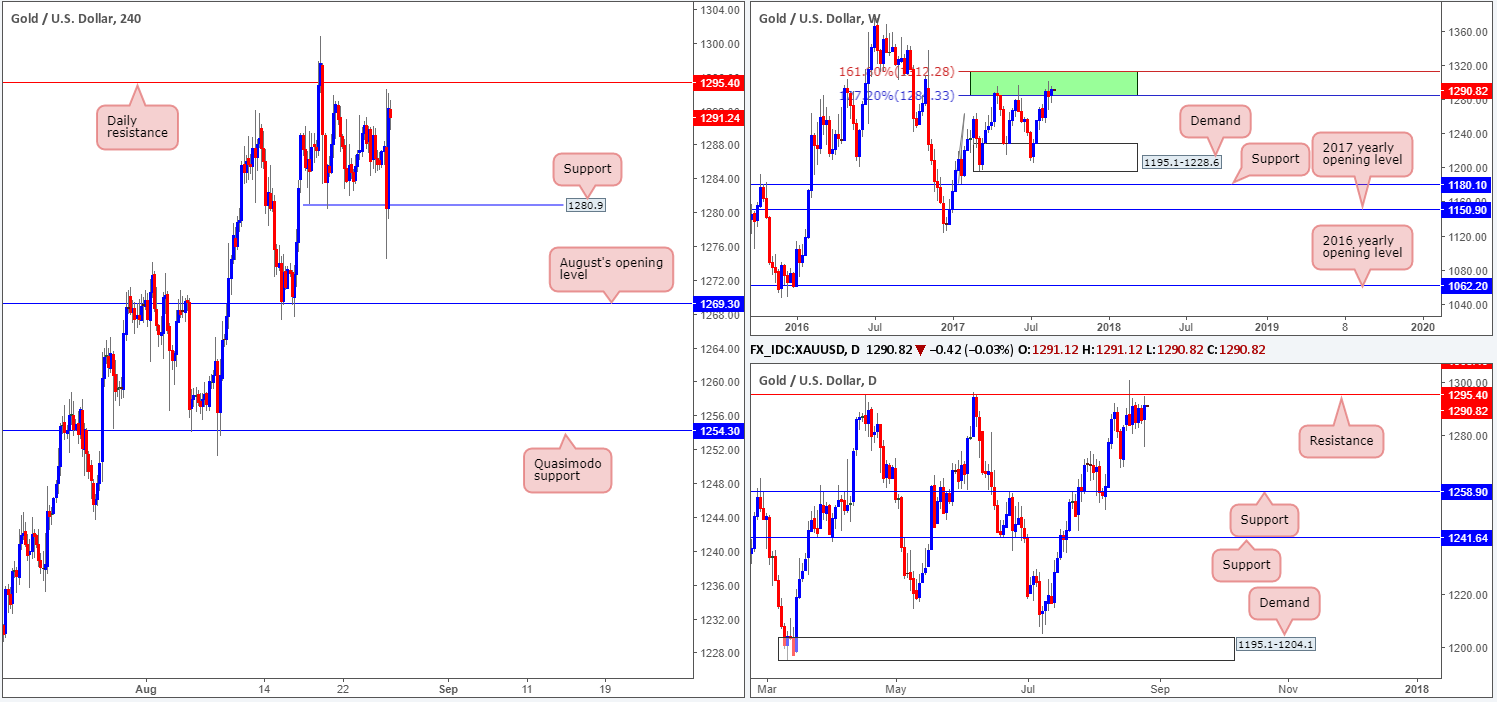
For the past two weeks, weekly buyers and sellers have been seen battling for position within a green weekly resistance area comprised of two weekly Fibonacci extensions 161.8/127.2% at 1312.2/1284.3 taken from the low 1188.1. This is the highest price has closed within this zone since the area has been in play.
Moving down to the daily timeframe, we can see resistance at 1295.4 remains in motion. Apart from the two occasions on 17/04/2017 and 06/06/2017, there’s little history registered with this number! For that reason, we may see price eventually break above this line and head toward the resistance carved from 1308.4 (not seen on the screen), which boasts very attractive history dating back to early 2011.
A brief look at recent dealings on the H4 timeframe saw the yellow metal aggressively whipsaw through support at 1280.9, and conclude the day mildly paring gains ahead of the daily resistance mentioned above at 1295.4. The initial move came after Yellen’s rather uneventful speech at Jackson Hole.
Our suggestions: Based on the above notes, our desk will not be looking for (long-term) shorts until the daily resistance line plotted at 1308.4 is in play. This is due to the history surrounding this number and its position within the current weekly resistance area (allowing us to place stops tightly above this zone).
Levels to watch/live orders:
- Buys: Flat (stop loss: N/A).
- Sells: 1308.4 region. This is, given the location of this daily resistance on the weekly timeframe, a fantastic level to be looking for shorts if the number comes into view.


