Waiting for lower timeframe confirmation is our main tool to confirm strength within higher timeframe zones, and has really been the key to our trading success. It takes a little time to understand the subtle nuances, however, as each trade is never the same, but once you master the rhythm so to speak, you will be saved from countless unnecessary losing trades. The following is a list of what we look for:
- A break/retest of supply or demand dependent on which way you’re trading.
- A trendline break/retest.
- Buying/selling tails/wicks – essentially we look for a cluster of very obvious spikes off of lower timeframe support and resistance levels within the higher timeframe zone.
- Candlestick patterns. We tend to stick with pin bars and engulfing bars as these have proven to be the most effective.
We typically search for lower-timeframe confirmation between the M15 and H1 timeframes, since most of our higher-timeframe areas begin with the H4. Stops are usually placed 3-5 pips beyond confirming structures.
EUR/USD:
Weekly gain/loss: – 13 pips
Weekly closing price: 1.0602
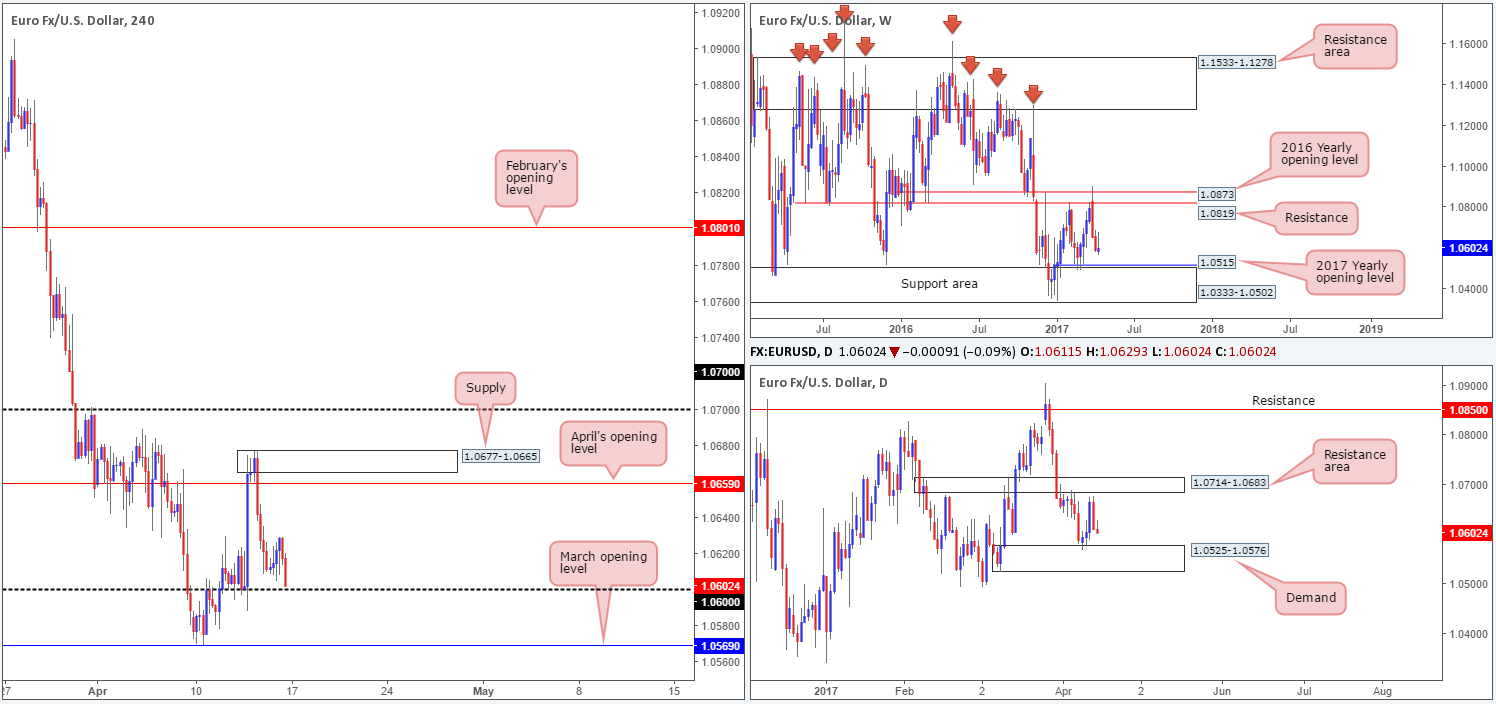
The shared currency is effectively unchanged this week, despite ranging over 100 pips. From the weekly timeframe, the sellers still appear to have the upper hand, which could eventually force price to shake hands with the 2017 yearly opening level at 1.0515/support area at 1.0333-1.0502 sometime this week. With this area having been a considerable support and resistance zone in this market since late 1997, selling pressure is expected to diminish here.
Moving down to the daily timeframe, we can see that the candles are somewhat capped between a resistance area 1.0714-1.0683 and a demand base coming in at 1.0525-1.0576 (positioned ten pips above the aforementioned 2017 yearly opening level).
A quick recap of Friday’s trading on the H4 chart shows that the unit was essentially moving sideways, as the majority of the market were enjoying some vacation time. Going into the later hours of the US segment, however, price sold off and closed the day just ahead of the 1.06 handle.
Our suggestions: Our desk, as well as the majority of the market participants, will, once again, refrain from taking any heavy positions today due to Easter Monday. As such, we do not expect to see much movement. For those still wishing to try their hand, levels of interest this morning remain the same as Friday’s report:
- The 1.06 handle given how well it held after Trump’s comments regarding the US dollar.
- 1.0569: March’s opening level, which happens to be located within daily demand at 1.0525-1.0576.
Data points to consider: No high-impacting news events scheduled on the docket today.
Levels to watch/live orders:
- Buys: Flat (stop loss: N/A).
- Sells: Flat (stop loss: N/A).
GBP/USD:
Weekly gain/loss: + 152 pips
Weekly closing price: 1.2521
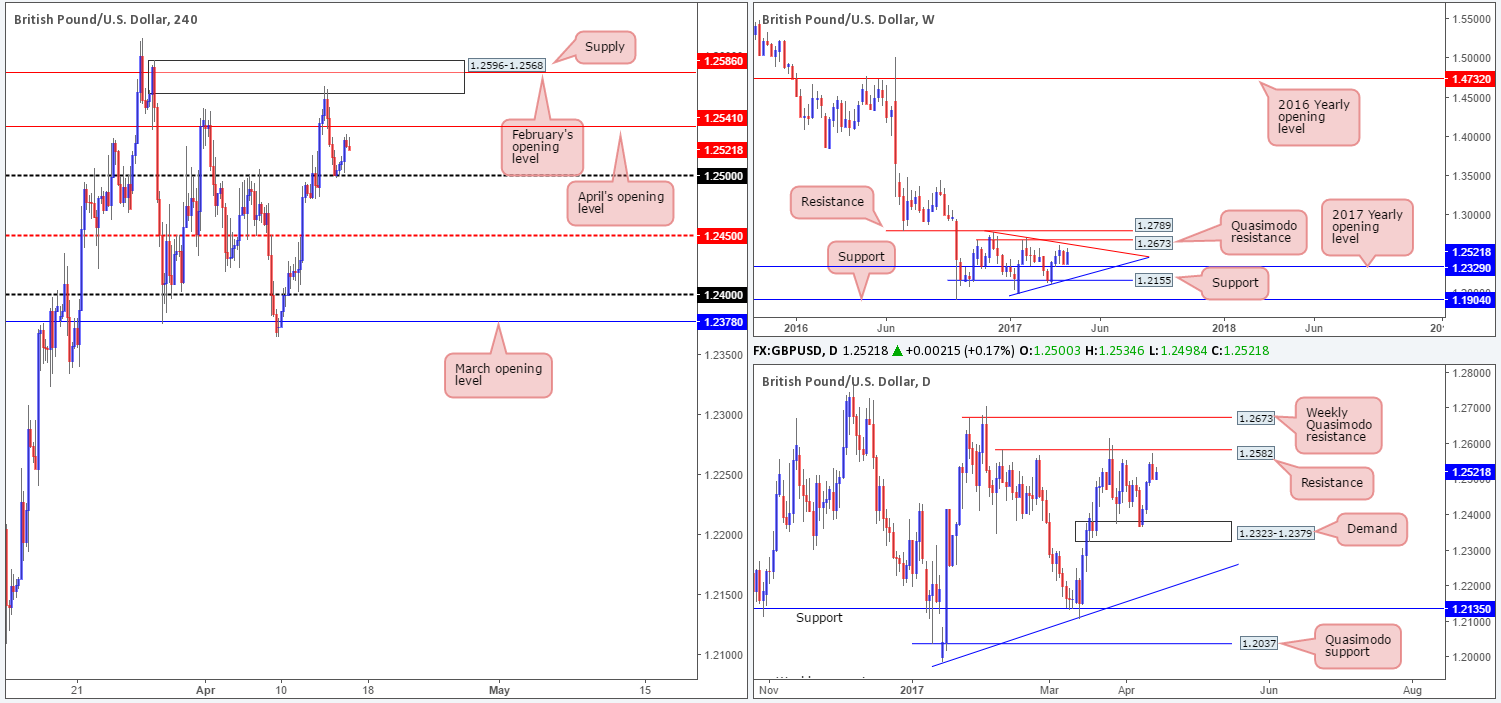
Over the last week, the GBP changed tracks and reversed the majority of the prior week’s losses. From the weekly timeframe, there sits the 2017 yearly opening level below at 1.2329, and to the upside we have a trendline resistance extended from the high 1.2774. Also noteworthy on the weekly timeframe is the potential bearish pennant currently in motion (1.2774/1.1986).
Daily demand at 1.2323-1.2379 (houses the said 2017 yearly opening level), as you can see, held firm last week and lifted price up to within an inch of resistance coming in at 1.2582. To our way of seeing things, this has formed a nice-looking range, which is certainly worth keeping an eye on.
Although Friday’s action on the H4 chart was thin due to Good Friday, the 1.25 handle managed to remain firm during the day. As you can see, the major rallied and put in a top ahead of April’s opening level at 1.2541.
Our suggestions: Similar to Friday’s report, we are not anticipating much movement today given the majority of banks being closed in observance of Easter Monday. For those wishing to participate, we really like the look of February’s opening level at 1.2586 for a bounce. Not only is it submerged within H4 supply at 1.2596-1.2568, it is also positioned within striking distance of the daily resistance mentioned above at 1.2582 and located nearby the aforementioned weekly trendline resistance.
Data points to consider: No high-impacting news events scheduled on the docket today.
Levels to watch/live orders:
- Buys: Flat (stop loss: N/A).
- Sells: 1.2586 region ([waiting for additional lower-timeframe confirming price action is advised [see the top of this report] stop loss: dependent on where one confirms this area).
AUD/USD:
Weekly gain/loss: + 73 pips
Weekly closing price: 0.7574
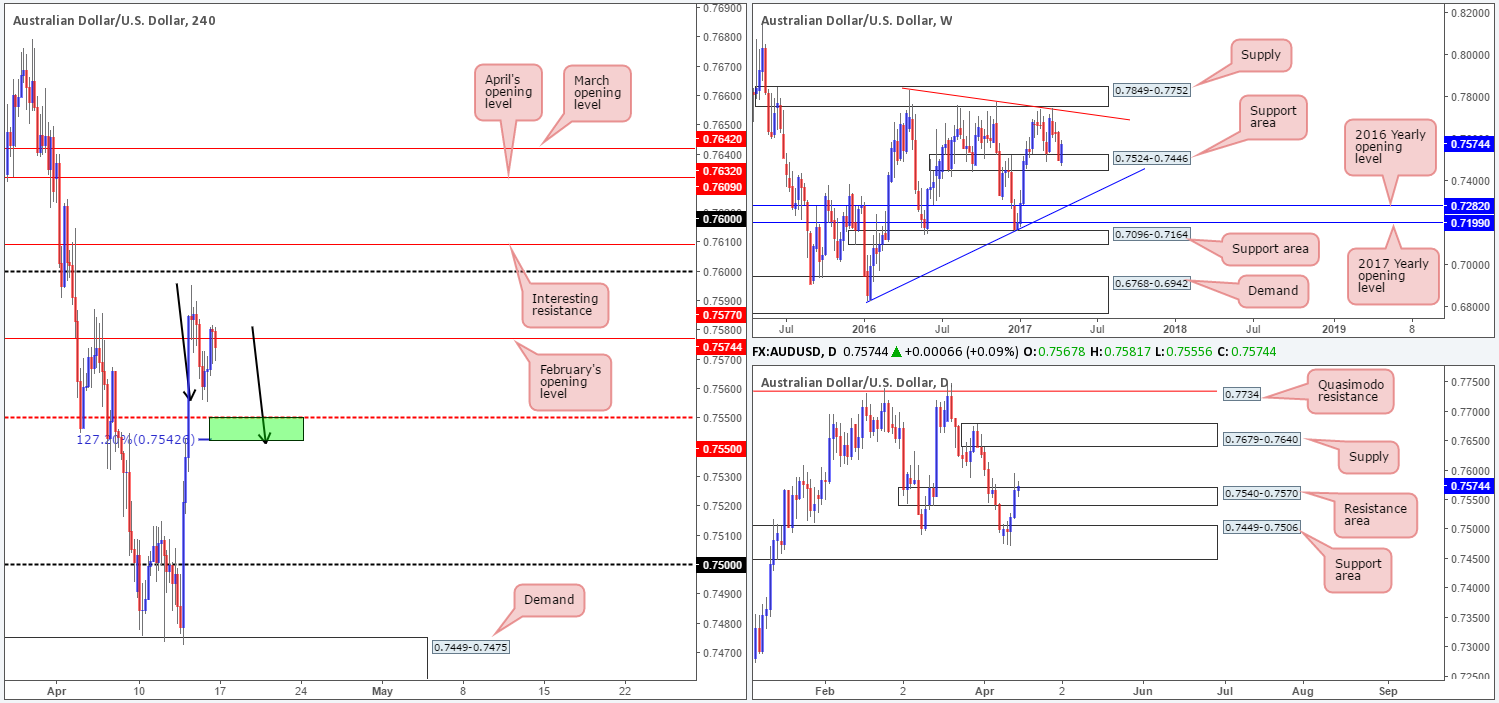
During the course of last week’s segment, weekly bulls staged a modest rebound from the support area at 0.7524-0.7446. This zone can be seen offering support and resistance as far back as mid-2016. Should the commodity currency extend last week’s bullish rotation, the next upside hurdle can be seen at a trendline resistance taken from the high 0.7835, followed closely by supply at 0.7849-0.7752.
Zooming in and looking at the daily picture reveals that last week ended with price marginally closing above a resistance area penciled in at 0.7540-0.7570. Although the close is minor, it does somewhat help confirm the bullish tone on the weekly chart, and could also have opened up the path north for the candles to challenge supply at 0.7679-0.7640.
Good Friday, as expected, saw little movement in the markets. H4 price ended the day slipping back below February’s opening line at 0.7577. Should the bears remain in the driving seat, the unit may attempt to test Friday’s low at 0.7555, shadowed closely by the mid-level support barrier at 0.7550.
Our suggestions: The H4 mid-level support at 0.7550 is a particularly interesting level for potential longs. Not only does the line fuse closely with a possible H4 AB=CD (see black arrows) 127.2% Fibonacci extension at 0.7542 (green zone), let’s not forget that we also have higher-timeframe structure suggesting further buying could be on the cards (see above).
We would consider a long from 0.7542/0.7550, but only on the condition that a bounce from this region is bolstered by a lower-timeframe confirming signal (see the top of this report).
Data points to consider: Chinese GDP figures along with Industrial production data scheduled for release at 3am GMT+1.
Levels to watch/live orders:
- Buys: 0.7542/0.7550 ([waiting for additional lower-timeframe confirming price action is advised] stop loss: dependent on where one confirms this area).
- Sells: Flat (stop loss: N/A).
USD/JPY:
Weekly gain/loss: – 250 pips
Weekly closing price: 108.56
Following two weeks of struggle within the weekly support area seen at 111.44-110.10, the bears recently took control and forced price below this zone. The move could, in our humble opinion, force the piece to cross swords with the weekly support area coming in at 105.19-107.54.
Turning our attention to the daily chart, demand at 108.55-109.17 appears to be under pressure at the moment. In the event of this area giving way, the next downside target is seen at 107.15-107.90: a support area that’s glued to the top edge of the noted weekly support zone.
Despite the majority of the market enjoying some vacation time on Friday, both the 1.09 handle and Thursday’s low at 108.72 was taken out. This has, in our estimation, done two things. Firstly, the path south is relatively clear down to H4 demand at 107.77-108.21. Secondly, a potential H4 AB=CD pattern is forming, taken from the high 109.86. Also of interest here is the fact that the AB=CD (black arrows) 161.8% Fib ext. at 108.01, as well as the 108 handle, sits within the walls of the said H4 demand.
Our suggestions: The aforementioned H4 demand is certainly a place we’ll be considering longs from. Not only because of its H4 confluence, but also due to it being bolstered by the daily support area mentioned above at 107.15-107.90.
Of course, be prepared for the possibility that price may not strike this area today given that the majority of banks remain closed in observance of Easter Monday.
Data points to consider: BoJ Gov. Kuroda speaks at 7.15am GMT+1.
Levels to watch/live orders:
- Buys: H4 demand 107.77-108.21 ([dependent on the time of day, a long from here at market is an option] stop loss: beyond the zone at 107.75).
- Sells: Flat (stop loss: N/A).
USD/CAD:
Weekly gain/loss: – 82 pips
Weekly closing price: 1.3324
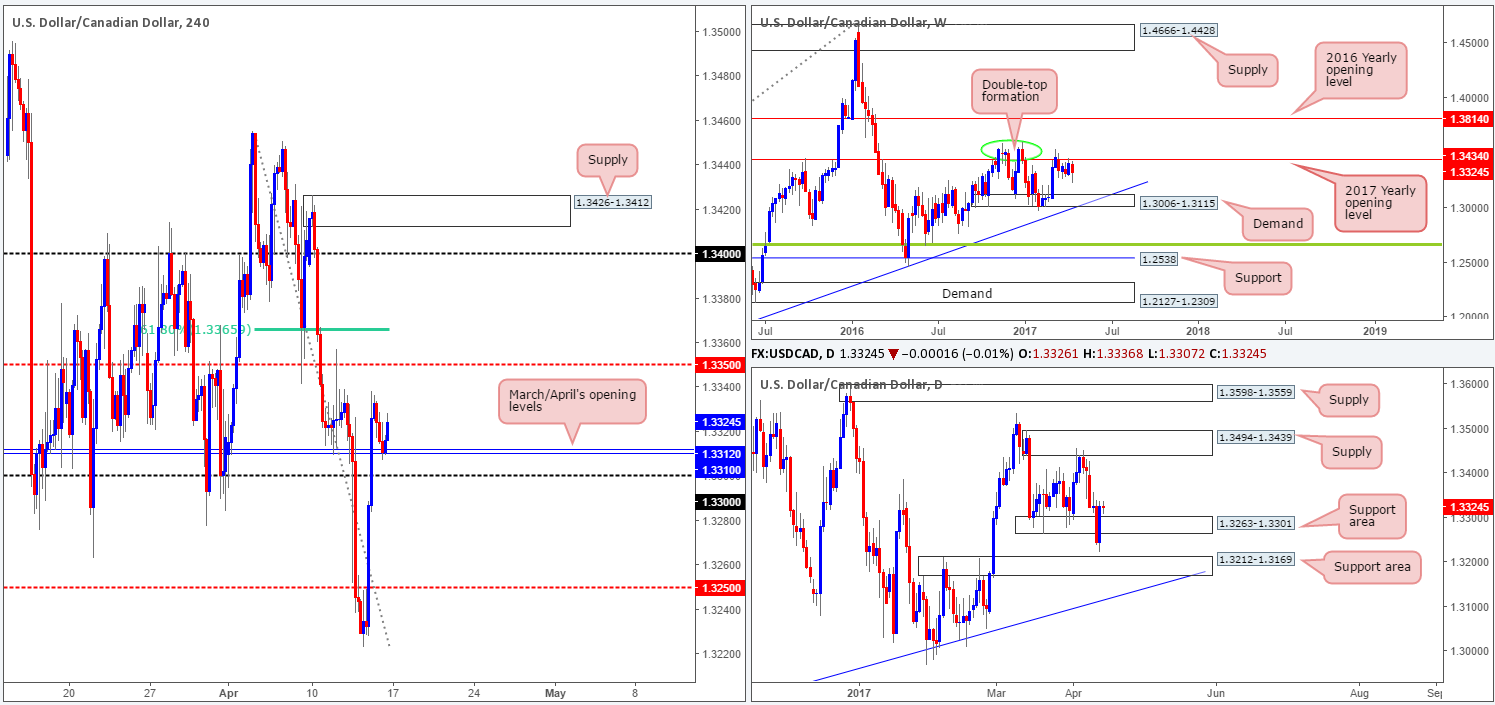
Weekly price has spent the best part of a month and a half teasing the underside of the 2017 yearly opening level at 1.3434. Reinforcing this line is a well-defined double-top formation seen around the 1.3588 neighborhood (green circle). To the downside the next area of interest is a demand coming in at 1.3006-1.3115. A decisive push above the yearly level, however, could spark a round of buying up to the 2016 yearly opening level at 1.3814.
Turning over a page to the daily chart, the candles recently printed a strong-looking two-day whipsaw through a support area fixed at 1.3263-1.3301. Assuming that the bulls continue to bolster this market, the next upside hurdle in view is supply printed at 1.3494-1.3439.
Although H4 price managed to remain firm above March/April’s opening levels at 1.3310/1.3312 on Friday, there’s still a possibility that the market may want to test the 1.33 handle given it represents the top edge of a daily support area at 1.3263-1.3301.
Our suggestions: While a long from 1.33 is something we would consider, it’d only be possible if H4 price formed a reasonably sized H4 bullish candle off this number and closed back above the said monthly levels. Not that this would guarantee a winning trade, what it would do though is help in showing buyer interest off a psychological handle that’s reinforced by a daily support area!
Data points to consider: No high-impacting news events scheduled on the docket today.
Levels to watch/live orders:
- Buys: 1.33 region ([waiting for a reasonably sized H4 bull candle to form before pulling the trigger is advised] stop loss: ideally beyond the candle’s tail).
- Sells: Flat (stop loss: N/A).
USD/CHF:
Weekly gain/loss: – 44 pips
Weekly closing price: 1.0046
Weekly supply at 1.0170-1.0095, as you can see, managed to hold firm last week consequently forcing price to retest the 2016 yearly opening level at 1.0029 as support. A weekly close below this level could see the unit attempt to approach the 27th March low at 0.9813.
On the daily chart, we can see that price is also seen capped between a supply base drawn from 1.0107-1.0072 and a support area logged at 1.0001-0.9957. Before any shorts are considered, we’d ideally want to see this support area consumed.
Swinging ourselves over to the H4 chart, the Swissy remained beneath March’s opening level at 1.0066 on Good Friday. Of interest on this chart this morning is the 1.01/1.0081 area for possible shorting opportunities. Formed by the 161.8/127.2% AB=CD (black arrows) Fib extensions taken from the low 1.0007, and bolstered by both the said daily supply zone and weekly supply, this green sell zone has a good chance of bouncing price.
Our suggestions: Seeing as today is also a vacation for most of the market, the H4 candles may not reach 1.01/1.0081 today. However, it is certainly an area we would advise placing on your watchlists for use this week.
Data points to consider: No high-impacting news events scheduled on the docket today.
Levels to watch/live orders:
- Buys: Flat (stop loss: N/A).
- Sells: 1.01/1.0081 (stop loss: 1.0011).
DOW 30:
Weekly gain/loss: – 187 points
Weekly closing price: 20470
US equities sank last week, consequently bringing the weekly candles closer to testing the demand base at 19675-19964, which happens to hold the 2017 yearly opening level within at 19769.
Since the 22nd March, the daily candles have experienced a significant amount of choppy action between demand plugged at 20527-20626 and the resistance area at 20714-20821. On Thursday, however, the bears decided enough was enough and forced price out of this tight range. According to the daily structure, Thursday’s action could set the stage for a continuation move south down to demand pegged at 20003-20091 (located just above the aforementioned weekly demand and daily support at 19964).
However, before we begin looking to sell this index, H4 price has to contend with a nearby demand area logged at 20381-20425. A H4 close below here would, in our opinion, ‘seal the deal’ for lower prices, and this is exactly when our desk plans to jump aboard!
Our suggestions: We do not anticipate much movement being seen today given Easter Monday, so it’s doubtful we’ll get our break below the said H4 demand. Unless this happens, we see very little to hang our hat on at the moment.
Data points to consider: No high-impacting news events scheduled on the docket today.
Levels to watch/live orders:
- Buys: Flat (stop loss: N/A).
- Sells: Flat (stop loss: N/A).
GOLD:
Weekly gain/loss: + $32.3
Weekly closing price: 1287.2
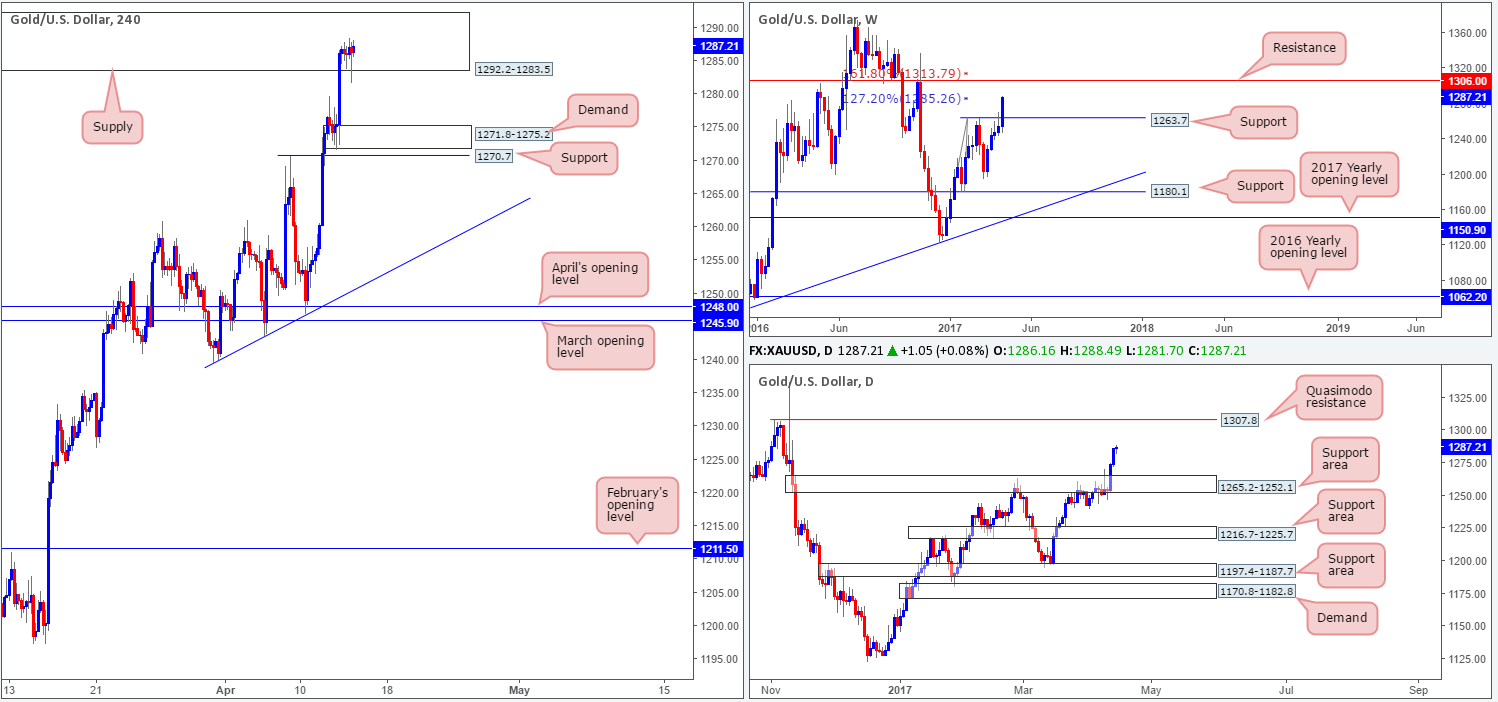
The yellow metal aggressively marched north last week, registering its fifth consecutive weekly gain. While weekly price shows room to rally this week up to resistance at 1306.0, it might be worth noting that surrounding this level are Fibonacci extensions 161.8/127.2% at 1313.7/1285.2 taken from the low 1188.1. Therefore, we may see the bears make an appearance before reaching 1306.0.
In conjunction with weekly flow, daily price looks poised to extend north up to the Quasimodo resistance level at 1307.8. This – coupled with weekly structure makes for an awesome sell zone!
Little movement was registered on Thursday last week. In fact, the H4 candles remained trading within a tight range inside supply drawn from 1292.2-1283.5. This supply, as far as we can see, is the only thing stopping bullion from reaching the noted weekly resistance level.
Our suggestions: Ideally, we’d like to see the bulls close above the aforementioned H4 supply, and attack the weekly resistance line. It would be here that our desk begins watching for a reasonably sized H4 bearish candle to form for entry.
Levels to watch/live orders:
- Buys: Flat (stop loss: N/A).
- Sells: 1306.0 region ([waiting for a reasonably sized H4 bear candle to form before pulling the trigger is advised] stop loss: ideally beyond the candle’s wick).


