A note on lower timeframe confirming price action…
Waiting for lower timeframe confirmation is our main tool to confirm strength within higher timeframe zones, and has really been the key to our trading success. It takes a little time to understand the subtle nuances, however, as each trade is never the same, but once you master the rhythm so to speak, you will be saved from countless unnecessary losing trades. The following is a list of what we look for:
- A break/retest of supply or demand dependent on which way you’re trading.
- A trendline break/retest.
- Buying/selling tails/wicks – essentially we look for a cluster of very obvious spikes off of lower timeframe support and resistance levels within the higher timeframe zone.
- Candlestick patterns. We tend to stick with pin bars and engulfing bars as these have proven to be the most effective.
We search for lower timeframe confirmation between the M15 and H1 timeframes, since most of our higher-timeframe areas begin with the H4. Stops are usually placed 5-10 pips beyond confirming structures.
EUR/USD:
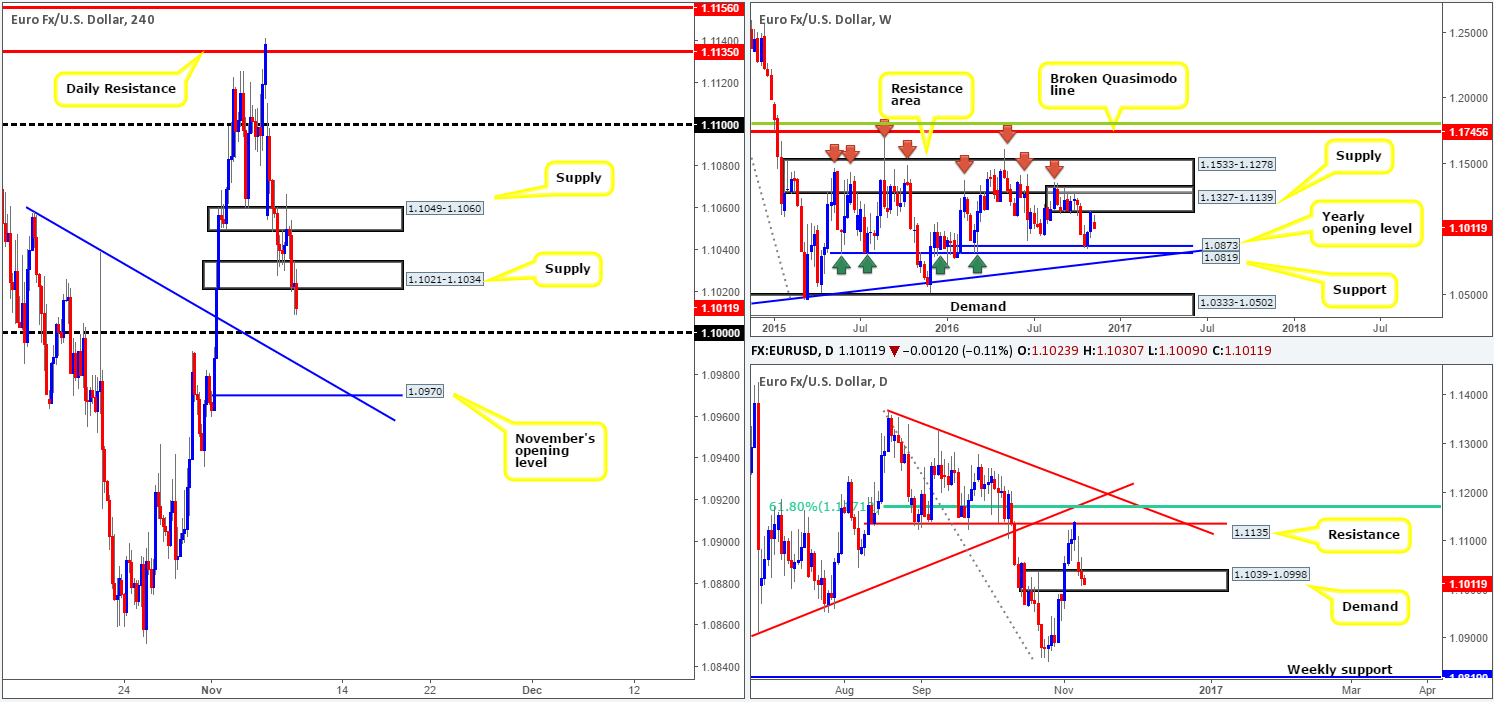
The EUR closed marginally lower on Tuesday, resulting in the unit piercing through the lower edge of a nearby H4 demand zone coming in at 1.1021-1.1034 (now acting supply). As of this point, it appears the market is pricing in a Clinton win, which by many, is seen as the status quo candidate.
The first polls close at 11am GMT in Indiana and Kentucky. The first state projections, however, will not be made until midnight GMT. Things will likely get more interesting at 1am GMT, as key polling stations like Pennsylvania close, which is a significant state for Clinton’s campaign. By around 4am GMT, it’ll likely be relatively clear who prevailed. Nevertheless, the result could come sooner than this.
Ok, back to the charts. With the aforementioned H4 demand now likely out of the picture, the key figure 1.10 will probably be the next barrier in line for some action, followed by a H4 trendline support extended from the high 1.1058 and November’s opening line at 1.0970. Looking over to the daily chart, we can see that the candles continue to occupy the demand base seen at 1.1039-1.0998. Should a rotation to the upside be seen from here, this would likely place the resistance line at 1.1135 in the spotlight. A close below the current daily demand, nonetheless, could set the stage for further downside toward the yearly opening level at 1.0873 (see the weekly chart), which, as you can see, held price beautifully in late Oct.
Our suggestions: With the first state projections now literally just around the corner, we are not looking to jump in the markets yet. We do, however, like the look of November’s opening line at 1.0970, due to its connection with the above said H4 trendline support and strong bullish momentum in the form of a H4 demand. Nevertheless, unfortunately it’s positioned just below the current daily demand, so this would have likely been a pass for our desk anyway.
Trade safe today.
Levels to watch/live orders:
- Buys: Flat (stop loss: N/A).
- Sells: Flat (stop loss: N/A).
GBP/USD:
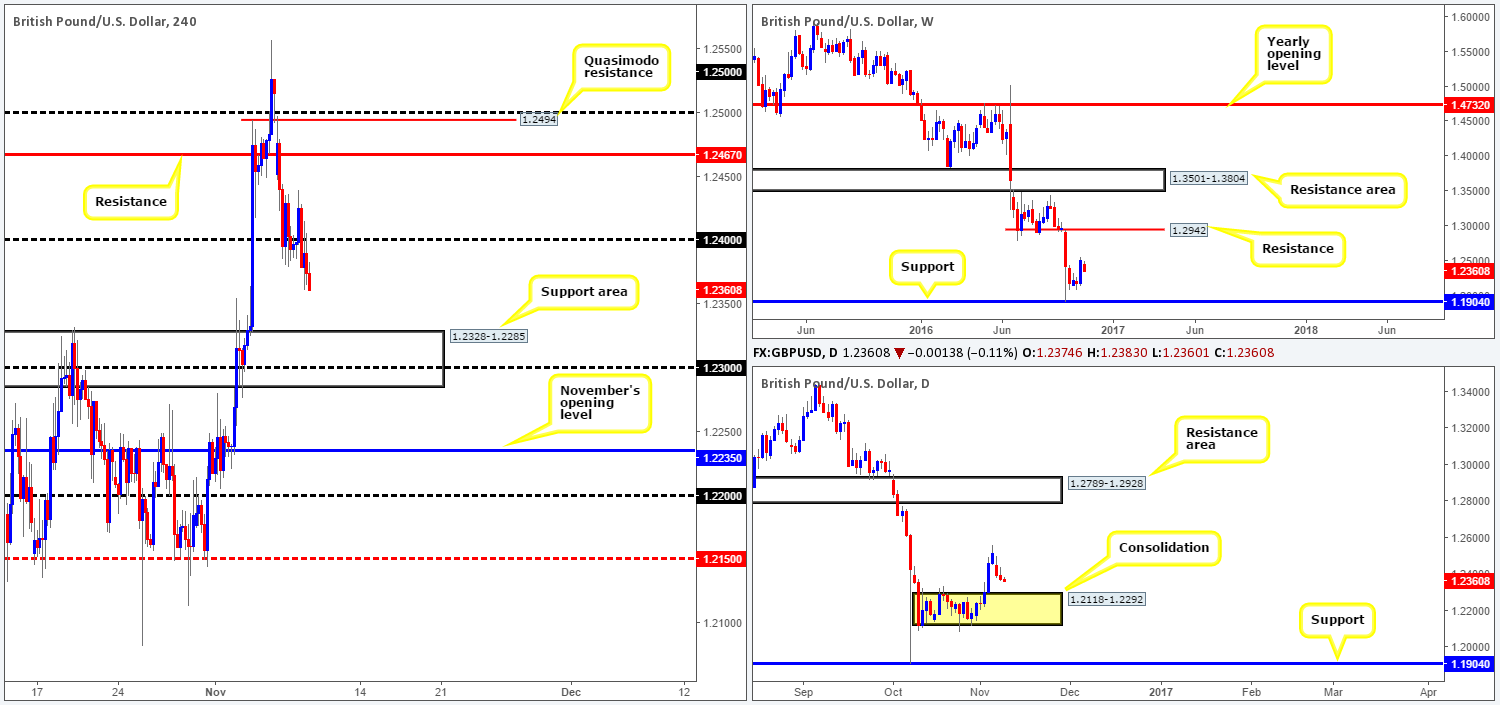
In a similar fashion to the EUR/USD, the GBP also marginally weakened during the course of yesterday’s sessions. The 1.24 handle was consumed going into the London lunch hour and later retested as resistance early on in the US segment. Well done to any of our readers who managed to short the retest here, as this was a noted move to keep an eye on in our previous report. With the market clearly favoring the dollar at the moment, the H4 candles look poised to extend down to the H4 support area penciled in at 1.2328-1.2285. This zone is interesting since it houses both the psychological handle 1.23 along with the top edge of the daily range drawn from 1.2292.
With the US Elections firmly underway and the first state projections now only a few minutes away, our desk is taking on a more cautious stance. Technically, nevertheless, the 1.23 handle, given its location (see above), is an attractive number for longs since let’s not forget that over on the monthly chart there’s a huge demand now in play between 1.0438-1.3000. This area can only be seen here due to lack of historical data:
Levels to watch/live orders:
- Buys: Flat (stop loss: N/A).
- Sells: Flat (stop loss: N/A).
AUD/USD:
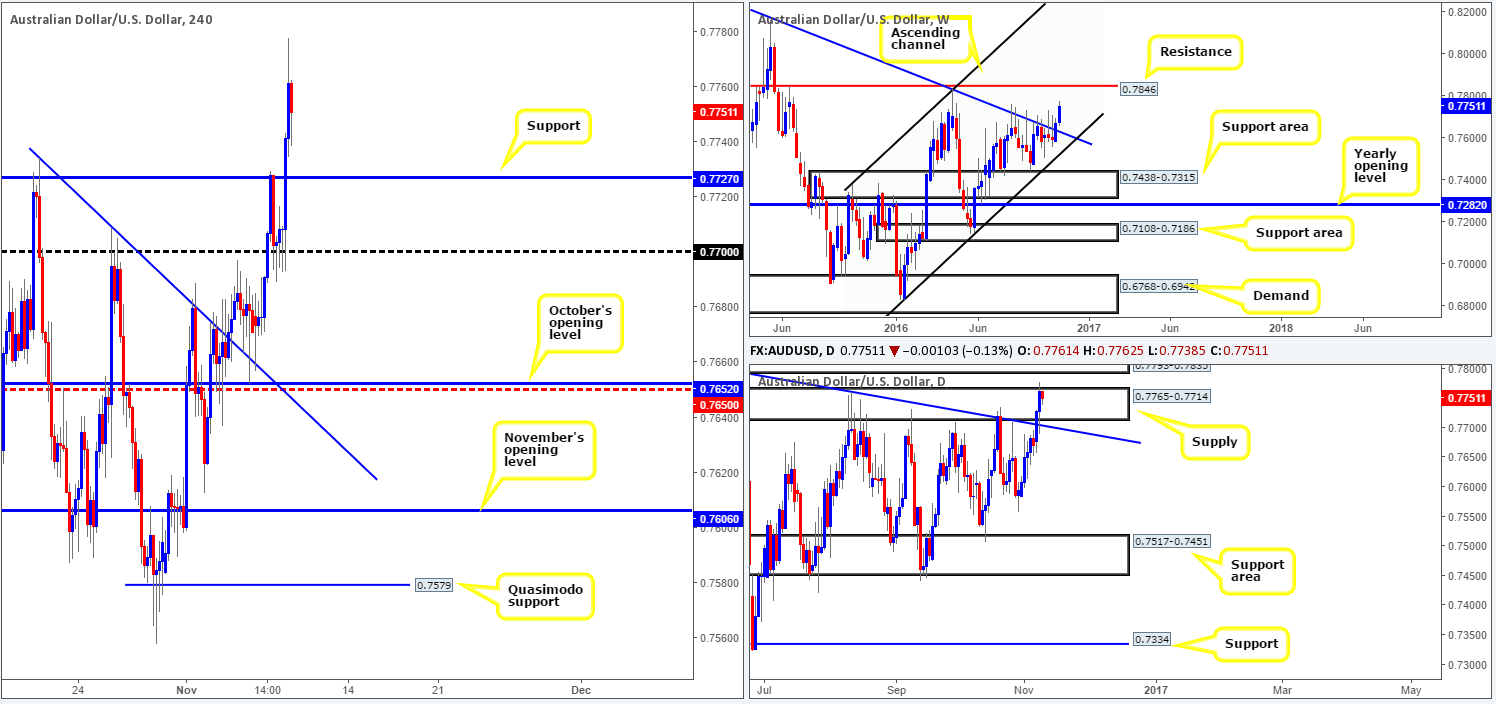
During the course of yesterday’s sessions, the commodity currency firmly established itself around the 0.77 figure and subsequently rose to a high of 0.7778 by the day’s close. Riskier assets are clearly the favored approach among investors for the time being, supporting a Clinton win who, at the time of writing, currently leads by 7 points in the polls.
From a technical standpoint, the weekly chart shows that the runway is clear for price to challenge resistance given at 0.7846. Meanwhile, on the daily chart, supply at 0.7765-0.7714 was slightly breached amid yesterday’s session, which could have opened the hatch for a move up to a nearby supply coming in at 0.7835-0.7793. Stepping across to the H4 chart, as we already mentioned above, price topped at 0.7778 yesterday and has remained bearish since. The next support level to have an eyeball on falls in at 0.7727, followed closely by the 0.77 handle. To the upside, we’ve noted the 0.78 handle as the next objective to reach should a continuation move be seen today.
The 0.78 mark sits within the lower edge of the daily supply mentioned above at 0.7835-0.7793, which is bolstered by the weekly resistance also mentioned above at 0.7846. Therefore, from a higher-timeframe perspective, a minor fakeout beyond the above said daily supply may be on the cards should the unit reach this high.
Our suggestions: Looking at this market purely from a technical angle, the H4 support 0.7727 has a fairly good chance of holding the market higher today, as does the 0.77 mark, due to the higher-timeframe picture (see above). However, considering that the US elections are currently in motion, literally anything could spark a brutal move in either direction. With that being said, our team has concluded that opting for the sidelines is the more conservative approach. Should you still wish to trade the above said levels, we would strongly suggest only doing so if one is able to spot a reasonably sized H4 bullish close following a test of the level.
Levels to watch/live orders:
- Buys: 0.7727 mark ([reasonably sized H4 bullish close required prior to entry] stop loss: dependent on where one confirms this area). 0.77 region ([reasonably sized H4 bullish close required prior to entry] stop loss: dependent on where one confirms this area).
- Sells: Flat (stop loss: N/A).
USD/JPY:
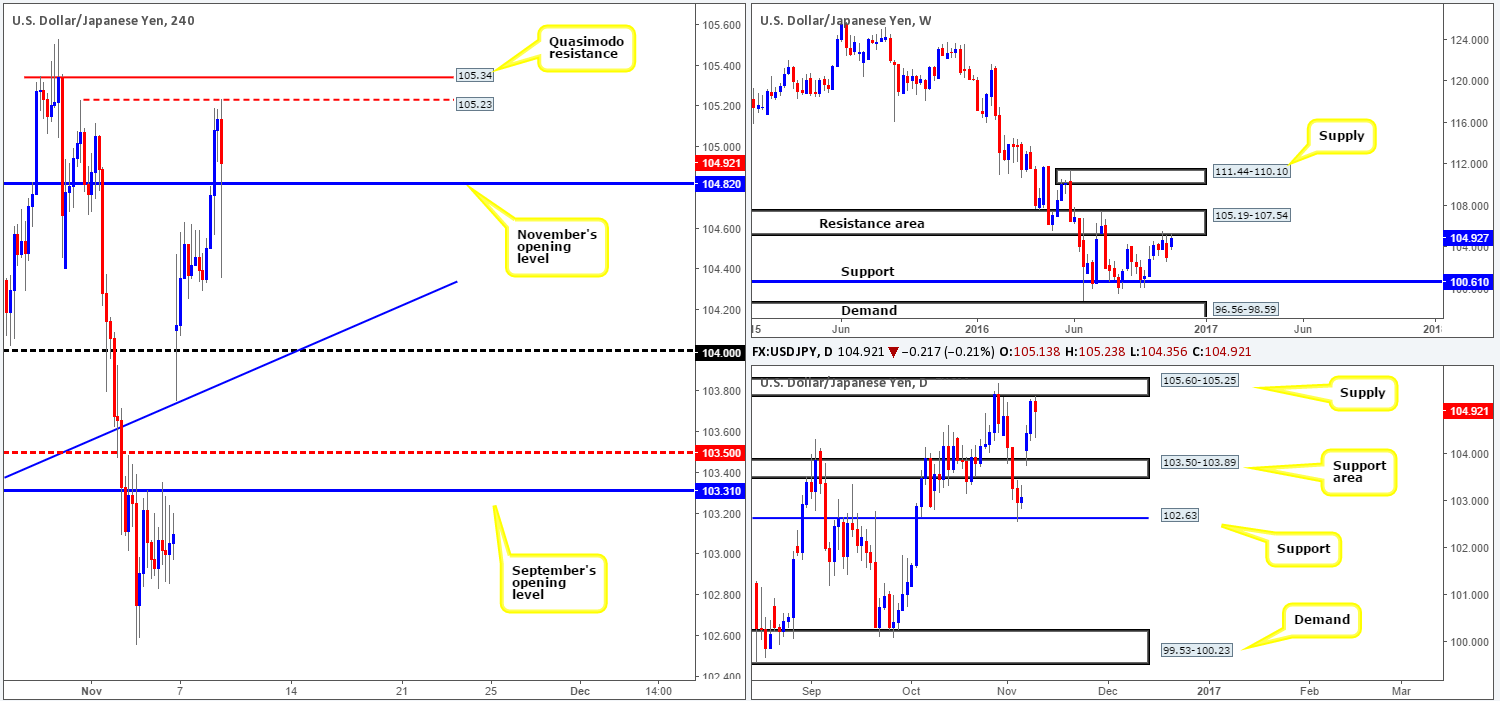
With the US elections now firmly underway, the USD/JPY recently gathered momentum, taking out November’s opening level at 104.82 and reaching highs of 105.19 by the close. At the time of writing, price appears to be in the process of forming a H4 double top formation around the 105.23, and in normal trading conditions, a fake above this level to the nearby H4 Quasimodo resistance at 105.34 is what we’d expect from price.
Over in the bigger picture, we have daily action touching gloves with the underside of a supply zone coming in at 105.25, as well as weekly price shaking hands with the underside of a resistance area drawn in at 105.19. The H4 Quasimodo resistance – coupled with the above said higher-timeframe structures would, at least in our book, be sufficient enough to condone a short from 105.34 today.
Our suggestions: While the above technical setup has a high probability of working out, we are not willing to risk capital in current trading conditions. For those who still favor this setup, we would strongly advise waiting for at least a reasonably sized H4 bearish close to form prior to pulling the trigger to avoid being stopped out on a fake north.
Levels to watch/live orders:
- Buys: Flat (stop loss: N/A).
- Sells: 105.34 ([reasonably sized H4 bearish close required prior to entry] stop loss: ideally beyond the trigger candle).
USD/CAD:
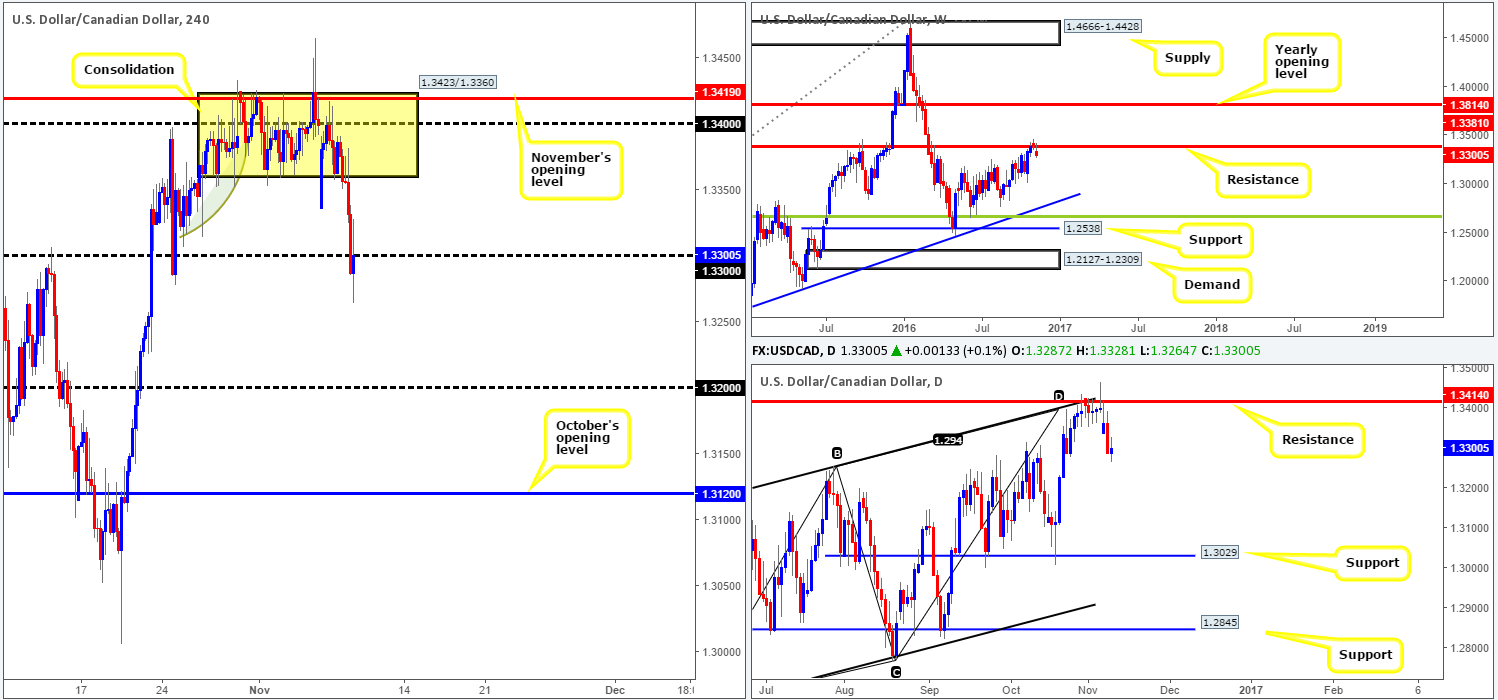
With the oil market recently bottoming at 43.55 and grinding higher, the USD/CAD pair aggressively sold off following a close below and subsequent of the current H4 consolidation (1.3423/1.3360) going into London hours. As expected, price touched base with the 1.33 handle in its recent slide lower, and ended the day closing below the level, suggesting further selling may be seen.
A strong retest to the underside of 1.33 could be treated as a signal to short, due to what we’re seeing on the higher-timeframe picture. Weekly action is now trading below resistance at 1.3381, along with daily price recently selling off from the underside of resistance at 1.3414 (along with its converging AB=CD completion point around the 1.3384ish range and a channel resistance taken from the high 1.3241).
Our suggestions: While a short from 1.33 is certainly appealing, we will not be taking any live positions today judging how tight the US election polls are at the moment. For those who remain confident that further downside from here is on the cards, we would advise waiting for the bears to print a H4 bearish close beforehand. Granted, this may get one in at a worse price, but what it will do is likely save you from an unnecessary loss.
Levels to watch/live orders:
- Buys: Flat (stop loss: N/A).
- Sells: 1.33 region (H4 bearish close required prior to entry – stop loss: ideally beyond the trigger candle).
USD/CHF:
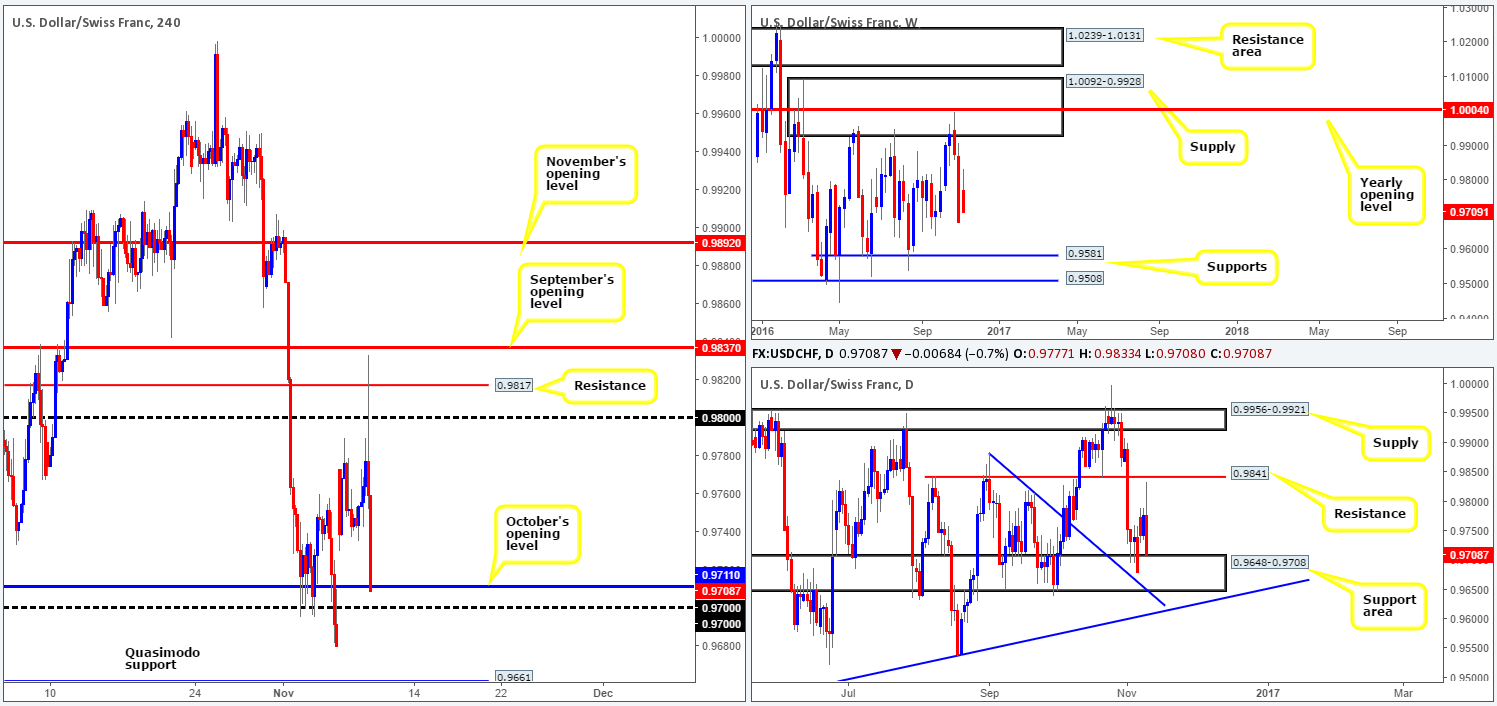
In recent hours, the USD/CHF market spiked to a high of 0.9833, whipsawing through both the 0.98 handle and H4 resistance at 0.9817 and just missing September’s opening level at 0.9837 by a cat’s whisker. The selloff generated from this move has been quite drastic, and has consequently placed the H4 candles at the base of October’s opening level at 0.9710, closely bolstered by the 0.97 handle. Technically speaking, 0.97/0.9711 is also strengthened by the top edge of a daily support area at 0.9648-0.9708. Despite this, however, the weekly candles show room to extend lower towards support at 0.9581.
According to the polls, Trump is catching up, recently taking Texas, Wyoming, Kansas, North Dakota and South Dakota, hence the dollar weakness. It really is neck and neck at the moment!
Our suggestions: Our team has noted that October’s opening level at 0.9711 is a favorable reversal point, given how closely connected it is to 0.97 and the top edge of the aforementioned daily support area. While this may be the case, a long from here is a risky play with polls too close to call. Assuming that you still believe a trade is worth a shot in the current conditions, at least consider waiting for a reasonably sized H4 bull close to form from the area, prior to pulling the trigger.
Levels to watch/live orders:
- Buys: 0.97/0.9711 region ([reasonably sized H4 bullish close required prior to entry] stop loss: ideally beyond the trigger candle).
- Sells: Flat (stop loss: N/A).
DOW 30:
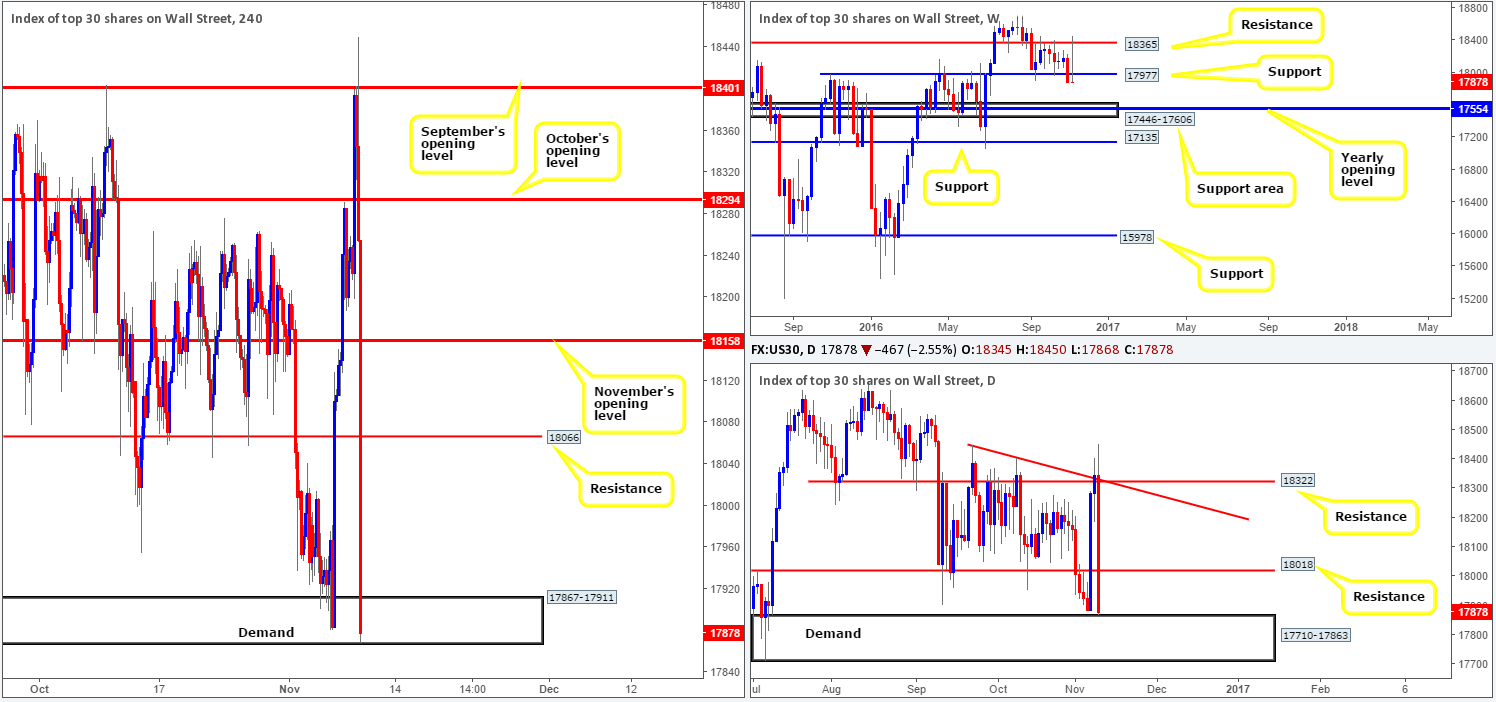
At this point in time, the markets are really beginning to fear a Trump presidency. Equities have entered into a selling frenzy, following a beautiful whipsaw through September’s opening level at 18401. H4 demand at 17867-17911 is currently under pressure, but could remain afloat due to its backing seen from a daily demand area coming in at 17710-17863.
Our suggestions: With polls razor close now, one can almost feel the tension building through the screens! Even the thought of attempting to trade this market from a technical angle is, at least in our opinion, not really a good idea. For now, we would advise all technical traders to take a back seat, as should Trump take the win, a lot more volatility is expected to be seen!
Levels to watch/live orders:
- Buys: Flat (stop loss: N/A).
- Sells: Flat (stop loss: N/A).
GOLD:
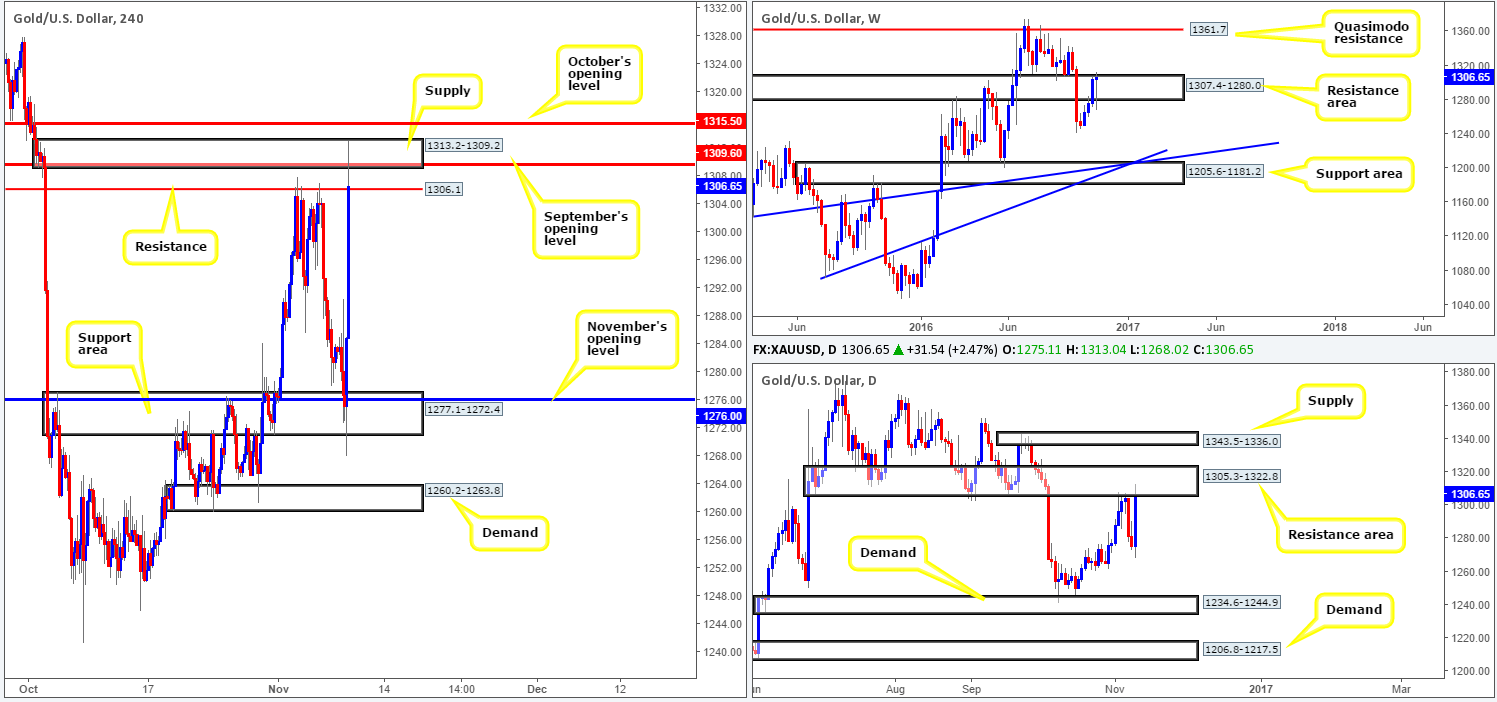
Market fears of a Trump presidency revived demand for the safe-haven metal in recent hours. After whipsawing through both a H4 demand base at 1277.1-1272.4 and November’s opening level at 1276.0, the yellow metal clocked a high of 1313.0.
As of now, the bulls look to be slightly on the back foot following a rejection from the H4 supply at 1313.2-1309.2. However, with Donald Trump becoming the most likely candidate to win the US elections, we could be in for much, much more safe-haven buying today!
Our suggestions: With the precious metal seen not only testing a H4 supply base, but also a H4 resistance at 1306.1, September’s opening level at 1309.6 and, of course, the underside of a daily resistance area at 1305.3-1322.8, we would usually begin looking for short opportunities. However, in light of the recent events surround the US elections, we have decided to remain flat for the time being.
Levels to watch/live orders:
- Buys: Flat (stop loss: N/A).
- Sells: Flat (stop loss: N/A).


