A note on lower timeframe confirming price action…
Waiting for lower timeframe confirmation is our main tool to confirm strength within higher timeframe zones, and has really been the key to our trading success. It takes a little time to understand the subtle nuances, however, as each trade is never the same, but once you master the rhythm so to speak, you will be saved from countless unnecessary losing trades. The following is a list of what we look for:
- A break/retest of supply or demand dependent on which way you’re trading.
- A trendline break/retest.
- Buying/selling tails – essentially we look for a cluster of very obvious spikes off of lower timeframe support and resistance levels within the higher timeframe zone.
- Candlestick patterns. We tend to only stick with pin bars and engulfing bars as these have proven to be the most effective.
For us, lower timeframe confirmation starts on the M15 and finishes up on the H1, since most of our higher timeframe areas begin with the H4. Stops usually placed 5-10 pips beyond your confirming structures.
EUR/USD:
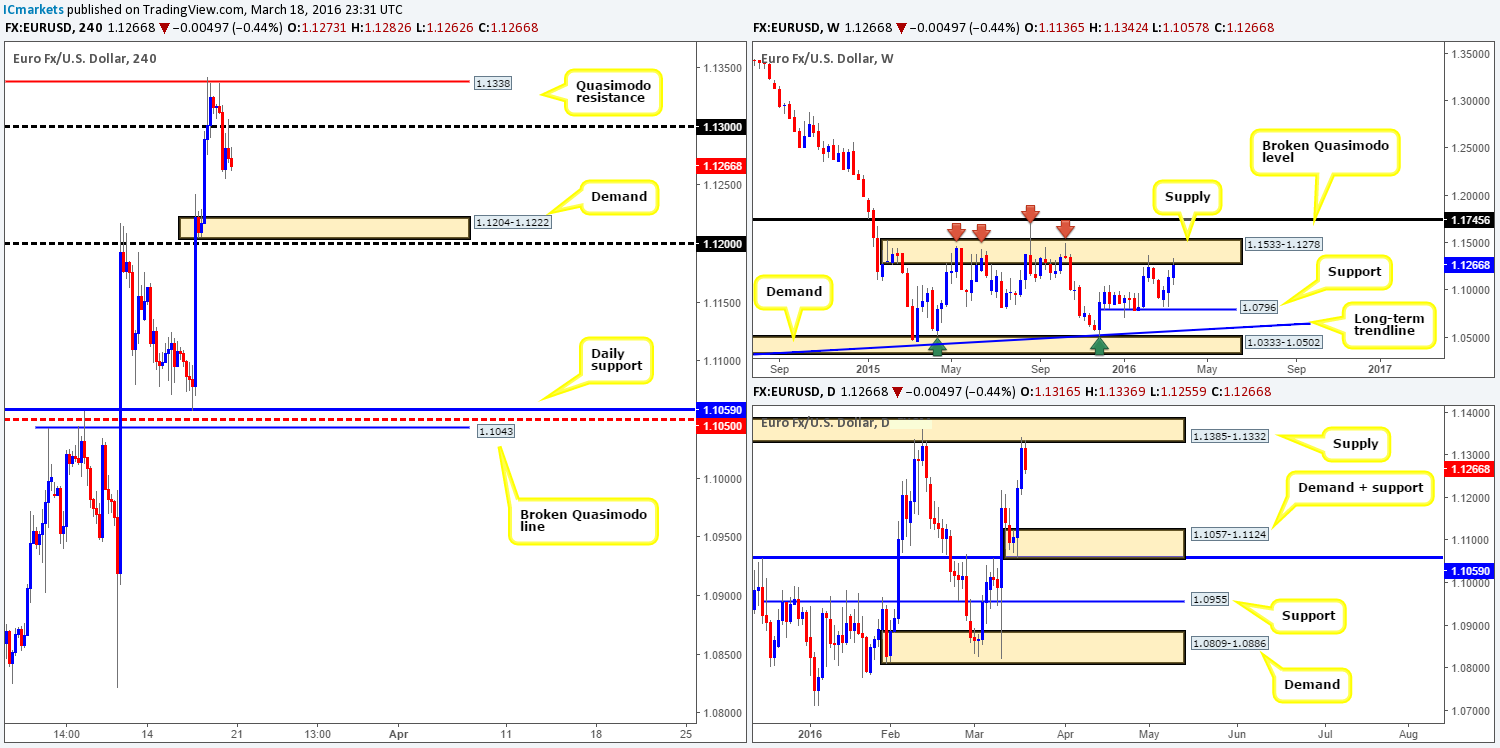
The EUR/USD market enjoyed another relatively successful week, increasing its value by a further 120 pips into the close 1.1266. Despite this, price ended the session colliding with an area of weekly supply coming in at 1.1533-1.1278, which has managed to hold this pair lower since May 2015, so it is certainly a zone we hold in respect. From this angle the next downside target comes in around weekly support at 1.0796, whilst a push above the current supply would land price within touching distance of a broken weekly Quasimodo resistance line at 1.1745.
Climbing down into the daily chart, we can see that the single currency responded well from supply on Friday at 1.1385-1.1332 (located just within the above said weekly supply area). Should the bears remain dominant, demand at 1.1057-1.1124 will likely be the next area in the firing range this week.
A quick recap of Friday’s activity on the H4 chart shows that the Quasimodo resistance line at 1.1338 did an awesome job of suppressing buying early on in the action. For those who read Friday’s report (see link below) you may recall that we mentioned for shorts to be considered, price would be required to close below and retest the 1.1300 handle as resistance. As is evident from the chart, price did exactly that and printed a clear-cut selling wick. Immediately after this candle closed we entered short at 1.1273 with the expectation of holding this position over the weekend. What this signal has likely done is opened the doors to the first take-profit target at 1.1204-1.1222 – a H4 demand zone, and at the same time confirm selling strength from the higher-timeframe supplies mentioned above. Ultimately, what we’re looking at from here is a break below the H4 target demand and a continuation move down to daily demand mentioned above at 1.1057-1.1124. http://www.icmarkets.com/blog/friday-18th-march-daily-technical-outlook-and-review/
Levels to watch/live orders:
- Buys: Flat (Stop loss: N/A).
- Sells: 1.1273 [LIVE] (Stop loss: 1.1310).
GBP/USD:
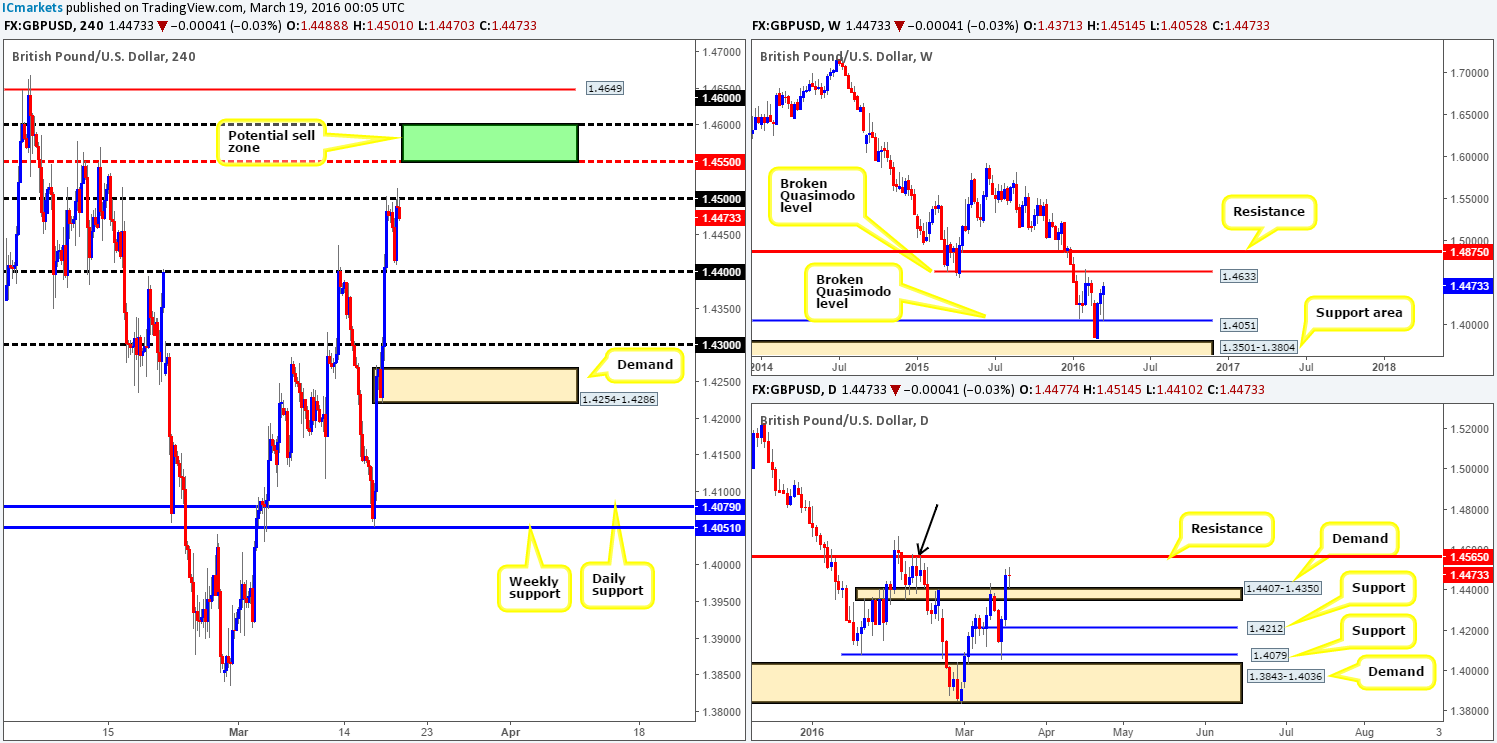
The past week saw Cable aggressively whipsaw to a low of 1.4052 (just missing a broken weekly Quasimodo support line (BQM) at 1.4051) up to a high of 1.4515, which saw the market close around 100 pips in the green at 1.4473. Consequent to this, a nice-looking weekly pin-bar formed which firmly places the BQM weekly resistance line at 1.4633 in the picture this week.
Down on the daily chart, we can see that price retested a recently broken supply-turned demand at 1.4407-1.4350 which took form in the shape of an indecision candle. The main takeaway from this timeframe, however, is the fact that selling pressure may come into this market earlier than the weekly BQM resistance line, as there’s a clear barrier of resistance lurking just above current prices at 1.4565. In addition to this, we also like the collection of selling wicks that formed around this region back in mid-Feb (marked by the black arrow), suggesting that this level was clearly a sought-after barrier at one point.
Friday’s movement on the H4 chart rebounded from the 1.4500 handle early on in the session, reaching lows of 1.4410 going into the London open where aggressive bids forced this market back up to 1.4500 into the close.
Given the above information, our battle lines remain unchanged from Friday’s report:
- Buying on the break/retest of 1.4500 is certainly a possibility for an intraday trade today. However, we would not be expecting much more than the 1.4550/1.4600 region on this one. Reason being is by that point you’d be entering into higher-timeframe resistance territory (see above).
- In regard to sells, the 1.4550/1.4600 (green rectangle) area is a reasonable zone to look to short since in between here sits daily resistance at 1.4565. We would, however, advise waiting for the lower timeframes to confirm selling strength due to a H4 Quasimodo resistance level lurking above at 1.4649, which fuses nicely with the weekly BQM resistance line at 1.4633 (a potential level to short at market).
Levels to watch/live orders:
- Buys: Watch for price to consume the 1.4500 level and look to trade any retest seen thereafter (Lower timeframe confirmation required).
- Sells: 1.4550/1.4600 [Tentative – confirmation required] (Stop loss: dependent on where one confirms this area). 1.4649 [Tentative – confirmation required] (Stop loss: dependent on where one confirms this level).
AUD/USD:
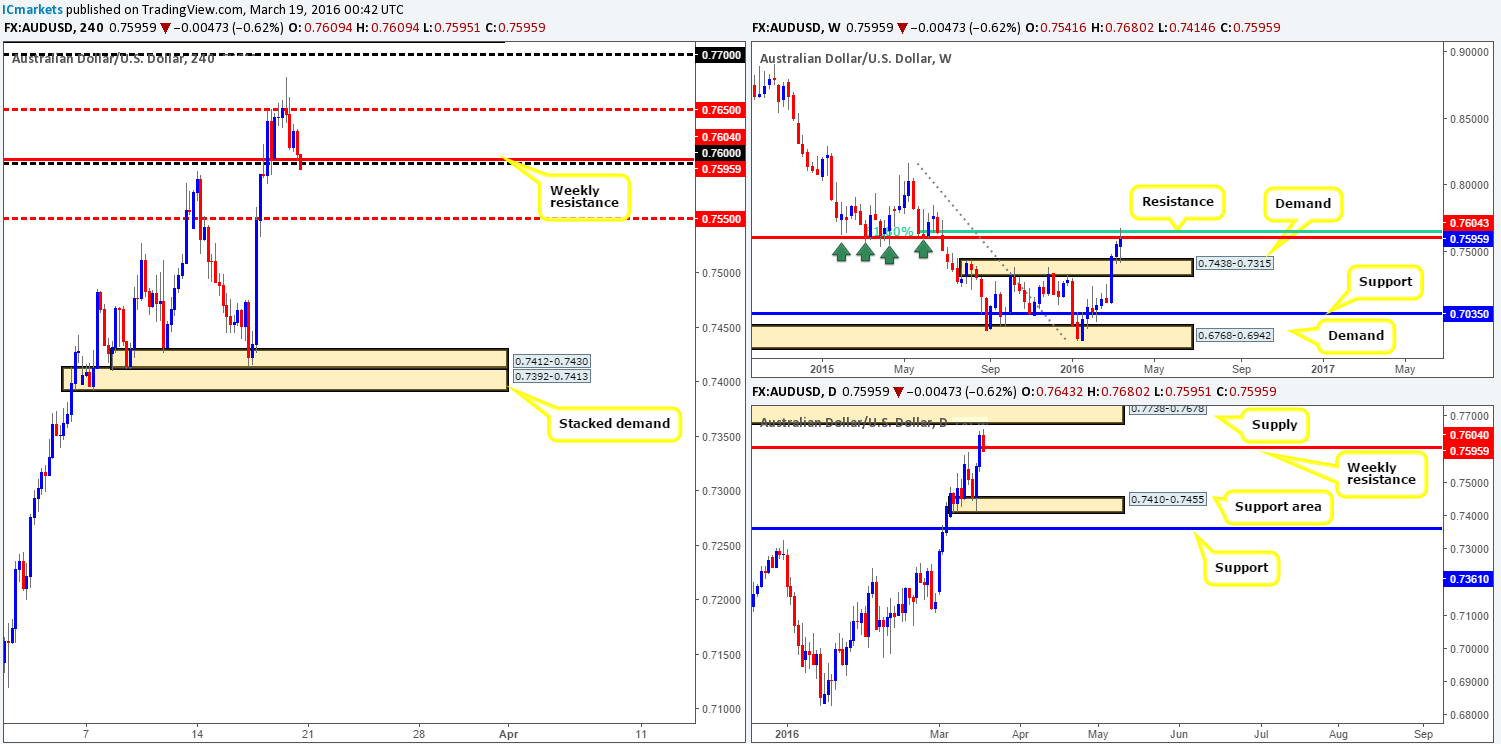
Last week’s close 0.7595 marks the third consecutive bullish week for this pair, posting gains of around 40 pips all in all. In spite of this, upside momentum appears to be diminishing as price recently came into contact with both weekly resistance at 0.7604 and its supporting 61.8% Fibonacci level just above at 0.7647. In addition to this weekly ceiling there’s also a nice-looking daily supply area hovering just above at 0.7738-0.7678 which, as you can see, managed to suppress buying on Friday and push prices back below the weekly resistance. Downside targets on the higher-timeframe picture come in at weekly demand drawn from 0.7438-0.7315 and a daily support area given at 0.7410-0.7455.
Looking across to the H4 chart, the mid-level barrier 0.7650 played a relatively big role on Friday, holding the bulls lower on several occasions! Technically, this should not really come as much of a surprise since this number lines up beautifully with the 61.8% weekly Fibonacci level.
With the above in mind, where do we see this market headed today and possibly into the week? Well, if the 0.7600 handle is able to hold the Aussie lower today, the mid-level support 0.7550 will likely be the next limit to reach, followed by H4 demand at 0.7412-0.7430 (stacked demand positioned around the aforementioned daily support area). That being the case, shorting opportunities may be a possibility from 0.7600 today as long as we see some sort of lower timeframe sell signal. Additionally, if one misses the sell here, a close below and confirmed retest of 0.7550 might be something to consider since our overall target for shorts is around the above said H4 demand at 0.7412-0.7430.
Levels to watch/live orders:
- Buys: Flat (Stop loss: N/A).
- Sells: 0.7600 [Tentative – confirmation required] (Stop loss: dependent on where one confirms this level). Watch for price to consume the 0.7550 level and look to trade any retest seen thereafter (Lower timeframe confirmation required).
USD/JPY:
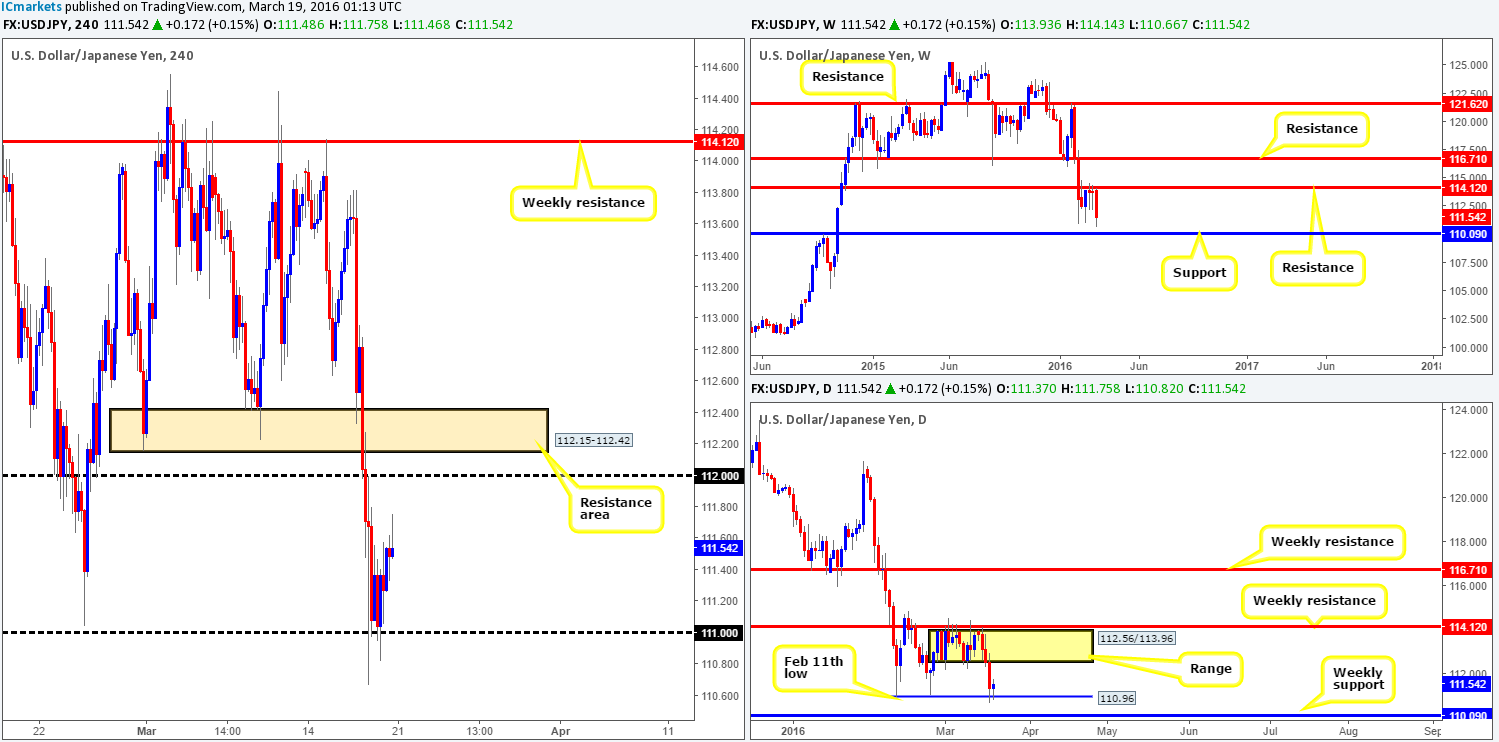
Following back-to-back buying tails around the underside of weekly resistance at 114.12, the USD/JPY plummeted over 200 pips lower during the course of last week’s session, reaching lows of 110.66. From the weekly scale, the weekly support level at 110.09 is likely going to be the next objective to reach, since this barrier has provided significant support and resistance to this market stretching all the way back to1997! On the other hand, daily support at 110.96 (the Feb 11th low) has, including Friday’s bounce, held this market higher on three occasions now so it is certainly not a number to ignore! In the event that the bulls decide to take on weekly sellers here, the next upside daily target can be seen at the underside of the recently broken range – 112.56.
Stepping across to the H4 chart, Friday’s bounce was clearly supported by the 111.00 handle as well as daily support at 110.96, managing to reach highs of 111.75 by the day’s end. Intraday resistance at 111.54 seems to have given this market some trouble following this bounce as price tried to close above this number but failed on each of its three attempts.
On account of the above, here is what we have logged for this week’s sessions:
For sells:
- The H4 resistance area coming in at 112.15-112.42 looks to be a nice zone to watch for possible shorts this week, due to it being positioned relatively close to the underside of the daily range lower edge at 112.56.
- Look for shorts on the break/retest of 111.00, targeting the weekly support mentioned above at 110.09.
For buys:
- At this point, even though daily support at 110.96 is in play, we favor the sell-side of this market for the time being owing to where price is positioned on the weekly timeframe (see above), so no buys are recommended.
Levels to watch/live orders:
- Buys: Flat (Stop loss: N/A).
- Sells: Watch for price to consume the 111.00 level and look to trade any retest seen thereafter (Lower timeframe confirmation required). 112.15-112.42 region [Tentative – confirmation required] (Stop loss: dependent on where one confirms this area).
USD/CAD:
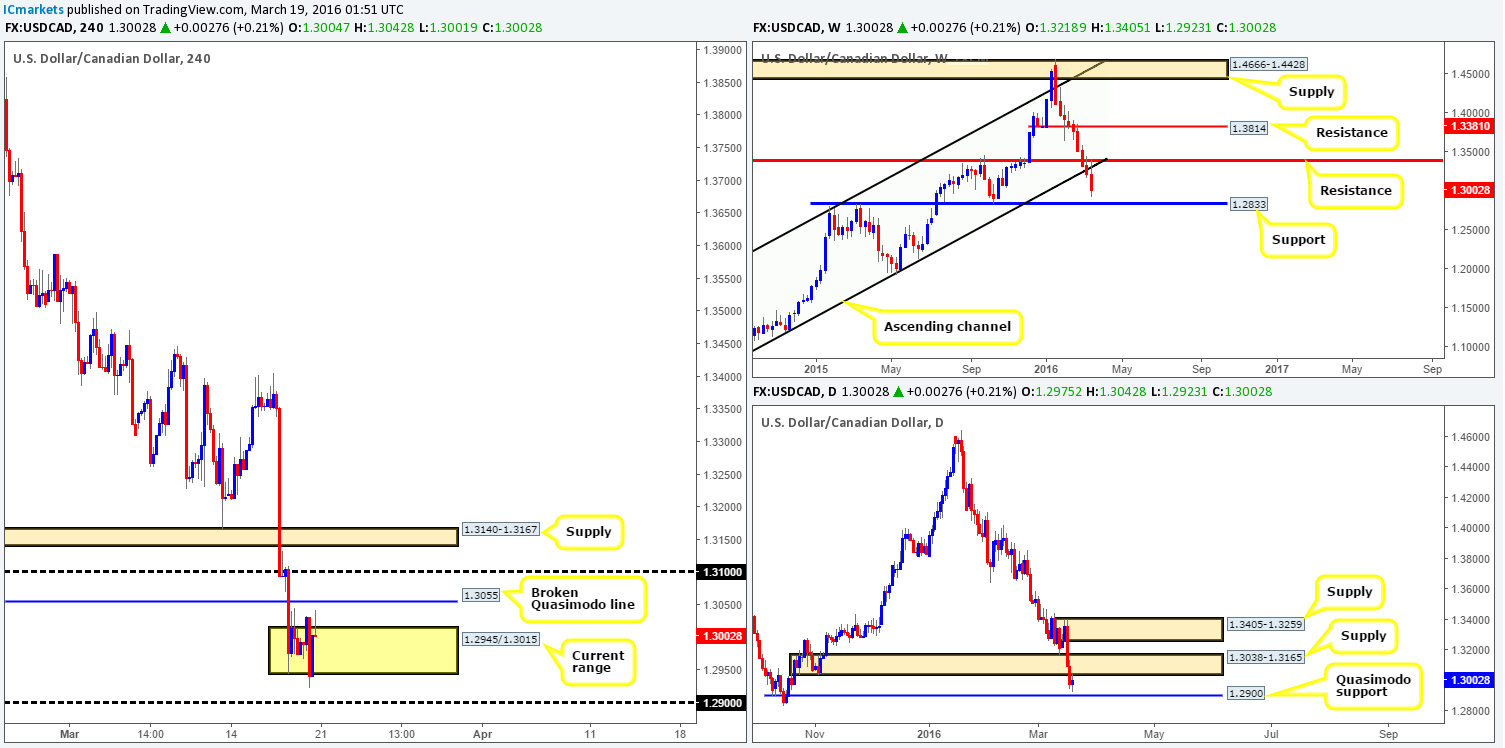
The USD/CAD has now been trading south for nine weeks down from its peak of 1.4689. The most recent move saw weekly price retest the underside of a broken support-turned resistance at 1.3381 and close over 200 pips lower, wrapping up the weekly session at 1.3002. With little else seen below, it’s very likely support at 1.2833 will be the next barrier on the hit list this week.
Scanning down to the daily chart, however, one can see that Friday’s session ended the day forming an indecision candle around the underside of a recently broken demand-turned supply at 1.3038-1.3165. This push lower, as far as we can see, has opened the trapdoor for prices to challenge 1.2900 this week – a strong-looking Quasimodo support level.
Despite the clear southerly direction forming on the higher-timeframe charts at the moment, the H4 shows price has begun forming a consolidation area fixed between 1.2945/1.3015. For now, our team has little interest in trading this range; it’s the areas beyond that we currently have our eye on! The broken Quasimodo resistance line at 1.3055 appears to be a lovely area for price to fakeout north to. Along the same vein, the 1.2900 handle which sits below (and is also the daily Quasimodo support barrier we discussed above) forms a nice barrier for price to fakeout south to. Both levels are tradable in our opinion, but only with supporting lower timeframe confirmation since fixed hurdles such as these are likely to be faked before well-funded traders step in. Furthermore, for traders attempting to go long from 1.2900, let’s not forget that price could very easily swipe through this level and head for the 1.2830 region – the weekly support level we talked about above.
Levels to watch/live orders:
- Buys: 1.2900 [Tentative – confirmation required] (Stop loss: dependent on where one confirms this level).
- Sells: 1.3055 [Tentative – confirmation required] (Stop loss: dependent on where one confirms this level).
USD/CHF:
As can be seen from the weekly chart it was another depressing week for the USD/CHF. Prices plunged around 130 pips into the close 0.9691, forcing this market beyond trendline support extended from the low 0.9071. This, as you can probably see, has likely opened the floodgates down towards a Quasimodo support level penciled in at 0.9526, which is certainly a roadblock we’ll be watching this week!
Turning our attention to the daily chart, we can see that following the break below the weekly trendline, price found support around the Feb 11th low 0.9660. Friday’s response from here, however, registered little meaning in our opinion, which likely has something to do with the H4 broken Quasimodo resistance line above at 0.9694, coupled with the 0.9700 handle. In addition to this weak bullish response here, daily action appears to be forming a D-leg of a nice-looking AB=CD bullish pattern completing just beneath the weekly Quasimodo support level we mentioned above at 0.9526.
Therefore, given the above information, our team is not placing much emphasis on the current daily support. In fact, we’re quite confident that the 0.9700 level seen on the H4 will likely hold prices lower and eventually push this market down to H4 demand at 0.9579-0.9611. However, for us to be permitted an entry short here, we would like to see price close below Thursday’s low 0.9651 and retrace back up to the 0.9700 region for an entry. This way, we’d be relatively confident that the majority of buyers are consumed for a clear move down to the aforementioned H4 demand, and quite possibly the aforementioned weekly Quasimodo support.
Levels to watch/live orders:
- Buys: Flat (Stop loss: N/A).
- Sells: 0.9694/0.9700 region [Watch for a close below the 0.9651 low and retrace to the 0.9700 area before looking to short] (Stop loss: 0.9720).
DOW 30:
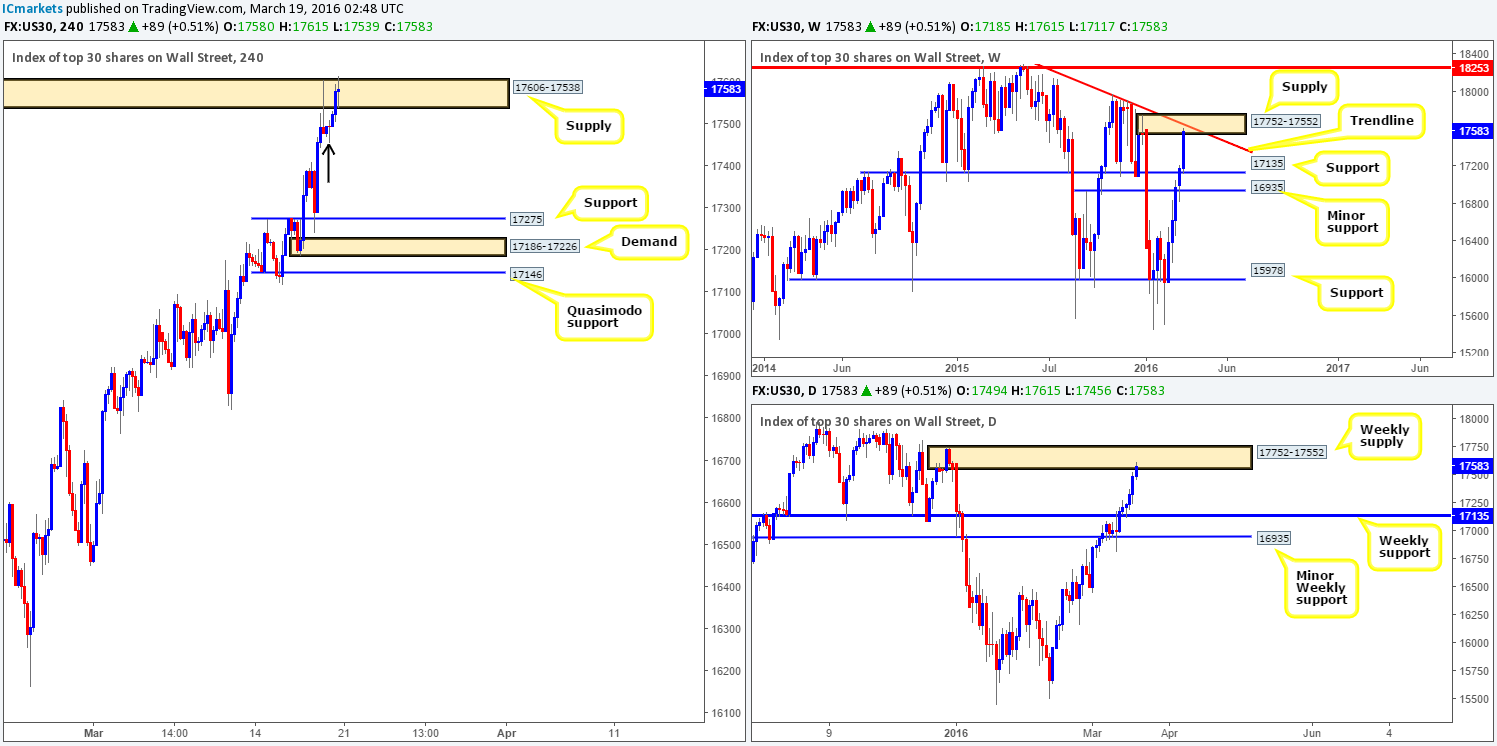
From a weekly viewpoint, one can see that Wall Street edged higher last week marking its fifth consecutive bullish week. The index gained 400 points, consequently closing out within supply (17752-17552) at 17583. Despite this recent upside we’re seeing in this market, buyers will likely have their work cut out for them this week in order to push above the current supply. Just look at the momentum south from this area and also take note of its convergence with the trendline resistance taken from the high 18365. Assuming that the bears do get their act together here, the first port of call will likely be the support line chalked up at 17135.
With the daily chart painting a similar picture to that of the weekly, let’s move directly to the H4 chart… What we’re seeing from here at the moment is the bears are struggling to gain a foothold around H4 supply fixed at 17606-17538. Notice the indecision candle that formed before the close, this, at least to us, indicates uncertainly from both sides of the market.
At this point, we are unsure as to whether the current H4 supply zone will hold. Therefore, before we’d consider selling from here, a close below the low 17456 (black arrow) and retrace back up to supply would need to be seen beforehand. This would tell us that some of the buyers have been taken out from the small H4 demand at 17456-17497 and the path is likely clear below towards H4 support at 17275. In the event that the bulls continue to push higher on the other hand, all eyes will be on the H4 resistance area at 17811-17736 positioned just above the aforementioned weekly supply.
Levels to watch/live orders:
- Buys: Flat (Stop loss: N/A).
- Sells: 17606-17538 [Watch for a close below the 17456 low and retrace to the 17606-17538 supply area before looking to short] (Stop loss: likely above the 17600 area). 17811-17736 [Tentative – confirmation required] (Stop loss: dependent on where one confirms this area).
XAU/USD: (Gold)
Despite Gold closing only a mere $5 higher last week, price ranged a whopping $45 consequently causing this market to print a weekly indecision candle with a slight edge being seen to the upside. In addition to this, we see the weekly chart offering little direction at the moment due to price now loitering mid-range between supply at 1307.4-1280.0 and support drawn from 1224.1.
Looking down to the daily chart shows us that support at 1246.4 was retested on Friday, which also printed an indecision candle, but this time with a slight edge going to the bears. On the assumption that the bulls defend this level this week, the next hurdle in the firing range will likely be resistance penciled in at 1283.4 which is housed within weekly supply mentioned above at 1307.4-1280.0.
Moving down into the pits of the H4 chart, the yellow metal ended the week closing below and retesting the underside of support at 1256.2. To a lot of traders, this will be a level to short from! But because we know that daily support at 1246.4 is now in play, shorting into this flow might not be the best path to take! Therefore, our plan of attack today and possibly into the week will be as follows:
- Watch for the market to close above the current H4 resistance at 1256.2 and look to take advantage of any retest seen (preferably with confirmation from the lower timeframes). Assuming this comes to fruition; targets for longs are Thursday’s high 1270.8, followed closely by the H4 Quasimodo resistance line at 1279.6.
- We still also have our eyes on shorting from the H4 supply area at 1285.5-1278.5, more specifically, the H4 Quasimodo resistance level we just discussed above. Not only does this barrier and its surrounding H4 supply converge with the current weekly supply, but it also encapsulates the current daily resistance hurdle as well. As a result, a market entry at 1279.6 with a stop above the H4 supply at 1286.8 could, depending on the time of day, be something to consider here.
Levels to watch/live orders:
- Buys: Watch for price to consume the 1256.2 level and look to trade any retest seen thereafter (Lower timeframe confirmation required).
- Sells: 1279.6 (Stop loss: 1286.8).


