A note on lower timeframe confirming price action…
Waiting for lower timeframe confirmation is our main tool to confirm strength within higher timeframe zones, andhas really been the key to our trading success. It takes a little time to understand the subtle nuances, however, as each trade is never the same, but once you master the rhythm so to speak, you will be saved from countless unnecessary losing trades. The following is a list of what we look for:
- A break/retest of supply or demand dependent on which way you’re trading.
- A trendline break/retest.
- Buying/selling tails – essentially we look for a cluster of very obvious spikes off of lower timeframe support and resistance levels within the higher timeframe zone.
- Candlestick patterns. We tend to only stick with pin bars and engulfing bars as these have proven to be the most effective.
EUR/USD:
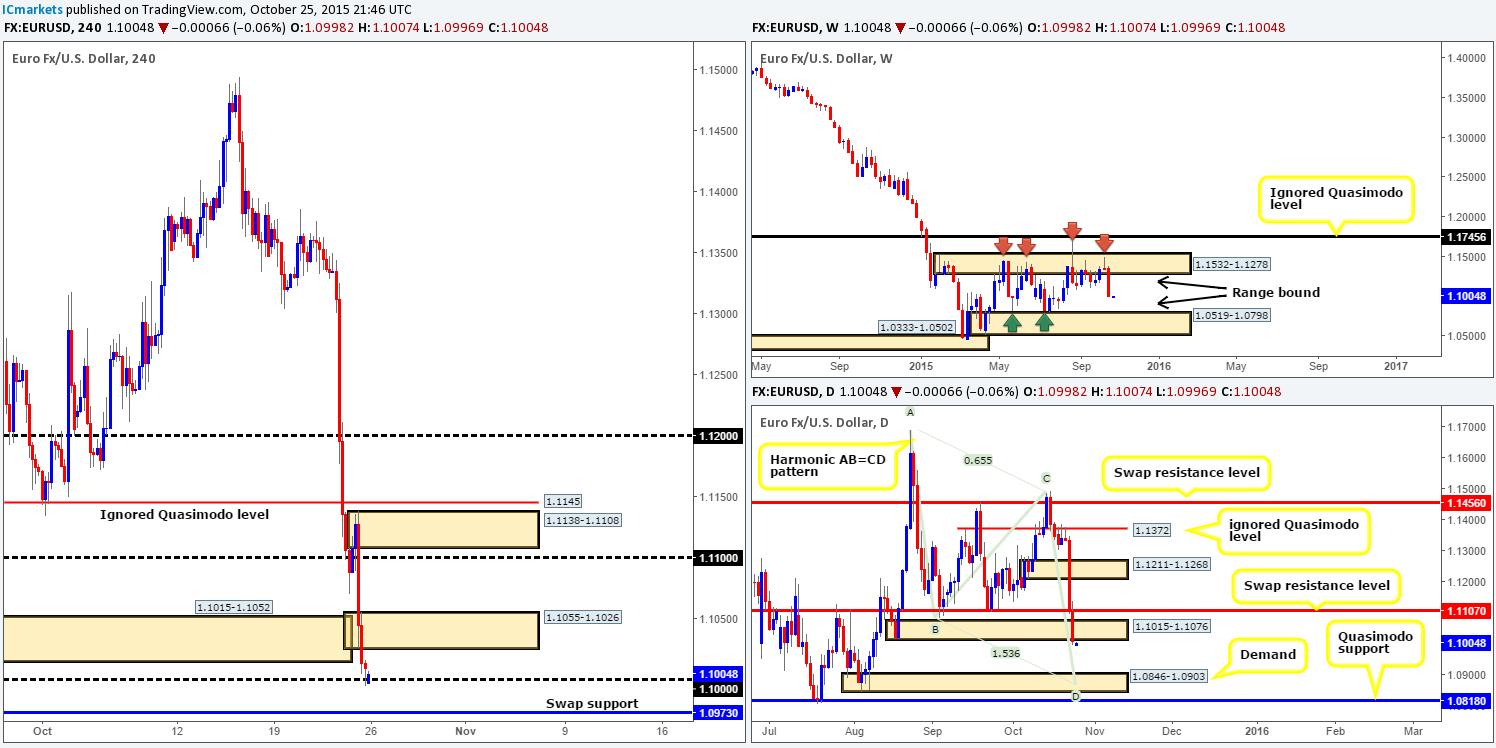
Weekly view:Last week’s action saw the EUR decline a whopping 340 pips from range supply drawn at 1.1532-1.1278, bringing price into mid-range territory by the close 1.1011. This downside move was mainly due to ECB’s President Mario Draghi’s comments regarding the possibility of more easing in the near future. Should further selling be seen this week, traders will likely be honing in on range demand coming in at 1.0519-1.0798.
Weekly levels to watch this week fall in at:1.1532-1.1278/1.0519-1.0798.
Daily view:Moving down to the daily timeframe, we can see that price reacted beautifully from the underside of an ignored Quasimodo level at 1.1372. The move from heretook out both demand sitting at 1.1211-1.1268, and also demand drawn from 1.1015-1.1076. In the event that the majority of bids are taken out from this zone, the pathway, at least on this timeframe, is likely clear down towards demand seen at 1.0846-1.0903. In addition to this, there’s a nice-looking Harmonic AB=CD bull pattern that converges just beautifully with the lower limit of this demand at 1.0873 – Just beautiful confluence!
Daily levels to watch this week fall in at: 1.1015-1.1076/1.1107/1.0846-1.0903/1.1211-1.1268.
4hr view:As already mentioned above, Friday’s sessions saw further downside, which, from the 4hr timeframe, took out demand at 1.1015-1.1052 and connected with bids sitting at psychological support 1.1000just before the close.
Going forward, this morning’s open saw price dip below 1.1000 by two pips at 1.0998, but has so far remained bid for the time being. From the 4hr scale, there is really not much room for this market to move. Directly above current price sits a supply drawn from 1.1055-1.1026, and thirty pips below, a swap support level at 1.0973. It will be only until one of these areas is consumed will we see any true room for this pair to stretch its legs. A break above supply at 1.1055-1.1026 could suggest further upside towards psychological resistance 1.1100, followed closely by supply at 1.1138-1.1108 and an ignored Quasimodo level 1.1145. On the other side of the coin, a break below swap support at 1.0973 shows space for price run down to psychological support 1.0900. Remember guys, 1.0900 lines up perfectly with the top-side of the daily demand mentioned above at 1.0846-1.0903 – this could be a wonderful place to look for longs into this market.
Overall though, we are favoring a break lower here due to the current higher timeframe structure (see above). Therefore, should a close be seen below 1.0973 today, we’ll be watching for two things to happen before we consider a short. Firstly, a retest of this number as resistance, and secondly, lower timeframe selling confirmation following this retest.
Levels to watch/live orders:
- Buys: Watch for offers to be consumed around 1.1055-1.1026 and then look to trade any retest seen at this area (confirmation required) 1.0900 [Tentative – confirmation required] (Stop loss: dependent on where one confirms this level).
- Sells:Watch for bids to be consumed around 1.0973 and then look to trade any retest seen at this level (confirmation required).
GBP/USD:
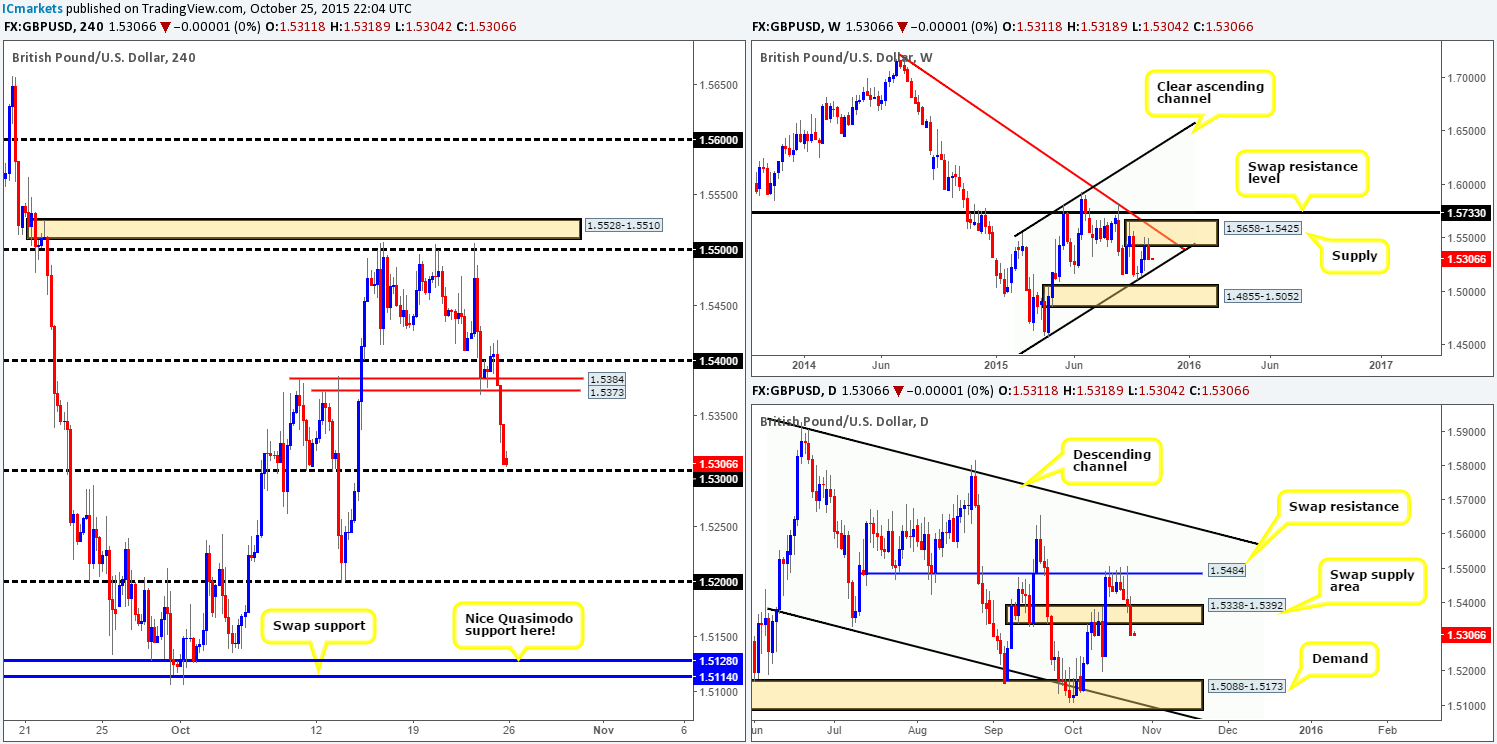
Weekly view: Following two consecutive weeks of buying, Cable suffered a slight knockback during last week’s session. Price sold off from supply seen at 1.5658-1.5425, erasing all of the prior week’s gains and losing close to 130 pips into the close 1.5306. Technically, if the sellers remain dominant this week, we see little reason why price will not shake hands with channel support taken from the low 1.4564, and potentially demand seen just below it at 1.4855-1.5052.
Weekly levels to watch this week fall in at:1.5658-1.5425/Channel support/1.4855-1.5052.
Daily view:In-line with our weekly analysis, daily action shows that this market sold off just beautifully from a swap resistance level coming in at 1.5484. As you can see, this took out bids around a near-term swap demand zone falling in at 1.5338-1.5392. As a result, this may have opened up the doors to further selling this week down to the 13th October low 1.5199, followed closely by demand at 1.5088-1.5173.
Daily levels to watch this week fall in at: 1.5484/1.5338-1.5392/1.5199/1.5088-1.5173.
4hr view: Similar to the EUR/USD, the GBP/USD also took a tumble going into Friday’s trade. Both swap supports sitting at 1.5384/1.5373 were consumed and price descended lower stopping just above psychological support at 1.5300.
With little change seen going into this morning’s open 1.5311, where do we see this market headed today and possibly into the week? Well, taking into account the current direction of the higher timeframes (see above), we would certainly not be comfortable buying from 1.5300 today. That being the case, if 1.5300 is taken out, a short could be possible should price retest the underside of this level with confirmed selling from the lower timeframes. In the event that the above comes to fruition, we’d be targeting psychological support 1.5200, which ties in with the 13th October low mentioned above in the daily section at 1.5199.
Until a break below 1.5300 happens, our team is quite happy to sit on their hands for the time being since a long from 1.5300 would, at least in our book, likely result in a loss.
Levels to watch/ live orders:
- Buys: Flat (Stop loss: N/A).
- Sells: Watch for bids to be consumed around 1.5300 and then look to trade any retest seen at this level (confirmation required).
AUD/USD:
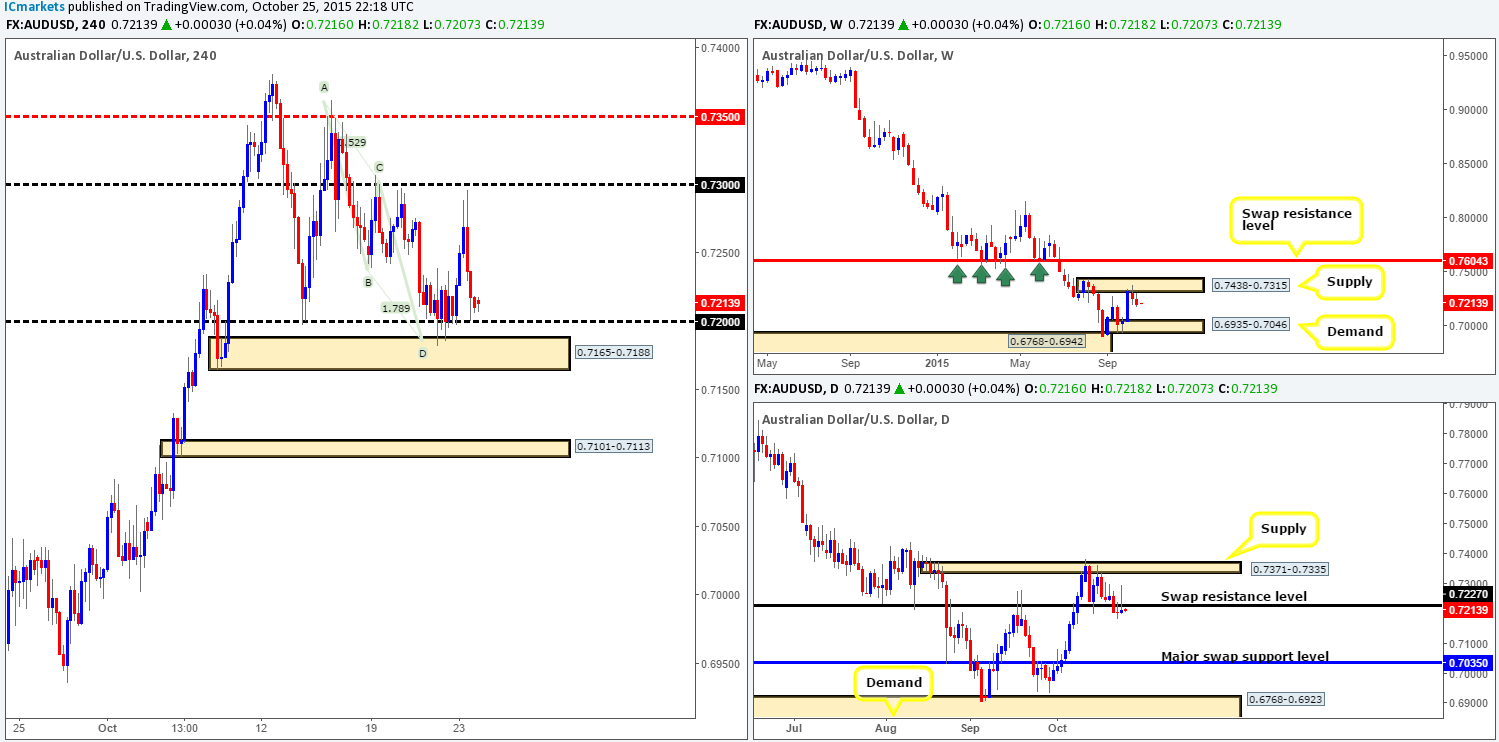
Weekly view: From this viewpoint, we can see that the AUD/USD remains suppressed by supply seen at 0.7438-0.7315, forcing price to close the week fifty pips in the red by the close 0.7210. From our perspective, the response from this area is not fantastic. However, so far, it seems to be doing its job. As such, we see little reason (technically anyway) why this market will not continue to depreciate this week, and may, with enough effort from the sellers, connect with demand at 0.6935-0.7046. It will be interesting to see what the lower timeframes have to say on the matter…
Weekly levels to watch this week fall in at:0.7438-0.7315/0.6935-0.7046.
Daily view: On the other side of the spectrum, action from the daily timeframe shows price closed below a swap support barrier on Wednesday at 0.7227, which held as resistance for the remainder of the week. Should offers continue to provide a ‘ceiling’ to this market here this week, we see a nice run to the downside towards a major swap support level coming in at 0.7035. In the event that 0.7227 fails hold this market lower, however, be prepared to see an advance back up to supply coming in at 0.7371-0.7335.
Daily levels to watch this week fall in at: 0.7227/0.7035/0.7371-0.7335.
4hr view:Following on from Friday’s report (http://www.icmarkets.com/blog/friday-23rd-october-daily-technical-outlook-and-review/), price actually bounced higher than expected from demand (with AB=CD convergence) at 0.7165-0.7188, reaching highs of 0.7296 on the day. Well done to any of our readers who managed to lock in some green pips from this move!
As can be seen from the chart, price closed the week out just above psychological support 0.7200, and opened this morning with little change at 0.7214. Given that price is not only trading from weekly supply, but also being seen held lower by a daily swap (resistance) level (see above), buying from 0.7200 is, at least for us, out of the question.
Ultimately, what we’re looking for this market to do today/this week is close below not only 0.7200, but also the aforementioned 4hr demand zone as well. Once, or indeed if this is seen, our team will then begin watching for a confirmed retest at the underside of this area, targeting demand at 0.7101-0.7113 first and foremost.
Levels to watch/ live orders:
- Buys:Flat (Stop loss: N/A).
- Sells: Watch for bids to be consumed around 0.7200/0.7165-0.7188 and then look to trade any retest seen at this area (confirmation required).
USD/JPY:
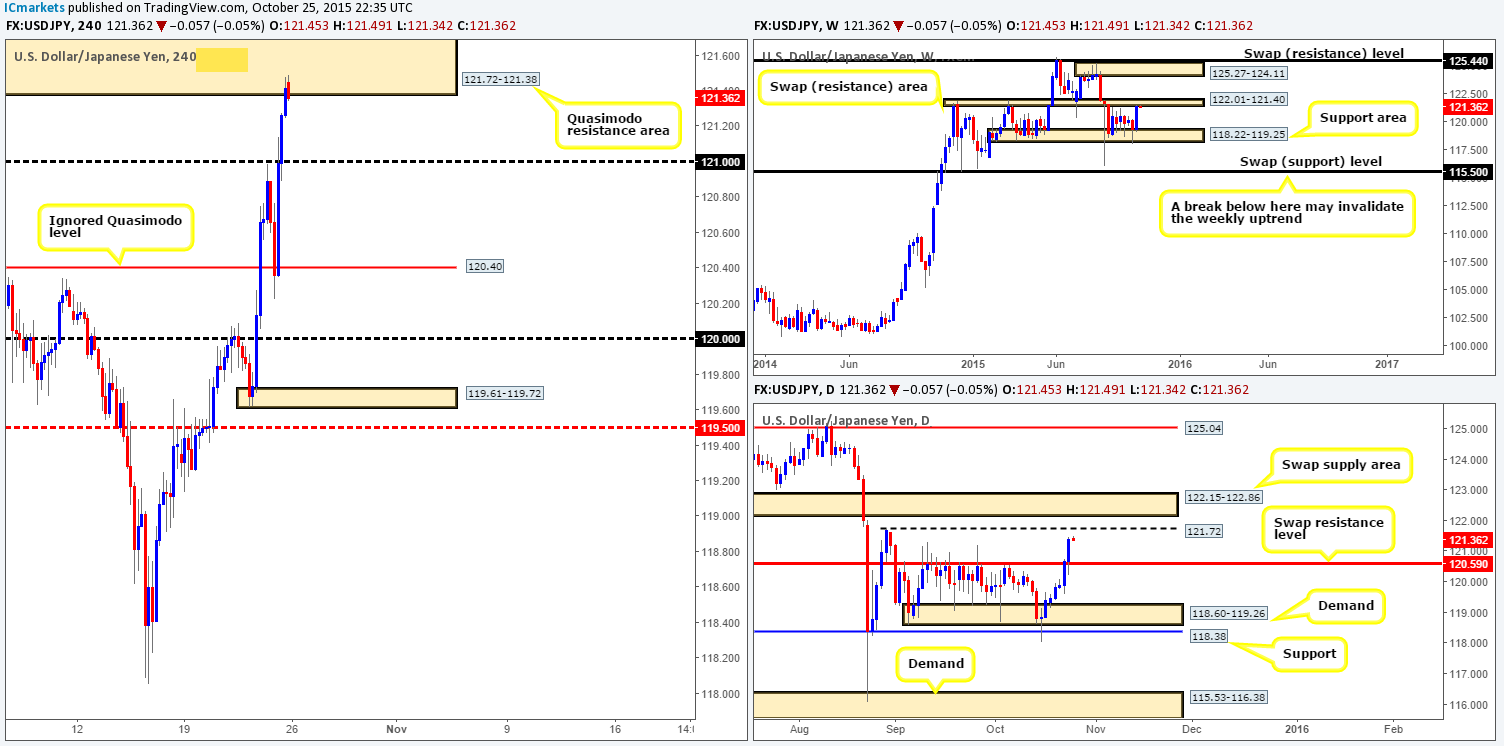
Weekly view: The U.S. dollar gained a little over 200 pips against the Yen last week by the close 121.41. Range support at 118.22-119.25 provided the buyers a stable platform in which to bid this pair higher. However, although this market has effectively increased in value, it is still technically range bound in our view since price is now crossing swords with range resistance seen at 122.01-121.40. It will be interesting to see how the market reacts here this week, as a push above this zone could set the stage for a continuation move north up to supply seen at 125.27-124.11.
Weekly levels to watch this week fall in at:122.01-121.40/118.22-119.25/125.27-124.11.
Daily view:From this angle, we can see that the recent ascent has forced price to breakout above range resistance at 120.59 and come so very close to colliding with the 28th August’s high 121.72. Looking to the left of current price, we see very little resistive structure stopping price from reaching this area this week. This level – followed closely by the swap supply area seen just above it at 122.15-122.86 are likely going to be key areas to watch this week for potential sells in this market.
Daily levels to watch this week fall in at: 120.59/121.72/122.15-122.86.
4hr view:Following a deep retest of an ignored Quasimodo level at 120.40 during early London on Friday, the USD/JPY pair was heavily bid for the remainder of the day. Psychological resistance 121.00 was wiped out and price collided with a clear Quasimodo resistance base at 121.72-121.38 by the week’s end.
Given that weekly action is trading at range supply, and price on the daily is loitering just below the 28th August’s high 121.72 (resistance), we see a potential sell-off from the aforementioned 4hr Quasimodo resistance today. However, before we all go hitting the sell buttons, traders need to be aware that the daily level 121.72 is also the high of our 4hr Quasimodo base, thus price may be drawn to the upper limits of our area or even fake above it! Therefore, we would strongly advise only entering short here should you be able to locate lower timeframe confirming price action (preferably on the 30/60 minute timeframes).
In the event that one does manage to pin-point a lower timeframe setup here, psychological support 120.00 would be our immediate take-profit area.
Levels to watch/ live orders:
- Buys:Flat (Stop loss: N/A).
- Sells:121.72-121.38 [Tentative – confirmation required] (Stop loss: dependent on where one finds confirmation with this area since a fakeout above is possible).
USD/CAD:
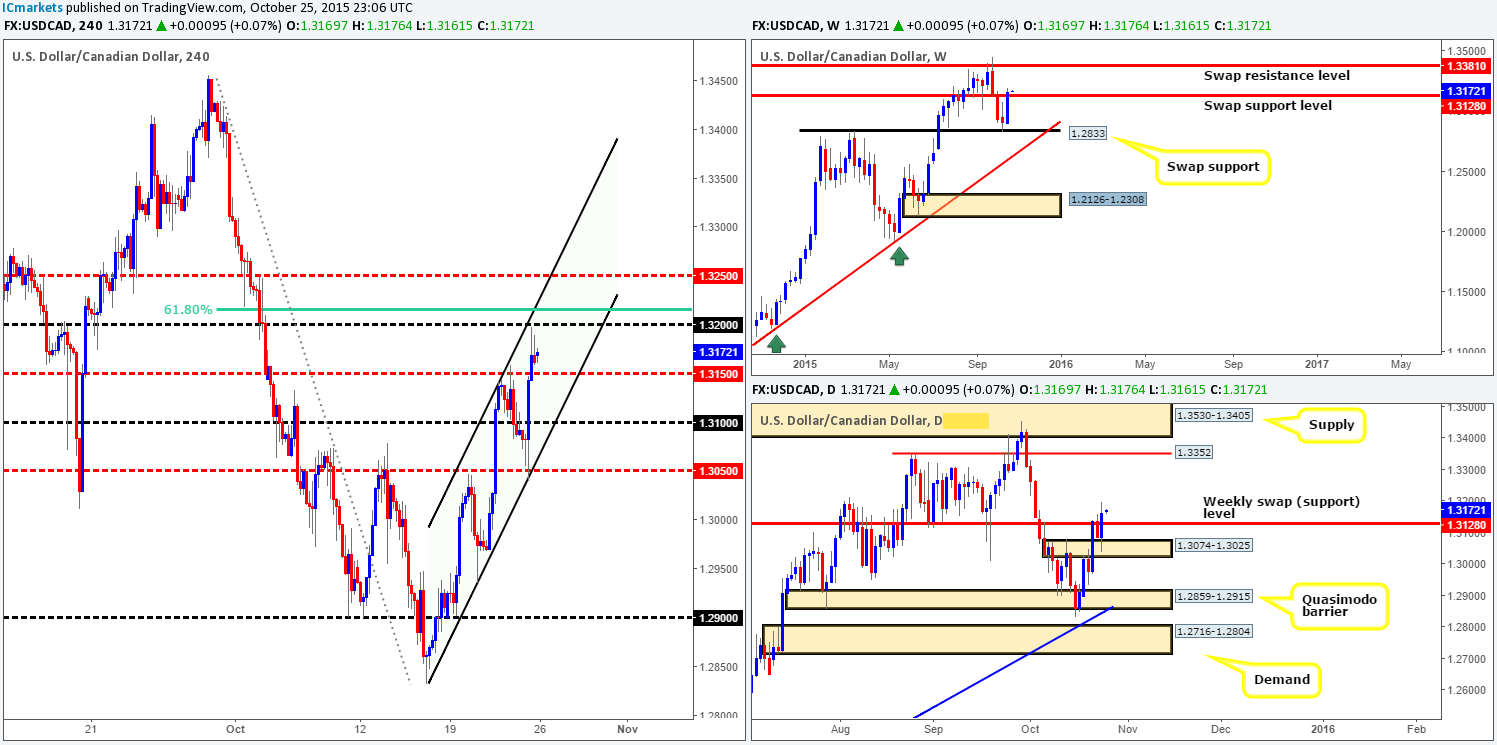
Weekly view:Following the rebound from the swap support level 1.2833, we saw price rocket a little over 250 pips north, consequently closing the week just above a swap resistance level at 1.3128 into the close 1.3162. In the event that this close higher is legit i.e. offers are removed from this level, then there’s little stopping this pair from seeing a further advance this week up to another swap resistance barrier coming in at 1.3381.
Weekly levels to watch this week fall in at:1.2833/1.3128/1.3381.
Daily view: Much the same as the weekly chart, the daily chart shows Friday’s daily candle spiking south to collect bids around a swap demand at 1.3074-1.3025, before solidifying the close above the aforementioned weekly swap (resistance) level. The next upside targets to keep an eye on from this timeframe come in at 1.3352 – a Quasimodo resistance level, followed closely by supply seen at 1.3530-1.3405. Both areas are in close proximity to the above said weekly swap (resistance) level.
Daily levels to watch this week fall in at: 1.3074-1.3025/1.3128/1.3352/1.3530-1.3405.
4hr view:From this angle, we can see that Friday’s trade spiked lower to fill bids around mid-level support 1.3050 mid-ways through the London session. Consequent to this, a flurry of bids came into the market sending price around 150 pips north up to the underside of psychological resistance 1.3200 (converges with channel resistance taken form the high 1.3144), which, after a small sell off is where the market concluded trade for the week.
As we can all see, this morning’s open 1.3169 has made little difference to the structure of this pair as price continues to loiter between 1.3200/1.3150. Trading in between this small band is of little interest to us. What we are looking at, however, is for price to close above 1.3200 since this, at least as far as we can see, will do the following:
- Likely clear the path towards mid-level resistance 1.3250.
- Take out offers around the 61.8% Fibonacci level at 1.3216.
- Confirm strength above the weekly swap (support) level at 1.3128.
For now though, we’re happy to remain flat on this pair. Nevertheless, once/if price closes above 1.3200; we’ll then begin preparing to enter long. Where and when is hard to say right now though since it is difficult to predict whether price will retrace to retest channel support extended from the low 1.2832.
Levels to watch/ live orders:
- Buys:Flat (Stop loss: N/A).
- Sells:Flat (Stop loss: N/A).
USD/CHF:
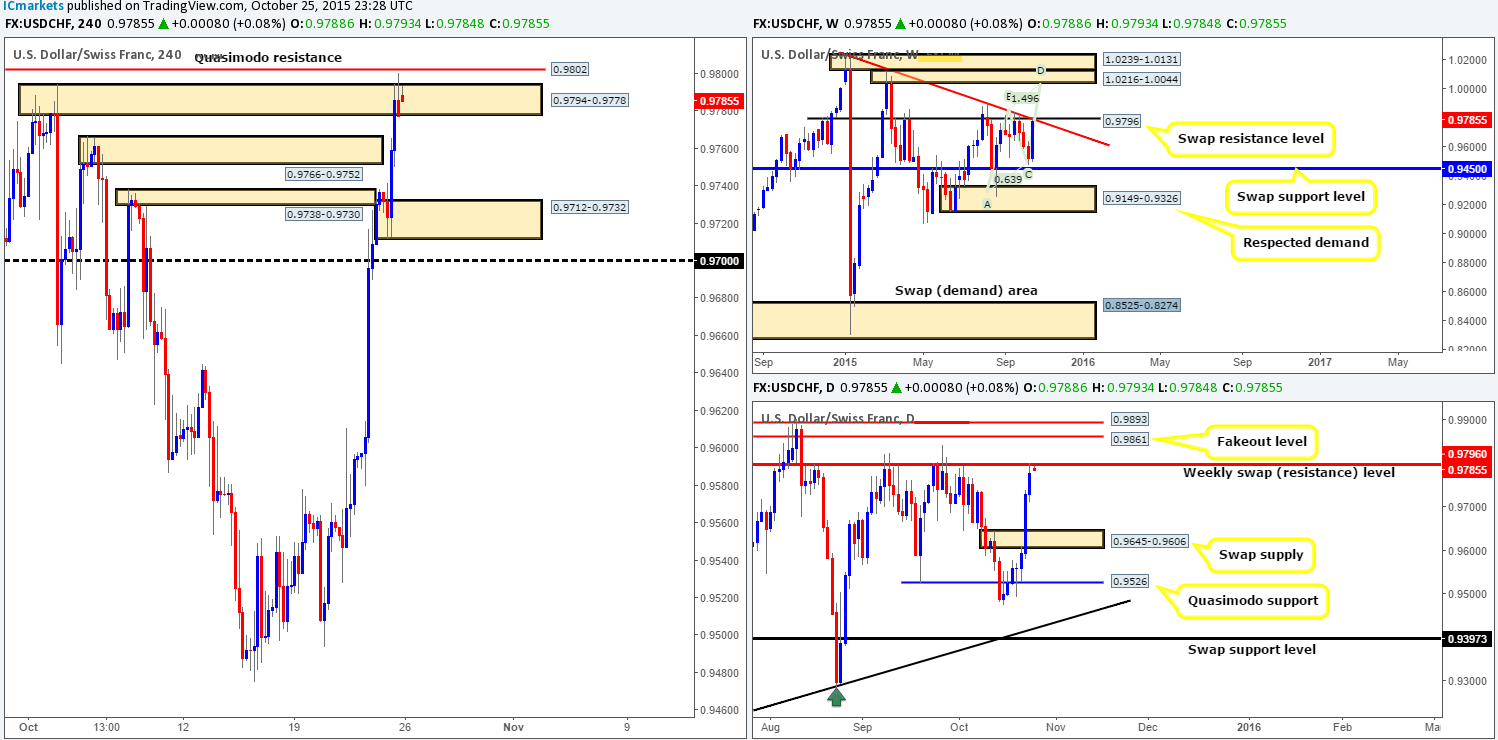
Weekly view: Launching itself from just above swap support at 0.9450, the U.S. dollar gained around 250 pips in value against the Swiss Franc last week into the close 0.9777. Consequent to this, price is now shaking hands with a well-respected swap resistance level at 0.9796, which also boasts trendline convergence from the high 1.0239. A sell-off from this beauty once again has the aforementioned swap support level to target. If, on the other hand, price breaks above this level this week, we could be looking at a further advance up to a stacked area of supply coming in at 1.0239-1.0131/1.0216-1.0044. In addition to this formation, we also see a nice-looking AB=CD Harmonic pattern completion point around 1.0046, thus making this one heck of a sell zone should price reach this high!
Weekly levels to watch this week fall in at:0.9796/0.9450/1.0216-1.0044/1.0216-1.0044.
Daily view: Similar to the weekly timeframe, we can see daily action now flirting with the underside of the aforementioned weekly swap (resistance) level. The only difference we see on this timeframe, however, is a break above the weekly level places the fakeout barrier at 0.9861, followed closely by a resistance level coming in at 0.9893 in the firing range. Conversely, a sell-off from the weekly level has the swap supply area at 0.9645-0.9606 to target.
Daily levels to watch this week fall in at: 0.9796/0.9861/0.9893/0.9645-0.9606.
4hr view: In Friday’s report (http://www.icmarkets.com/blog/friday-23rd-october-daily-technical-outlook-and-review/) we mentioned that we had no interest in shorting from either the supply at 0.9738-0.9730 or the one above it at 0.9766-0.9752. The reason for why was because both the weekly/daily timeframes showed relatively clear runways up to the weekly swap (resistance) level at 0.9796 around that time. We were, nonetheless, interested in supply at 0.9794-0.9778, and Quasimodo resistance at 0.9802 since both barriers are in relatively close proximity to the aforementioned weekly level.
As you can see, price did indeed rally north, taking out the two lower supplies mentioned above and faked above our preferred supply at 0.9794-0.9778, just missing the Quasimodo resistance level 0.9802 by a few pips before selling off.
Now, given that price is trading from a weekly level at the moment, our team is going to be watching how the lower timeframes respond after this morning’s open 0.9788. In the event a nice-looking lower timeframe sell setup forms here today, we would, dependent on the time of day of course, jump in short targeting demand seen at 0.9712-0.9732, followed closely by psychological support at 0.9700 first and foremost. This trade, considering the location of price on the weekly timeframe, could be a nice runner. Therefore, we plan on giving it a lot of room to breathe by placing our stop above the high 0.9842 at 0.9845.
Levels to watch/ live orders:
- Buys: Flat (Stop loss: N/A).
- Sells: 0.9794-0.9778/0.9802 [Tentative – confirmation required] (Stop loss: 0.9845).
DOW 30:
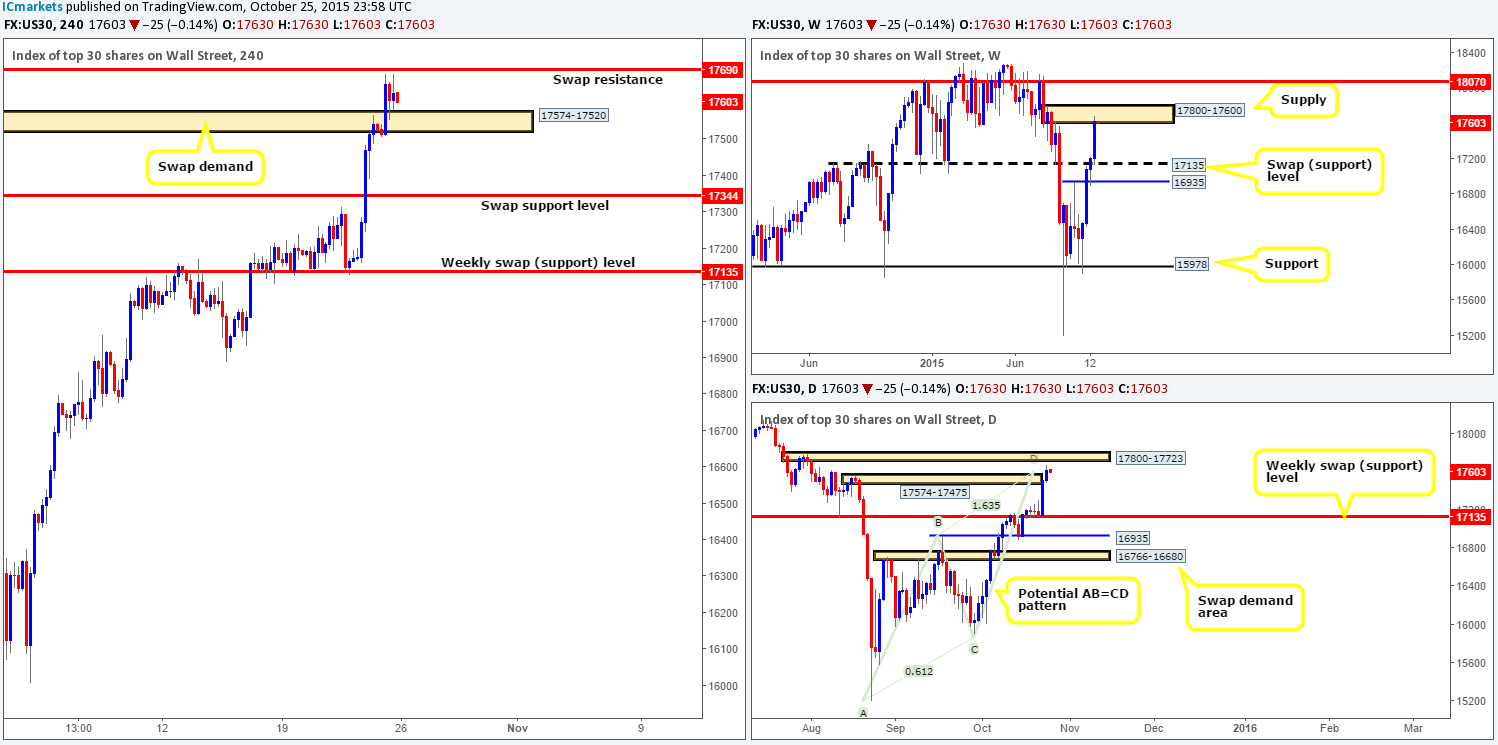
Weekly view:Following the close above swap resistance at 17135, price chalked up a fourth consecutive bull candle last week, consequently gaining a little over 420 points at the close 17628. As a result of this continuation move, the DOW index is now crossing swords with supply seen at 17800-17600. Supposing that offers are able to contain this rally, the next downside target to watch comes in at 17135 – now support. A break above current supply on the other hand, will likely see price continue north up to 18070.
Weekly levels to watch this week fall in at:17800-17600/17135/18070.
Daily view: From this angle, we can clearly see that shortly after the close above the weekly swap (resistance) level at 17135, price retested this hurdle as support and rallied from here on Thursday, touching gloves with supply at 17574-17475. Be that as it may, Friday’s action saw a continuation move north, consuming this supply and at the same time also invalidating an AB=CD bearish pattern at 17612. The next area we have our eye can be seen at supply drawn from 17800-17723 (located deep within the aforementioned weekly supply).
Daily levels to watch this week fall in at: 17800-17723/17135.
4hr view:(We still have a LIVE short in the market from 17527 with our stop at 17830 [above weekly supply]).
During the course of Friday’s sessions, price hesitated within supply at 17574-17520, before shooting north going into London trade. As a consequence, this area was consumed and retested as demand. The open 17630 shows price is still hovering above the aforementioned swap demand zone. Assuming that this area remains strong, it is likely we’ll see offers around the swap resistance level at 17690 filled today.
Taking all of the above into consideration, here is what we have jotted down so far:
- It is very possible price will attack the 4hr swap (resistance) level at 17690 today. However, placing a pending sell order here is very risky indeed. Reason being is that directly above this hurdle sits the daily supply zone mentioned above at 17800-17723. Therefore, do expect a fakeout above this 4hr level before considering a short!
- In the event that price closes below the 4hr swap demand area at 17574-17520 today, we feel the DOW will likely head lower to at least the swap support level at 17344 (a nice target for any intraday shorts). That being the case, should price retest the underside of this barrier and show some form of lower timeframe selling strength here, we may consider shorting this market, adding to our current short from 17527.
Levels to watch/ live orders:
- Buys: Flat (Stop loss: N/A).
- Sells:17527 [LIVE] (Stop loss: 17830) 17690 [Tentative – confirmation required] (Stop loss: dependent on where one confirms this level since a fakeout up to daily supply at 17800-17723 is highly possible) watch for bids to be consumed around 17574-17520 and then look to trade any retest seen at this area (confirmation required).
XAU/USD: (Gold)
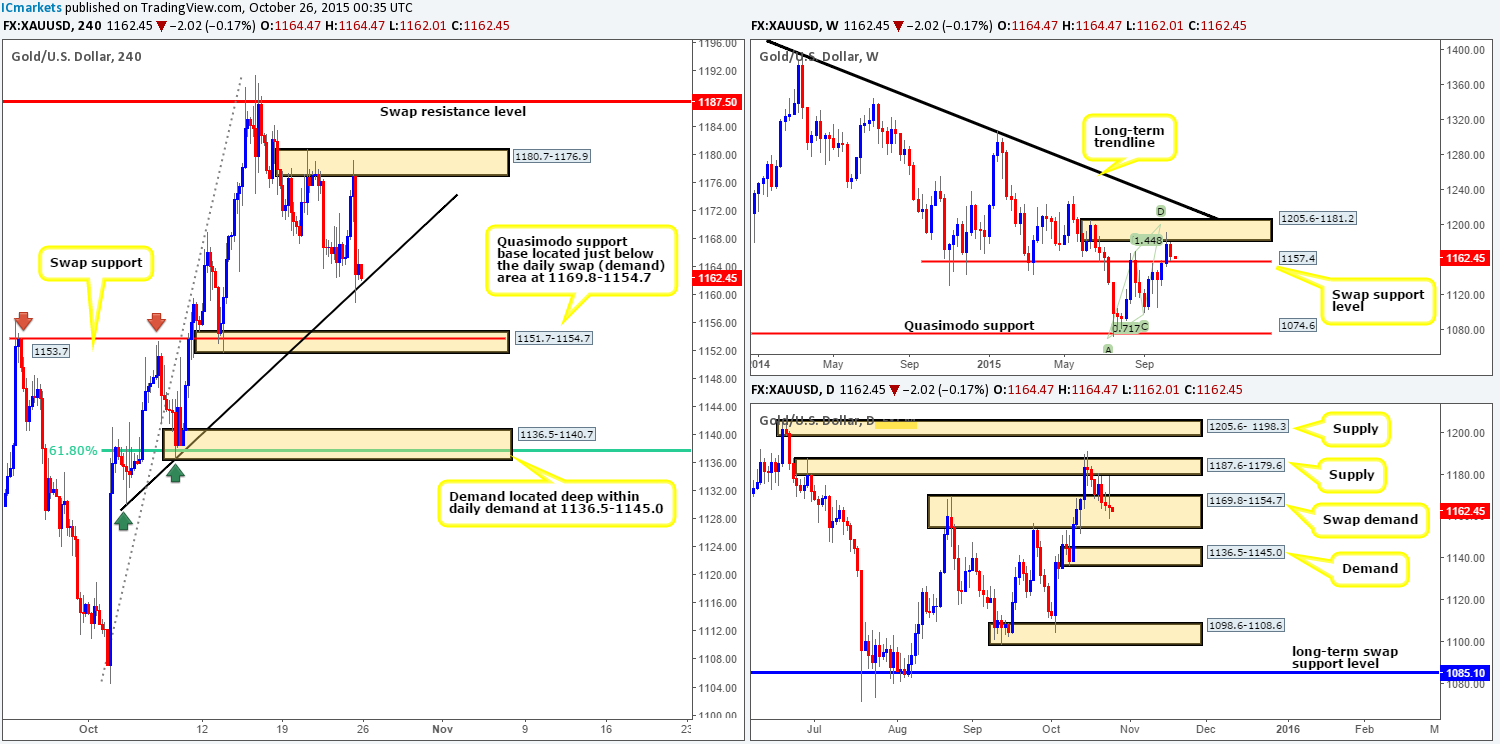
Weekly view: As can be seen from the weekly chart, the price of Gold declined over $13 in value from the underside of supply coming in at 1205.6-1181.2 last week, consequently painting a bearish inside candle going into the close 1164.4. Nevertheless, looking to sell this bearish pattern from here this week is tricky since price is now trading at a swap support barrier seen at 1157.4. Let’s take a look lower down to see what’s on offer…
Weekly levels to watch this week fall in at:1205.6-1181.2/1157.4.
Daily view: From this angle, we can see that daily movement was capped last week between a swap demand area coming in at 1169.8-1154.7, and a supply zone drawn from 1187.6-1179.6. We have little interest in these areas this week to be honest. What we do have our beady little eye on though is the surrounding zones – supply at 1205.6- 1198.3 and demand taken from 1136.5-1145.0. This supply is particularly attractive due to it being tightly lodged within the aforementioned weekly supply zone. The demand, however, can be seen just below the aforementioned weekly swap (support) level, which could provide pro money a nice base in which to facilitate a fakeout this week.
Daily levels to watch this week fall in at: 1205.6- 1198.3/1136.5-1145.0.
4hr view:(Slightly revised)
Amid Friday’s trade price aggressively sold off from a high of around 1179.2, breaking below Thursday’s low 1162.4 and connecting with trendline support taken from the low 1130.0.
This morning’s open 1164.4 saw little change and shows price still hovering above the aforementioned trendline support. Now, as per this timeframe and keeping the higher timeframe structures in mind, this is what we’re looking at right now:
- Buying from the trendline is possible, but with no converging structures, we intend to keep our distance!
- Should price respond bullishly to the current trendline support, however, we’ll then be eyeing the resistance area at 1180.7-1176.9, followed closely by the swap resistance level at 1187.5. Although both areas are located within the boundaries of daily supply at 1187.6-1179.6, entering at market here would be risky in our opinion. Notice that daily supply area has already been breached (15/10/15) thus indicating potential weakness. This is not to say a reaction will not be seen from either of the above said 4hr areas, it is just we’d feel more comfortable shorting WITH lower timeframe confirmation than blindly entering short and hoping for the best.
- The Quasimodo support base at 1151.7-1154.7 is an interesting zone. Not only does it have strong momentum from the base back on the 13th October, it also converges nicely with a swap support level at 1153.7 and is located just below the daily swap (demand) area at 1169.8-1154.7. We would consider an intraday long from here should lower timeframe confirmation also form.
- Demand at 1136.5-1140.7. This area is a beauty! It is located deep within daily demand mentioned above at 1136.5-1145.0, and also coincides nicely with the 61.8% Fibonacci level at 1137.7. Dependent on the time of day, we would consider a market buy here!
Levels to watch/ live orders:
- Buys:1151.7-1154.7 [Tentative – confirmation required] (Stop loss: dependent on where one confirms this area) 1136.5-1140.7 [Tentative – confirmation required] (Stop loss: dependent on where one confirms this area).
- Sells: 1180.7-1176.9 [Tentative – confirmation required] (Stop loss: dependent on where one confirms this area) 1187.5 [Tentative – confirmation required] (Stop loss: dependent on where one confirms this level).


