


Lower timeframe confirmation: is something we use a lot in our analysis. All it simply means is waiting for price action on the lower timeframes to confirm direction within a higher timeframe area. For example, some traders will not enter a trade until an opposing supply or demand area has been consumed, while on the other hand, another group of traders may only need a trendline break to confirm direction. As you can probably imagine, the list is endless. We, however, personally prefer to use the two methods of confirmation mentioned above in our trading.
EURUSD:
Weekly recap:
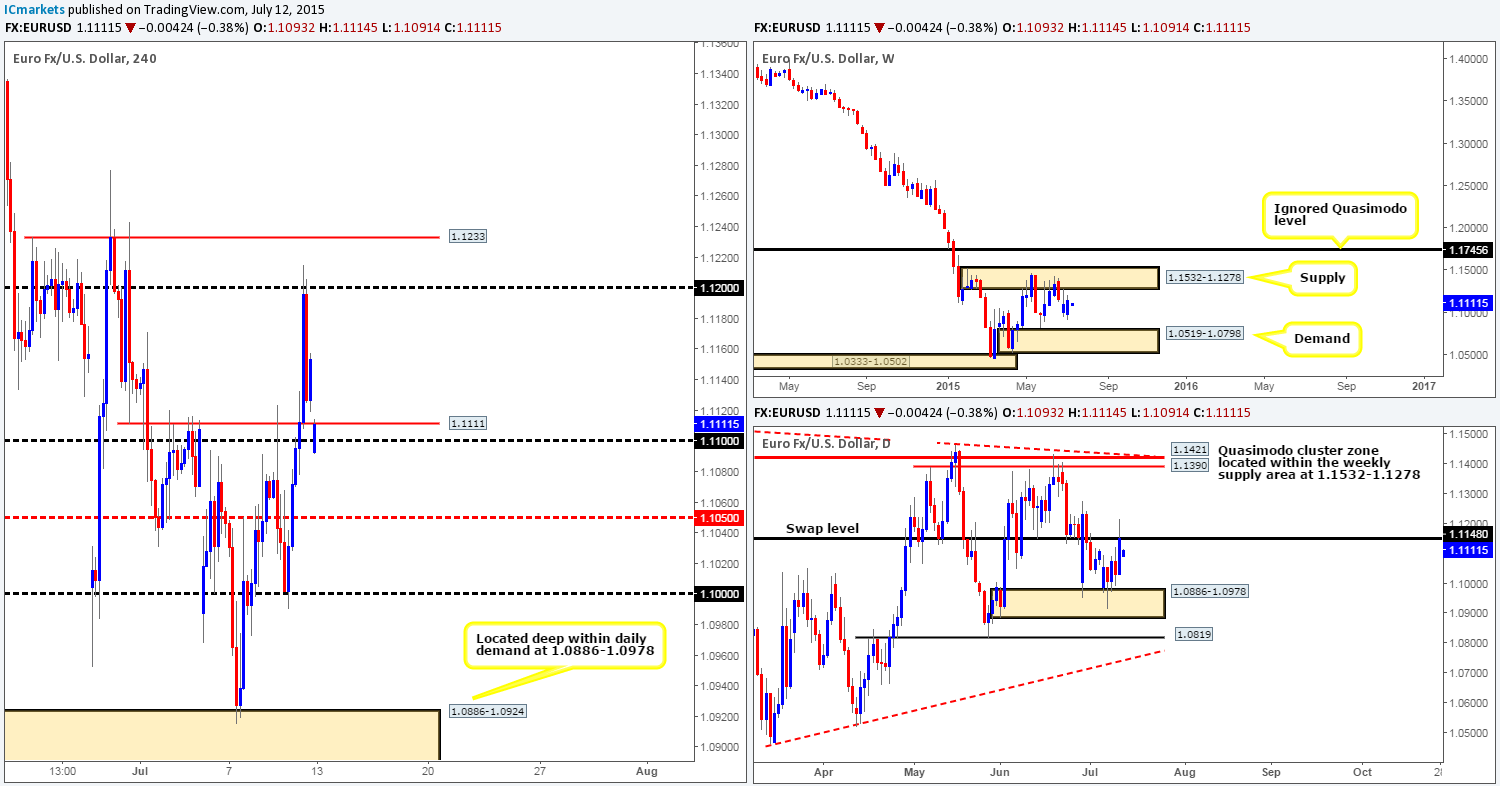
Last week’s action saw the EUR currency print a bullish engulfing candle on the weekly timeframe, closing 45 pips above the prior week’s close (1.1108) at 1.1153. Despite this, price still remains somewhat capped between a weekly demand area at 1.0519-1.0798 and a weekly supply zone at 1.1532-1.1278. The daily timeframe on the other hand, shows that the market was supported by a daily demand area coming in at 1.0886-1.0978, which eventually forced price north up to a distinct daily swap (resistance) barrier at 1.1148.
Moving down to the 4hr timeframe, we can see how even the prospect of a Greek deal lifted the EUR during Friday’s sessions. This move took out several 4hr technical levels during this onslaught, and only really saw a reversal once price tested 1.1200.
The EUR pair once again begun the week on its back foot. Price gapped 60 pips south at the open 1.1093 breaking below the 1.1000 handle. This move was likely fuelled by weekend talks regarding Greece, which once again failed to secure a bailout deal. Following the open, current action shows that the bulls are pressing forward in early trade, which will likely see the weekend gap filled relatively quickly.
With regards to trading this pair, we’re afraid that technicals may suffer as rumors will likely continue to flood the wire today/this week, so any trading opportunities we see on the EUR/USD will only be considered with a smaller than usual position size. With all of the above taken into consideration, here are the levels we are watching for the time being:
For buys:
- The mid-level number 1.1050. A small bounce north could be seen from here, how big of a bounce though will likely depend on how price approaches this barrier.
- The round number 1.1000. Judging by Thursday’s aggressive rebound seen from this level, we believe there could potentially be some unfilled buy orders lurking here, hence well worth keeping an eye on.
For sells:
- The round number 1.1200. This level saw a nice reaction during the N.Y afternoon session on Friday, which could repel the market once more should it be visited again this week.
- The 4hr resistance barrier seen at 1.1233. Several attempts were made to trade above this number but each time it held strong, thus making it a level to be respected.
Levels to watch/live orders:
- Buys: 1.1050 [Tentative – confirmation required] (Stop loss: dependent on where one confirms this level) 1.1000 [Tentative – confirmation required] (Stop loss: dependent on where one confirms this level).
- Sells: 1.1200 [Tentative – confirmation required] (Stop loss: dependent on where one confirms this level) 1.1233 [Tentative – confirmation required] (Stop loss: dependent on where one confirms this level).
GBP/USD:
Weekly recap:
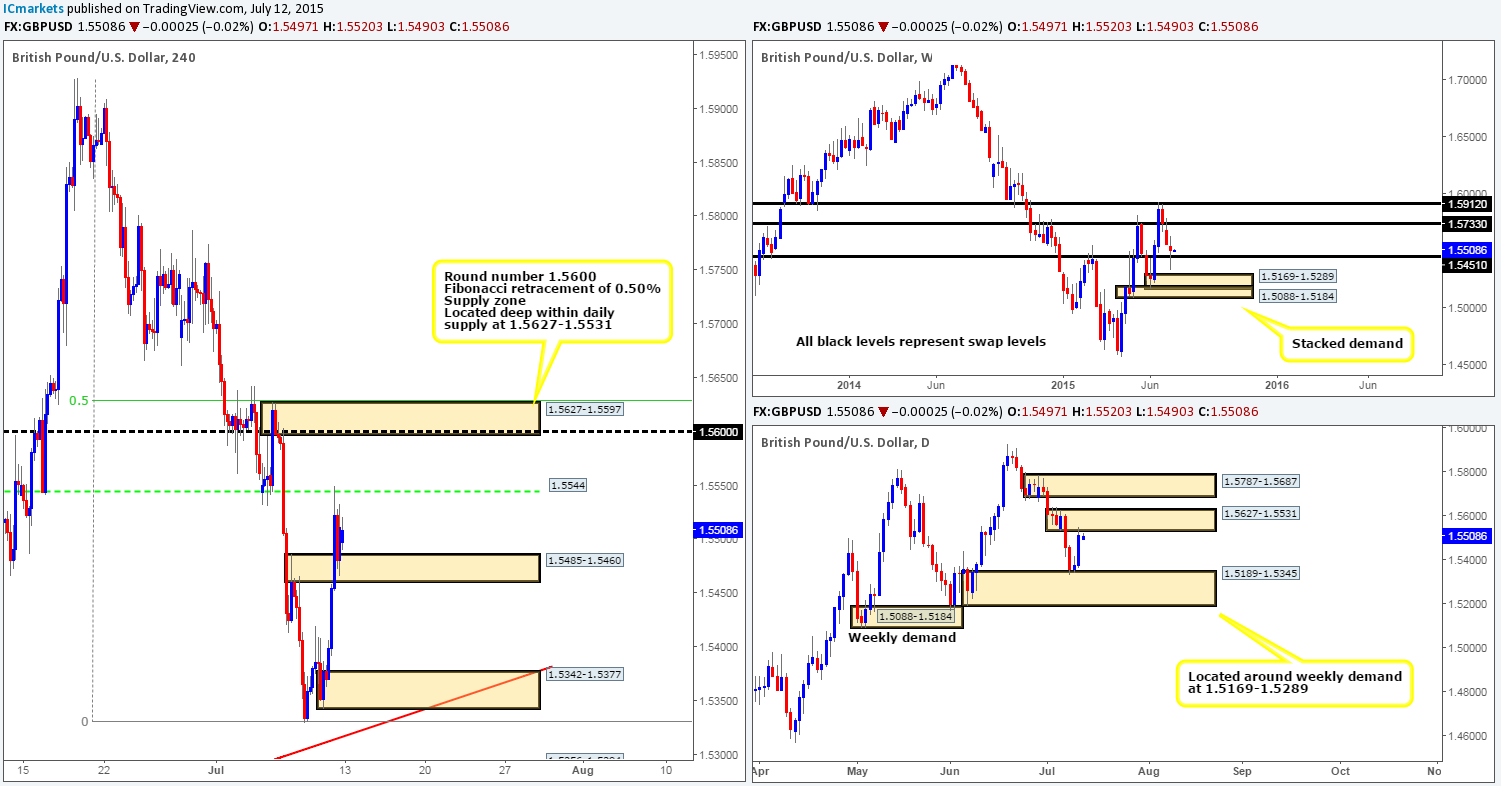
Pound Sterling sustained further losses for the third consecutive week last week, losing 50 pips into the close 1.5511. In spite of this, price was unable to close below the weekly swap level coming in at 1.5451. Looking down to the daily timeframe, we can see that additional support came into this market from a daily demand area at 1.5189-1.5345, which, as you can see, eventually forced price to cross swords with a daily supply zone at 1.5627-1.5531.
In the same way the Euro surged higher on Friday, the GBP also spring boarded north. This took out not only a 4hr swap area at 1.5440-1.5402, but also a 4hr supply zone seen at 1.5485-1.5460, which eventually saw price marry up with a 4hr swap level at 1.5544 that held the market lower into the weekend.
Moving forward, Sunday’s open 1.5494 saw the market gap south 14 pips, which technically has made very little difference as price remains trading between a 4hr swap level at 1.5544, and a 4hr swap area at 1.5485-1.5460. One could if they so wished attempt to trade in between this temporary 4hr range today. With a small enough stop, the risk/reward could still work out very favorable targeting the opposing range limit.
Should the market breakout north his week, however, it is likely price will steam higher to connect with a 4hr supply area at 1.5627-1.5597. Buying the breakout here is out of the question for us. What we are interested in though is fading the said 4hr supply zone, since it converges with not only a Fibonacci retracement value of 0.50%, but also a round number level at 1.5600. On top of all this, it is also lodged deep within the aforementioned daily supply area. Usually, we would consider setting a pending sell order here, but seeing as the weekly timeframe currently shows supportive pressure from a weekly swap level at 1.5451, we’re going to need some sort of lower timeframe sell signal here before risking capital.
In the event that this market decides to push below the current 4hr swap area this week, we will most definitely be interested in trading any confirmed retest seen of this area, targeting the 4hr demand area at 1.5342-1.5377. Confirmation is required here since even though we’re trading from daily supply at the moment, we would at the same time be going up against weekly support (see above for levels), so caution is advised. Should all go to plan and price hits target, this would be a good place to begin looking for longs into this market since this 4hr demand area is not only very strong in appearance, but also converges just beautifully with a 4hr trendline extended from the low 1.5169.
Levels to watch/ live orders:
- Buys: 1.5342-1.5377 [Tentative – confirmation required] (Stop loss: 1.5325).
- Sells: 1.5627-1.5597 [Tentative – confirmation required] (Stop loss: 1.5635).
AUD/USD:
Weekly recap:
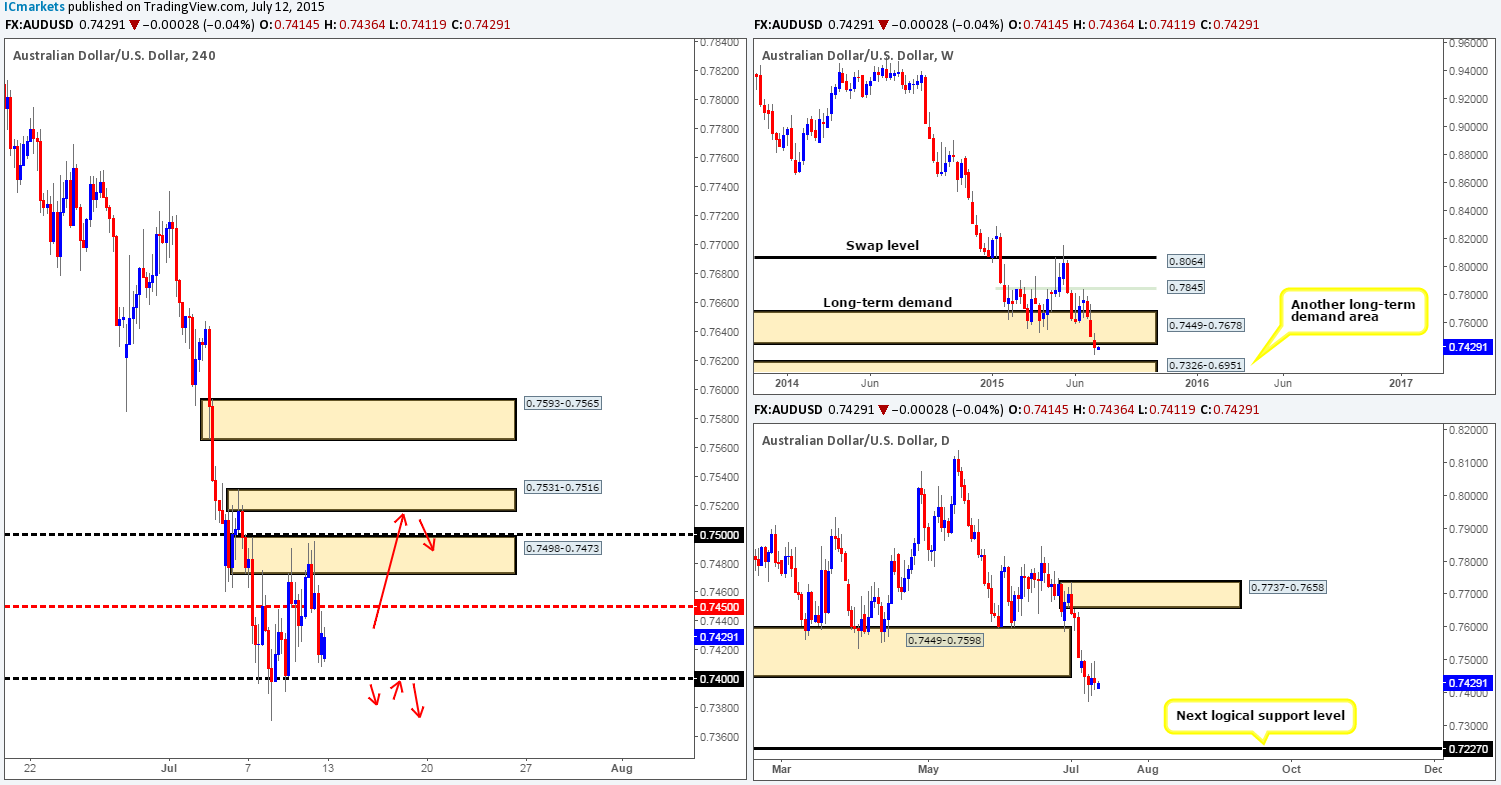
The AUD/USD currency pair continued to spiral south last week, losing 76 pips of value into the weekly close 0.7431. This forced price to close below both a long-term weekly demand area at 0.7449-0.7678, and its partner demand on the daily timeframe at 0.7449-0.7598. With that, we believe the higher timeframe path south is now likely free until the top-side of a weekly demand area at 0.7326-0.6951.
Lower down on the 4hr timeframe, however, we can see that price sold off just beautifully from the 4hr supply area at 0.7498-0.7473 on Friday, which in turn, took out the mid-level number 0.7450 and closed within shouting distance of the round number support 0.7400. We do hope some of our readers took advantage of this move south since this was an area that we mentioned to keep a close eye on during Friday’s sessions.
This morning’s open saw the market gap south 17 pips, which from a technical standpoint made very little difference to structure. Considering that both the weekly and daily timeframes show the path south is now likely clear for further selling (see above), today’s spotlight will be firmly focused on the round number 0.7400. However, we have no intention in trading this level long; we’re looking for it to be violated as it could provide a nice selling opportunity on the retest down to the top-side of weekly demand at 0.7326.
On the other hand, should price continue to hold higher today, we have our sights set firmly on the 4hr supply area seen above at 0.7531-0.7516 as per the red arrows. The reason we’re ignoring the levels in between is simply because we believe that most of the offers around these zones have likely already been taken out. What is more, let’s also not forget that the round number 0.7500 is sitting just below our area of interest, which could potentially act as a magnet to price and also provide well-funded traders the opportunity to fakeout above this hurdle thus collecting buy stops to sell into from the aforementioned 4hr supply area.
Levels to watch/ live orders:
- Buys: Flat (Stop loss: N/A).
- Sells: 0.7531-0.7516 [Tentative – confirmation required] (Stop loss: 0.7537).
USD/JPY:
Weekly recap:
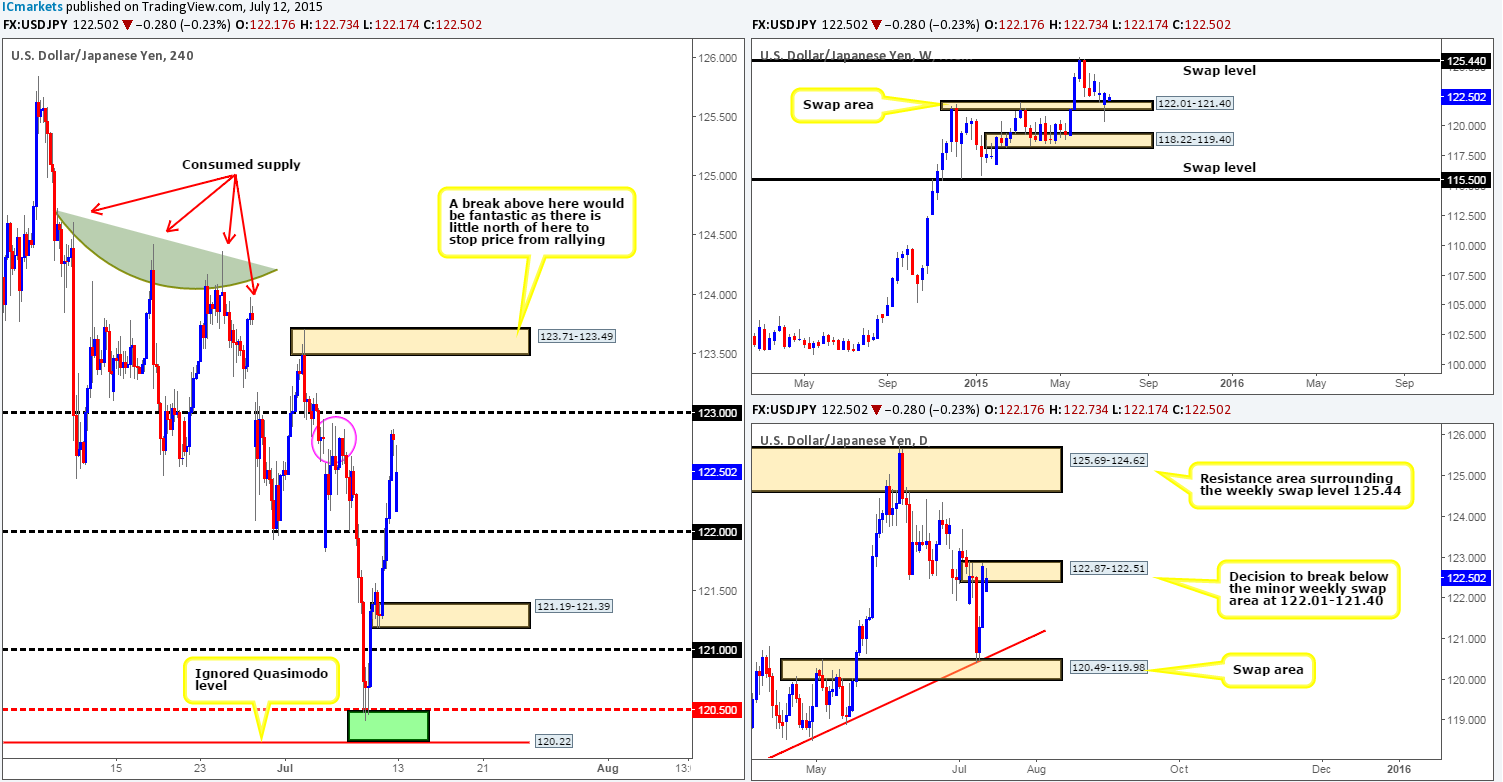
Despite the volatility seen on the USD/JPY pair last week, and the fact that price punched through a floor of bids at a weekly swap area at 122.01-121.40, the market ended up closing at the prior week’s close 122.78. From the pits of the daily scale, however, price rebounded off of a daily swap area at 120.49-119.98 (boasts daily trendline convergence from the low 115.84) on Thursday, which saw follow-through buying going into Friday’s session, consequently placing price deep within the jaws of a daily supply zone at 122.87-122.51.
With regards to the 4hr timeframe, Friday’s bullish momentum shows that price took out a ton of 4hr technical resistance levels along the way, which, as you can see, saw little selling pressure during the three major trading sessions that day. Price ended up closing the week into a compact area of consumed supply. Take note of the consumption wicks seen marked with a pink circle at: 122.95/122.92/122.87.
Going into this morning’s open 122.17, price gapped 61 pips lower which was very quickly filled. Now, considering the mixed signals we’re receiving from the higher timeframes (see above in bold) at the moment, the best, and safest thing we believe we can do today/this week is watch the following levels of interest and trade only when/if lower timeframe confirming price action presents itself, as we do not want to get caught on the wrong side of higher timeframe direction:
Bids:
- The round number 122.00. This hurdle has provided significant support and resistance to the market over the past month, so is well worth keeping a tab on.
- A fresh 4hr demand area coming in at 121.19-121.39. The momentum seen from this zone makes it very attractive.
Offers:
- The round number 123.00. This level is not as significant as 122.00 in our opinion, but should still be watched closely should price reach this area today.
- Fresh 4hr supply area at 123.71-123.49 which was formed during the NFP announcement last Thursday.
Levels to watch/ live orders:
- Buys: 122.00 [Tentative – confirmation required] (Stop loss: dependent on where one confirms this level) 121.19-121.39 [Tentative – confirmation required] (Stop loss: 121.13).
- Sells: 123.00 [Tentative – confirmation required] (Stop loss: dependent on where one confirms this level) 123.71-123.49 [Tentative – confirmation required] (Stop loss: 123.77).
USD/CAD:
Weekly recap:
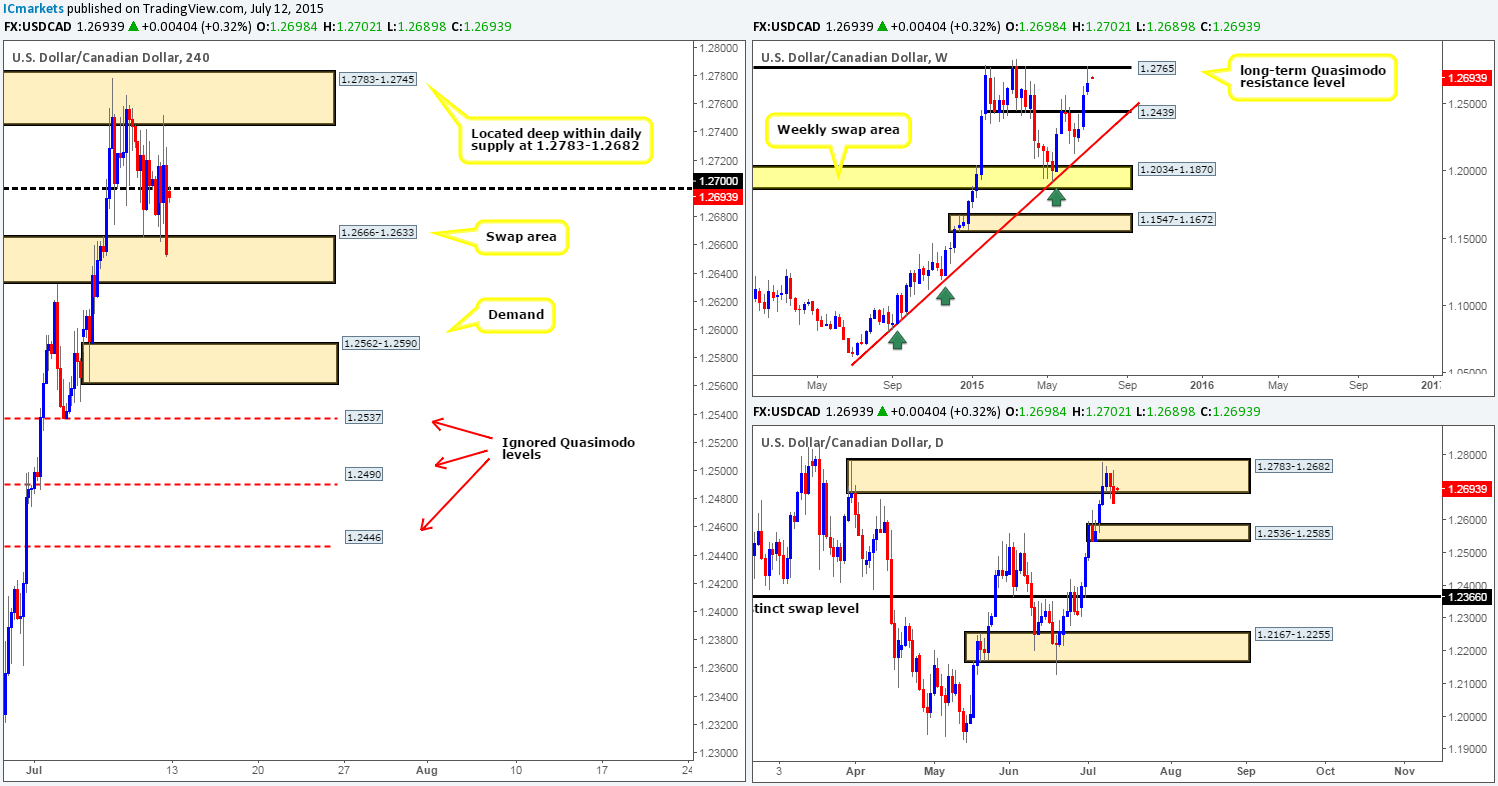
Despite the USD recording an 87 pip gain on the week, a picture-perfect reaction was seen off of the long-term weekly Quasimodo resistance level at 1.2765, forming a weekly bearish pin-bar candle in the process. Looking at the daily picture, we can see that after a few days of hesitation, price eventually sold off from a daily supply area at 1.2783-1.2682 (surrounds the aforementioned weekly swap level) into the close 1.2653. Both higher timeframe areas mentioned above show room for prices to move lower this week.
And finally a quick look at the 4hr timeframe action shows price has been a mish-mash of wicks and tails since Wednesday last week between a 4hr supply area at 1.2783-1.2745 (located deep within the aforementioned daily supply area) and a 4hr swap area at 1.2666-1.2633.
Looking ahead, this morning’s open 1.2698 saw price gap 45 pips higher, placing the market firmly at the underside of the round number 1.2700. Taking into consideration the current location of price on the higher timeframe structures (see above), and the fact that price drove relatively deep into the aforementioned 4hr swap area just before the close on Friday (bids likely consumed), we may, if lower timeframe selling confirmation is seen, attempt to short from the 1.2700 barrier today, targeting the 4hr demand area at 1.2562-1.2590 (located within a daily demand area seen at 1.2536-1.2585).
Levels to watch/ live orders:
- Buys: Flat (Stop loss: N/A).
- Sells: 1.2700 [Tentative – confirmation required] (Stop loss: dependent on where one confirms this level).
USD/CHF:
Weekly recap:
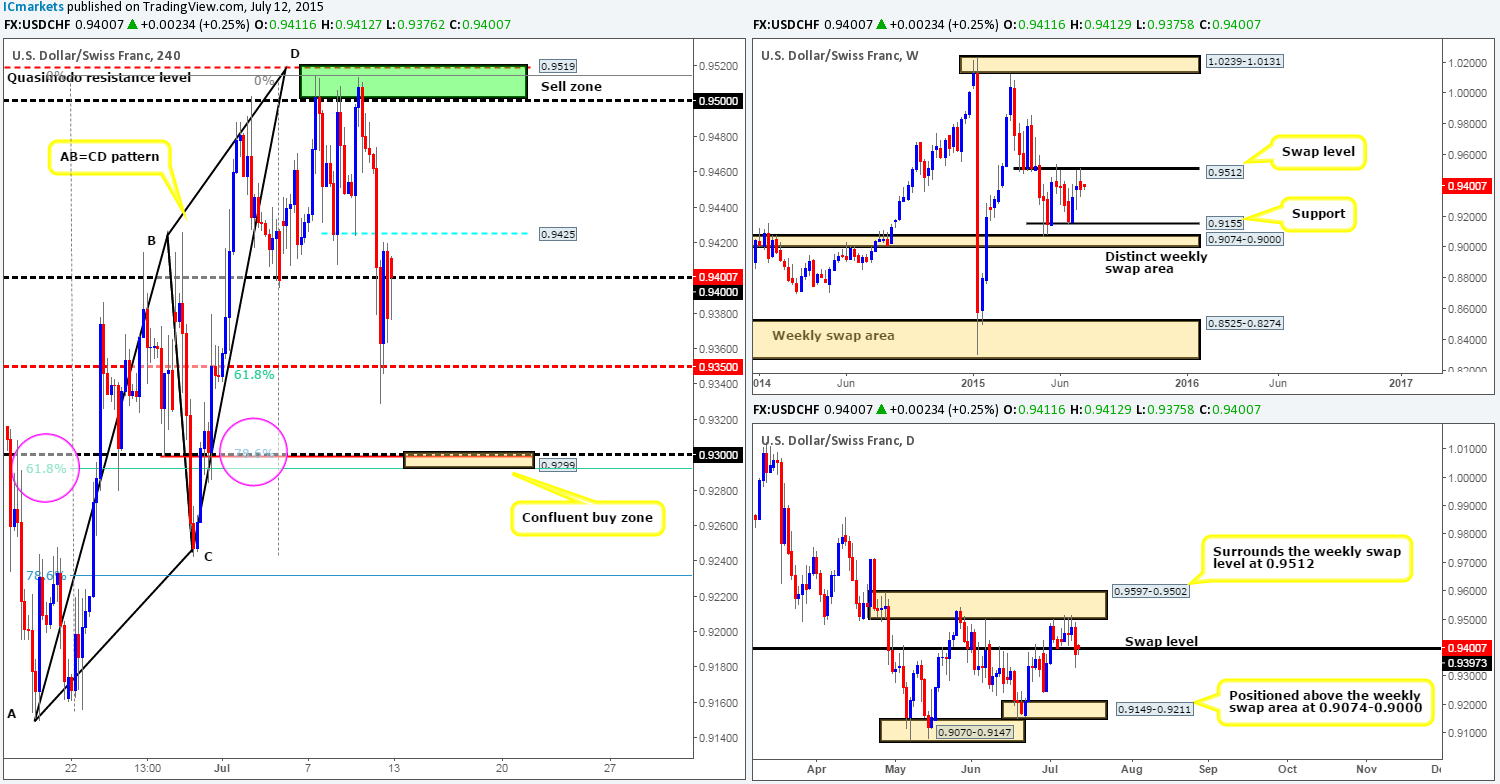
Last week’s trading shows that price respected the weekly swap level at 0.9512, which consequently pushed prices lower and engulfed the prior week’s indecision candle body (0.9381/0.9398) into the close 0.9377. In addition to this, we also saw the market take out the daily swap level at 0.9397. With this in mind, both the weekly and daily charts show there is potential room to move lower this week.
Moving down into the pit of the 4hr timeframe, the 4hr Harmonic AB=CD reversal zone seen in green at 0.9500/0.9519 (positioned around a weekly swap level at 0.9512 and also located just within a daily supply zone coming in at 0.9597-0.9502) did eventually send this market lower after the third visit. This selloff took out both the minor 4hr support barrier at 0.9425 and the round number 0.9400 before smashing into the mid-level border 0.9350, which was aggressively defended going into the weekly close.
Progressing into this week, we can see that price gapped north at the open 0.9416, consequently placing price above the round number 0.9400. If this level holds as support today, and we see price take out 0.9425, price will likely head north back up towards 0.9500. With that, for us to be given the ‘green light’ to trade this potential move, we would need to see not only a retest of 0.9425 as support, but also lower timeframe buying confirmation as well. Do bear in mind though that by trading long from here, you’ll likely be going up against possible selling opposition from the weekly swap level 0.9512, so constant monitoring of any long positions is highly recommended.
Should we see price close below 0.9400, however, this could stimulate a further decline in value down to at least the mid-level barrier 0.9350, which as you can see lines up nicely with the Fibonacci retracement 61.8% value. Therefore should a confirmed retest be seen at 0.9400, we would very likely take a short trade here, targeting 0.9350 as our first take-profit target. Although we feel a bounce will be seen from here, we do not believe it will be enough to stop price from reaching 0.9300, which converges with not only a 4hr Quasimodo support level at 0.9299, but also two Fibonacci retracement values – the 61.8% and the 78.6% (pink circles). We expect quite an aggressive bounce from this barrier considering its confluence, as such; this would be our final take-profit target on any shorts taken from 0.9400.
Levels to watch/ live orders:
- Buys: Flat (Stop loss: N/A).
- Sells: Flat (Stop loss: N/A).
DOW 30
Weekly recap:
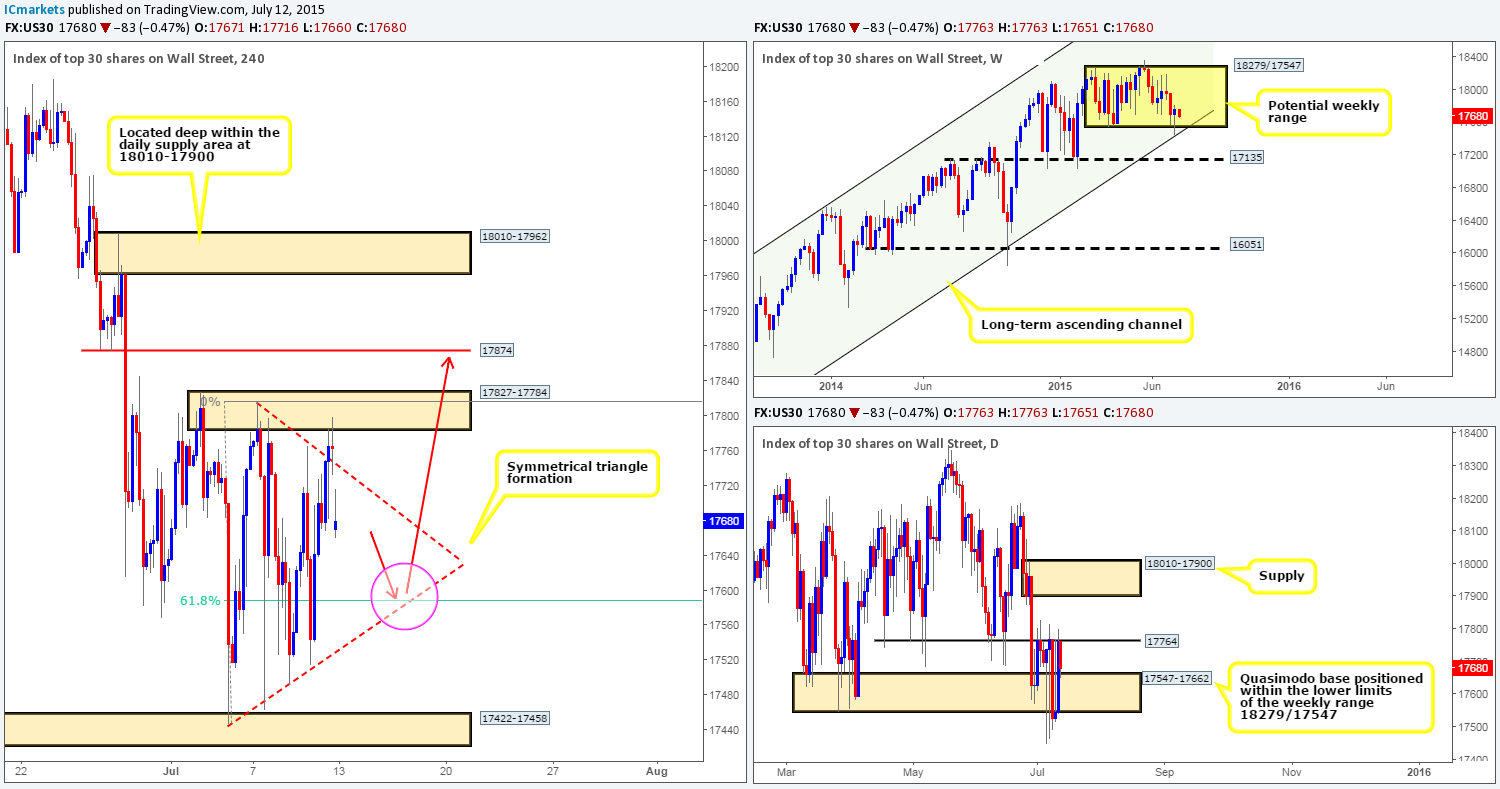
Last week’s movement saw the DOW index print an absolutely beautiful bullish pin-bar candle from the lower limits of a potential weekly range at 18279/17547, which also had the backing of a converging long-term weekly ascending channel extended from the low 10402 and the high 13270. The daily picture, however, was not so pleasing to the eye. There was an accumulation of messy wicks and tails printed throughout the week oscillating back and forth through a clearly worn out daily Quasimodo base at 17547-17662. Nonetheless, what we did get from this timeframe is that there is a distinct ceiling of offers at 17764 which has been able to hold the market lower now for two weeks.
Checking in on the 4hr timeframe, we can see that Friday’s action broke out above the symmetrical triangle (down trendline taken from the high 17816 – up trendline taken from the low 17447) and crossed swords with a 4hr supply area at 17827-17784, consequently forming a 4hr indecision candle going into the weekly close 17763.
Pushing forward, this morning’s trade gapped 92 pips lower at the open 17671, consequently forcing price back into the 4hr symmetrical triangle pattern.
With price currently trading off of clear weekly support at the moment (see above), it is likely that the daily swap (resistance) level at 17764, which has proven a tough nut to crack, will eventually give way. Therefore, in a step-by-step fashion, here is our view on the most likely scenario today and possibly into the week. Well-funded traders will likely require liquidity to buy into this market, so a sell off will likely be seen today enticing sellers to short with the momentum down to the lower limit of the symmetrical triangle pattern (17596 area), which as you can see also coincides nicely with a Fibonacci retracement value of 61.8%. Now once/if we reach here, we have no intention of buying at market, as we’re expecting a fakeout here to collect more liquidity for a push north (sell stops will be used to buy into the market). It is only once we see the fakeout, will our team then begin hunting on the lower timeframes for an entry north. In the event that this all comes to fruition and we manage to spot a nice-looking buy entry on the lower timeframes, we’ll then be looking to target the 4hr swap level 17874 since this represents the lower limit of a the daily supply area seen at 18010-17900.
Levels to watch/ live orders:
- Buys: 17596 [Tentative – confirmation required] (Stop loss: dependent on where one confirms this level).
- Sells: Flat (Stop loss: N/A).
XAU/USD: (Gold)
Weekly recap:
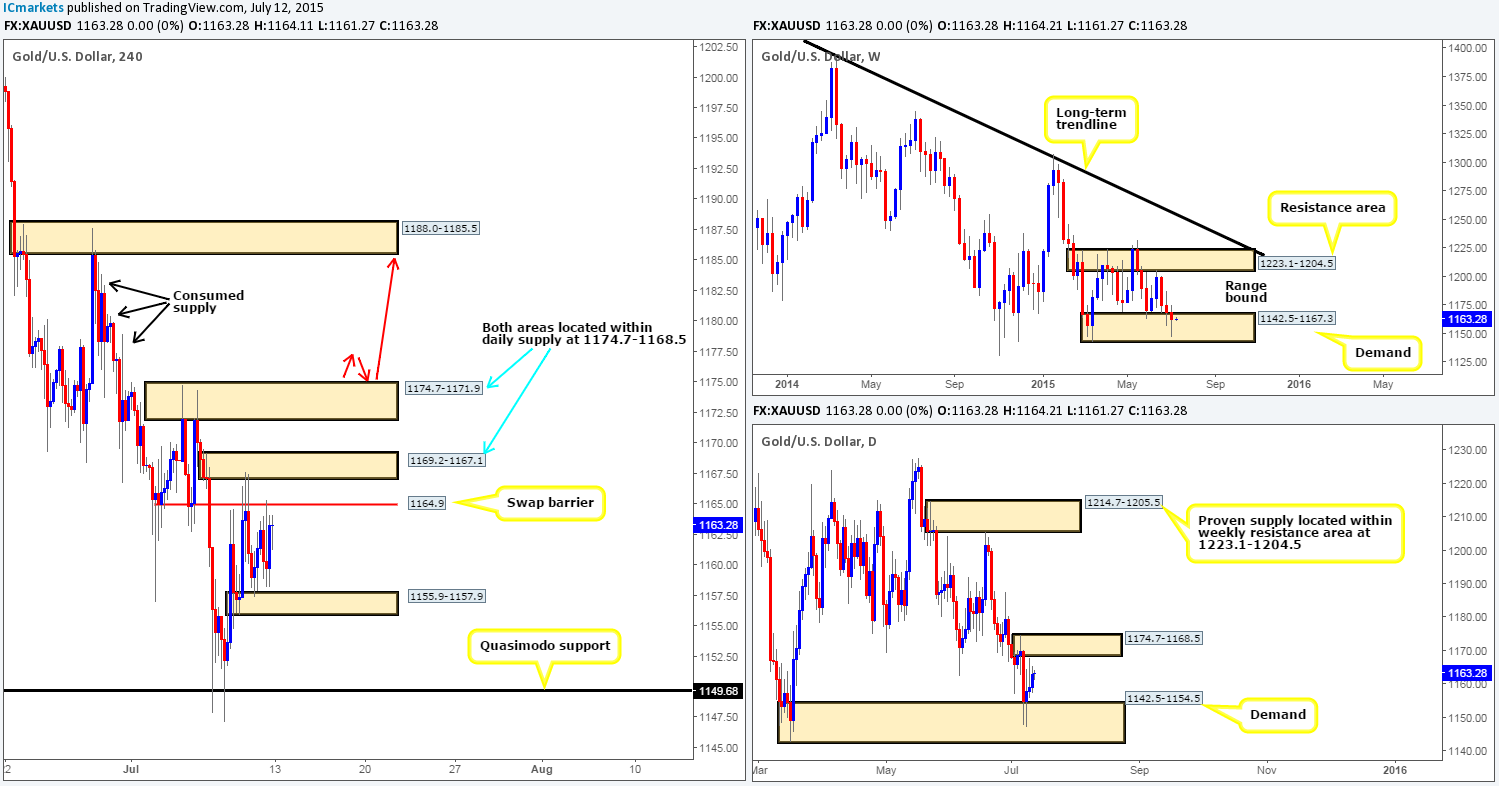
Although we can see that Gold did in fact decline in value during the course of last week’s trading, the buyers still managed to hold the fort within the confines of a weekly demand area visible at 1142.5-1167.3. This became even clearer once we opened the daily chart and saw price had printed higher closes from Wednesday onwards off of a daily demand area that is lodged deep within the aforementioned weekly demand zone at 1142.5-1154.5. However, let’s not all go hitting the buy buttons just yet as there is a near-term daily supply zone seen just above at 1174.7-1168.5 which could potentially repel the market this week.
Dropping in on the 4hr timeframe, there was not much to report during Thursday and Friday’s trading sessions, as price spent much of its time oscillating between a 4hr demand area at 1155.9-1157.9 and a 4hr swap barrier at 1164.9.
Going into this week’s session, price remained unaffected during the weekend as price opened at the point of Friday’s close, 1163.2. Therefore, as far as today’s trading is concerned, price will likely remain within the aforementioned 4hr areas mentioned above, which our team has very little interest in trading.
Going further into the week, however, we are expecting Gold to eventually rally. Granted, the daily supply area at 1174.7-1168.5 will likely be troublesome, but with price sitting in weekly demand (1142.5-1167.3) at the moment, it should not be too difficult to consume. Once/if we see this daily area has been taken out, the path north on the 4hr timeframe is likely clear up to a 4hr supply area coming in at 1188.0-1185.5 which could potentially provide a nice buying opportunity sometime this week as per the red arrows. The reason for why we believe the path north is clear above here comes from seeing little active supply to the left above the current daily supply area on the 4hr scale. Check out the supply consumption wicks marked with black arrows seen at: 1178.9/1180.4/1183.5.
Levels to watch/ live orders:
- Buys: Flat (Stop loss: N/A).
- Sells: Flat (Stop loss: N/A).